0536
Investigating timing of BOLD fMRI responses in individual cortical vessels to short and long stimulus durations1Athinoula A. Martinos Center for Biomedical Imaging, Massachusetts General Hospital,, Charlestown, MA, United States, 2Radiology, Harvard Medical School, Boston, MA, United States, 3The University of Queensland, St Lucia, Australia, 4Physics, Carleton University, Ottawa, ON, Canada, 5Harvard-MIT Division of Health Sciences and Technology, Massachusetts Institute of Technology,, Cambridge, MA, United States
Synopsis
Keywords: fMRI Acquisition, fMRI, Vessels, Vascular, Gray Matter, Oxygenation, fMRI (task based), fMRI Acquisition, fMRI Analysis, Hemodynamics
Motivation: Typical fMRI data observes hemodynamics from multiple vascular compartments in each voxel, however understanding the link between neuronal and vascular dynamics will require vessel-specific measurements.
Goal(s): To investigate the timing and amplitude of hemodynamic responses within individual arteries and veins of the human cortex and assess how they change with stimulus duration.
Approach: We applied single-vessel fMRI with multiple echoes to separate inflow and BOLD components, and distinguished intravascular and extravascular dynamics in and around arteries and veins.
Results: We observed faster dynamics in arteries, and a post-stimulus undershoot in all vessels, potentially providing new insights into hemodynamics in the human brain
Impact: Knowledge about hemodynamics within individual vascular compartment is provided by invasive microscopy in small-animal models, and less is known about hemodynamics in humans. Here we present vessel-specific measurements of hemodynamics in humans and reveal unexpected features in the fMRI response.
Introduction
With typical fMRI resolutions, multiple vascular compartments are contained within each voxel, making inference of vessel-specific hemodynamics challenging. Previously1, we demonstrated that single-vessel fMRI2-4 could identify unexpectedly high intravascular BOLD changes in the human cortex at 7T, and that substantial BOLD- and inflow-weighted responses could be detected in arteries and veins, with some indication of a difference in timing between arteries and veins. While prior evidence supports the existence of arterial BOLD5-6, our data suggested a post-stimulus undershoot in the arterial response in humans, which may help resolve the uncertain origins of the post-stimulus undershoot in conventional BOLD data7.Here we replicate our previous findings and expand upon them with higher spatial and temporal resolution, investigate whether these dynamics change between short- and long-duration stimuli, and compare intravascular and extravascular BOLD dynamics. Because much of our “ground-truth” understanding of individual-vessel dynamics is provided by invasive in-vivo microscopy in small-animal models which use short-duration stimuli, whereas human fMRI often uses long-duration stimuli8, thus our data can potentially help further bridge the gap between microscale and mesoscale hemodynamic imaging.
Methods
Three human volunteers provided written informed consent prior to scanning, following all policies of our institution’s Human Subjects Research Committee. MRI data were acquired on a whole-body 7T scanner (Magnetom Terra, Siemens) using an inhouse-built 64-channel receive-coil head-array9. FMRI data consisted of one oblique-coronal slice of four-echo FLASH positioned on the calcarine sulcus with protocol parameters TE=[4, 8, 12, 17] ms, TR=29 ms, FA=30°, voxel size 0.4 $$$\times$$$ 0.4 $$$\times$$$ 1.2 mm3, bandwidth=400 Hz/pix, GRAPPA R=4 with 48 auto calibration lines and volume TR of 4 s. Visual stimulation consisted of a standard flashing “dartboard” pattern (with a fixation task), presented in a block design with 4 s / 16 s on and 24 / 40 s off. Each run lasted 168 / 308 s and consisted of five jittered trials to achieve a temporal sampling interval of 0.8 s. We acquired 8 / 4 runs during each session. We used the AutoCorrect framework10 to update slice prescriptions between runs to account for through-plane head motion.To identify vessels, we also acquired an Artery-Vein (A-V) map consisting of 2D multi-echo FLASH with high-in-plane resolution (0.25 $$$\times$$$ 0.25 $$$\times$$$ 1.2 mm3) and high flip-angle to promote time-of-flight (TOF) contrast. Vessels could be identified by their TOF contrast, and arteries were distinguished from veins based on their fitted T2* value.
We performed a standard GLM analysis assuming a canonical BOLD HRF using AFNI11. We analyzed block-responses in the earliest and latest echoes to differentiate inflow and BOLD changes within vessels and the surrounding parenchyma. We compared timing by normalizing the response between its baseline and peak values.
Results
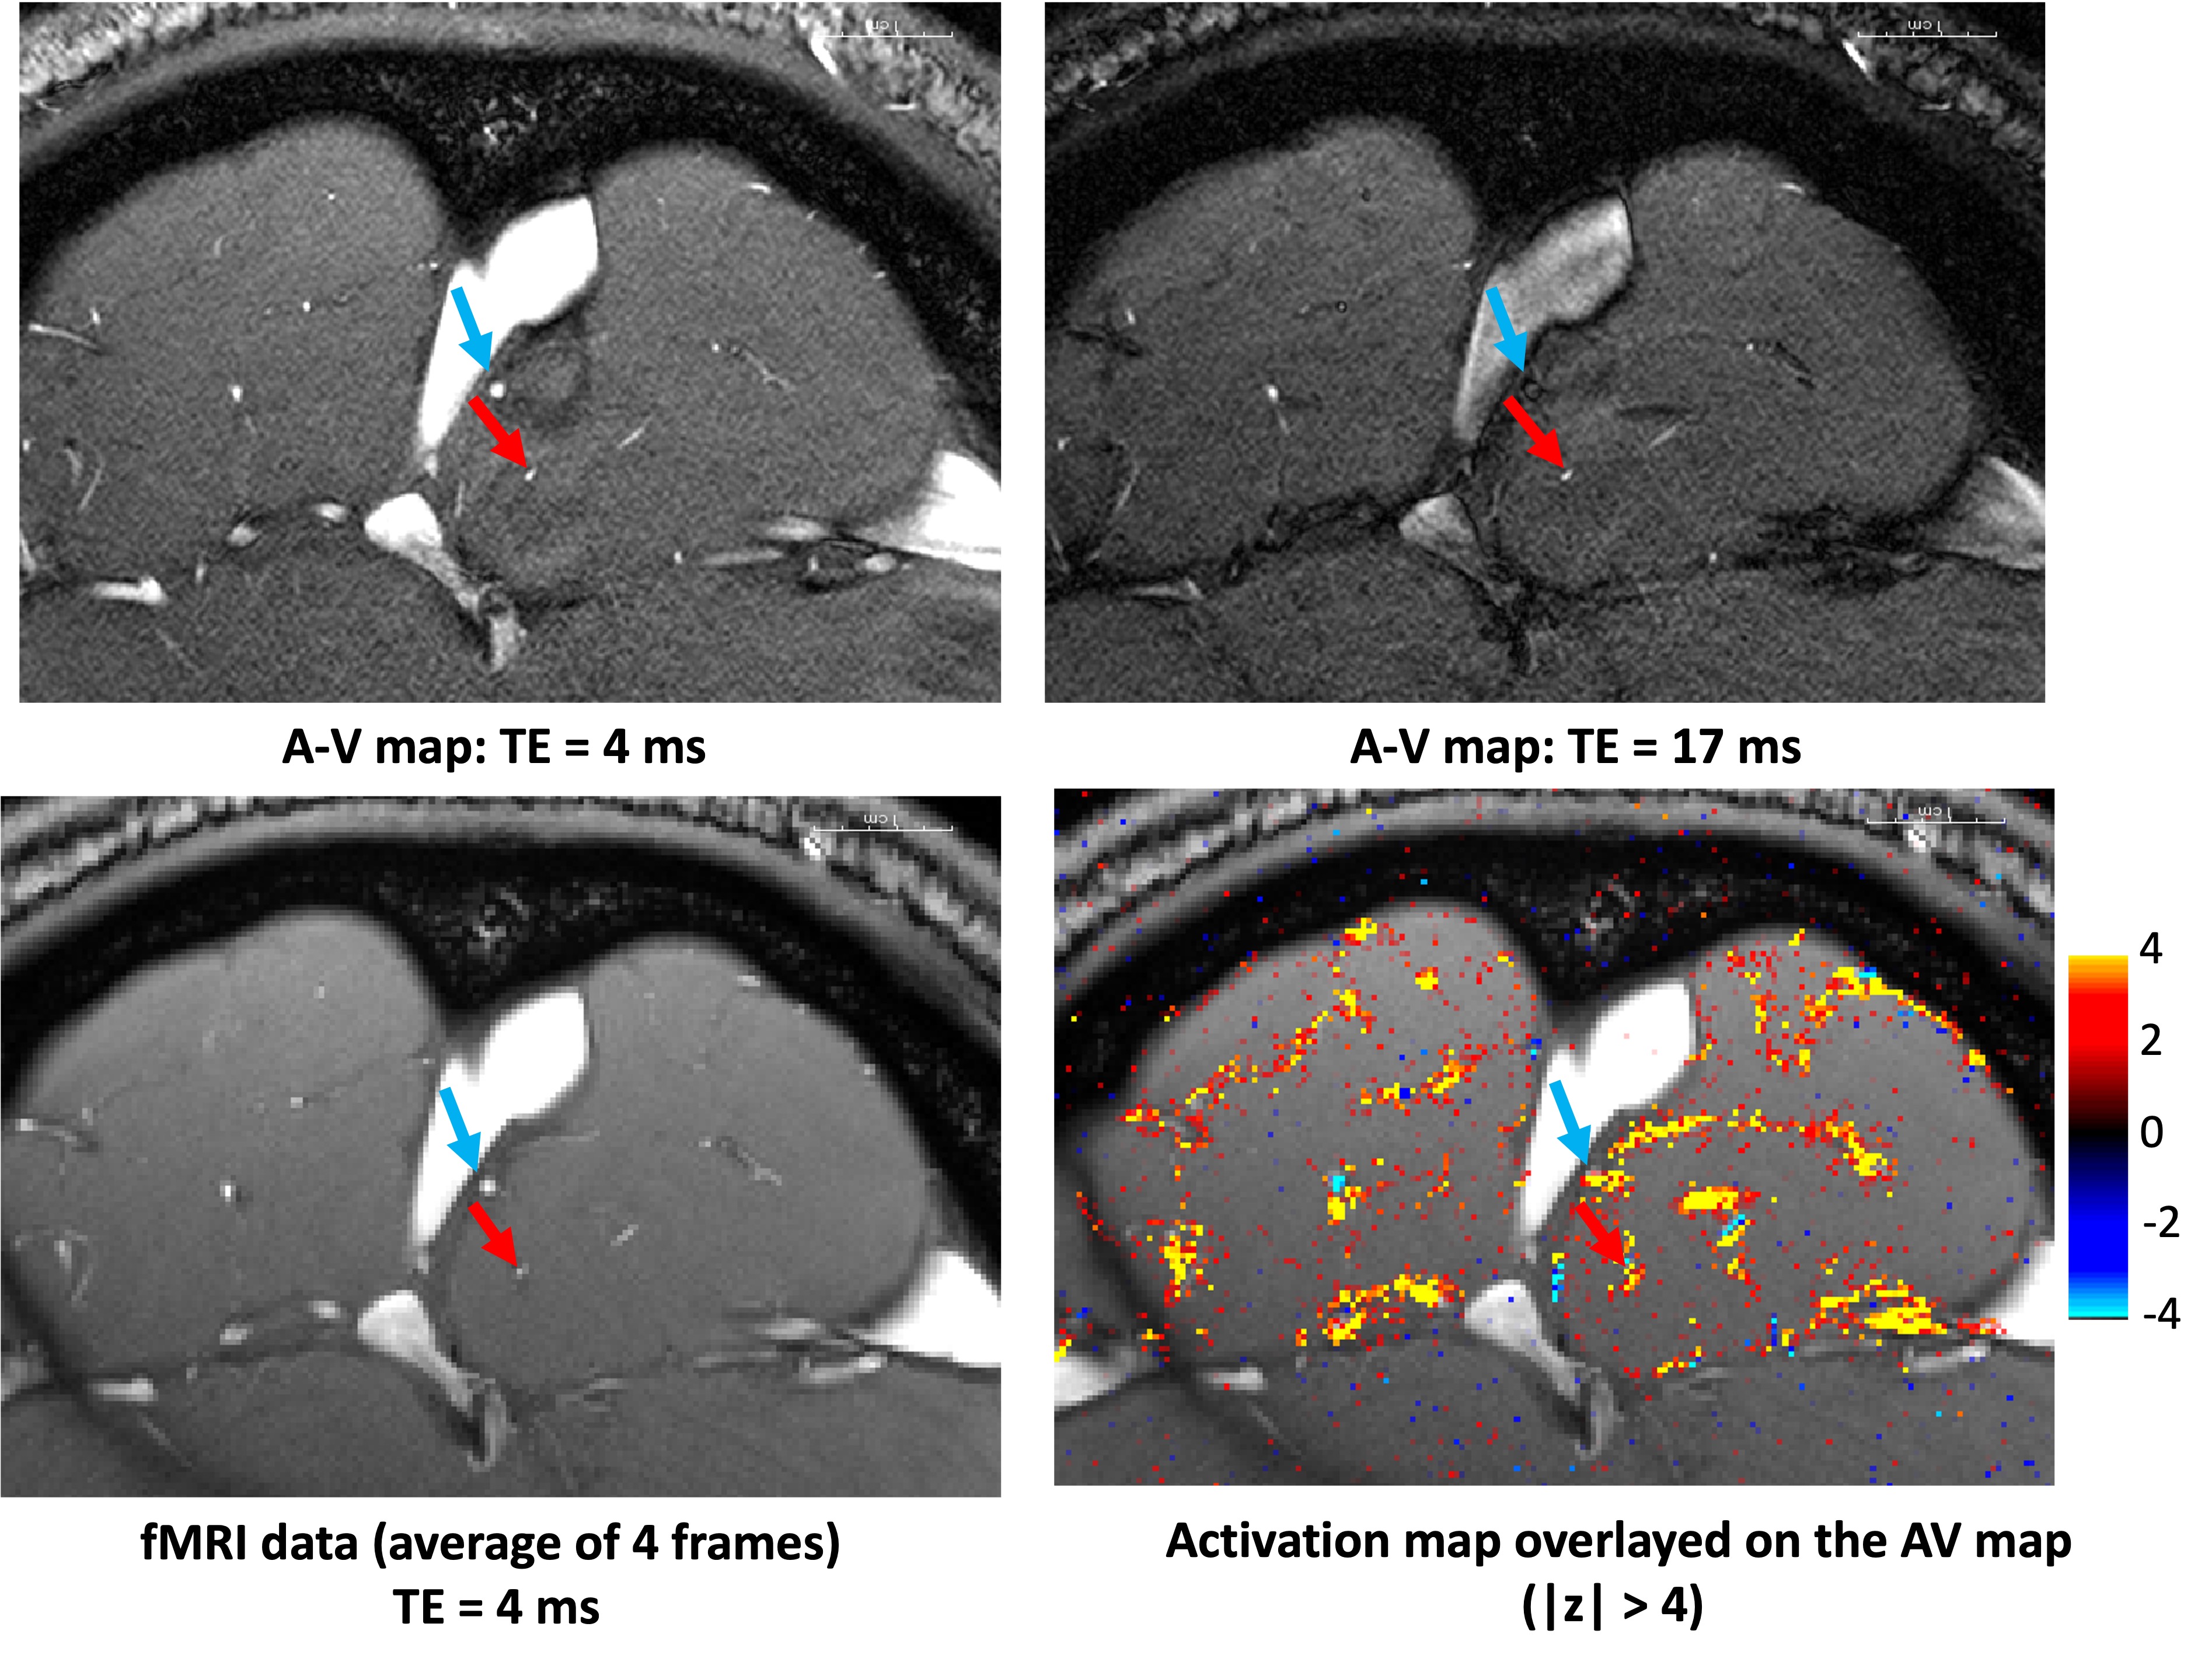
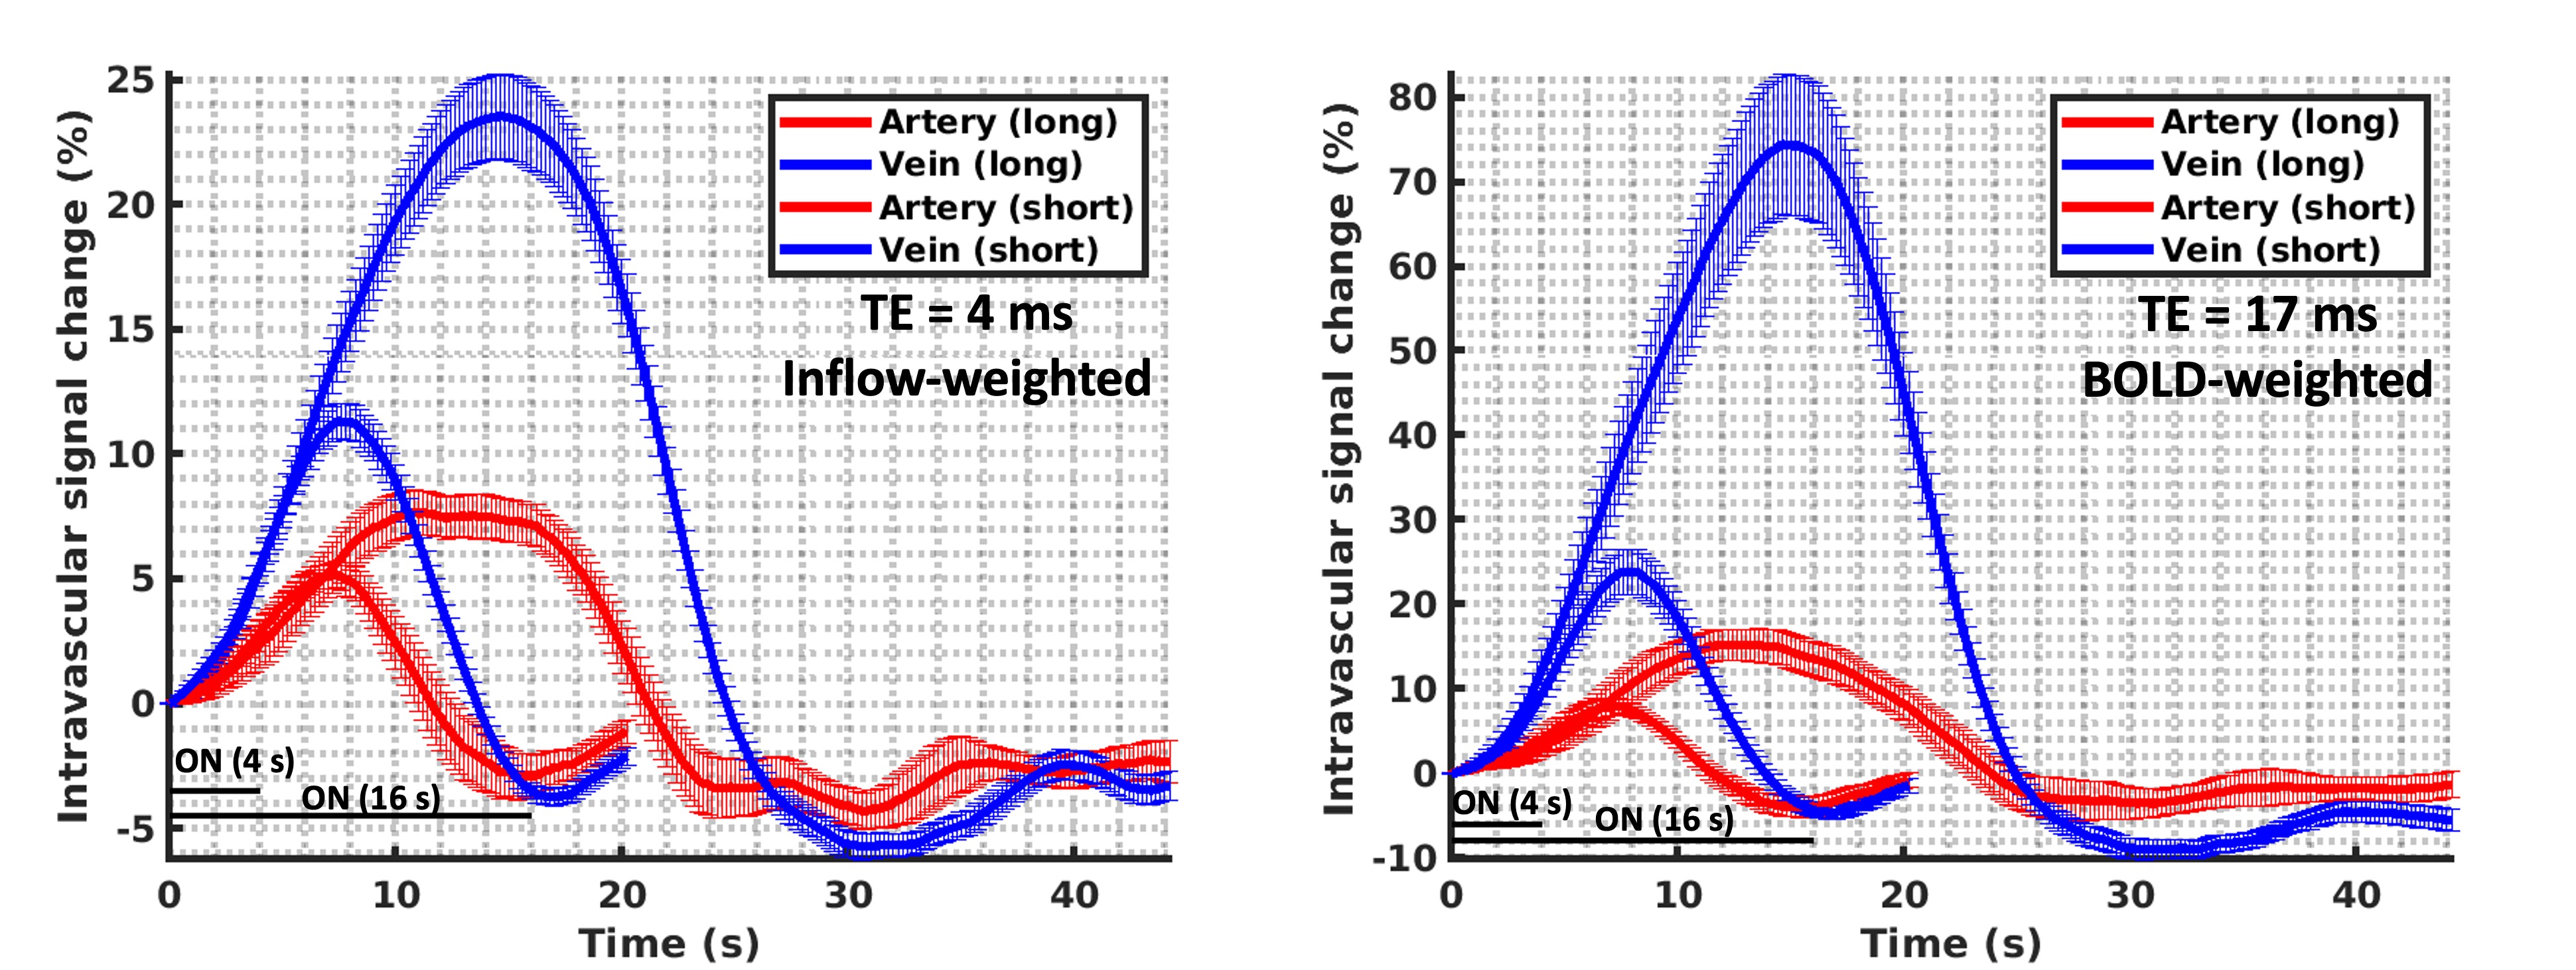
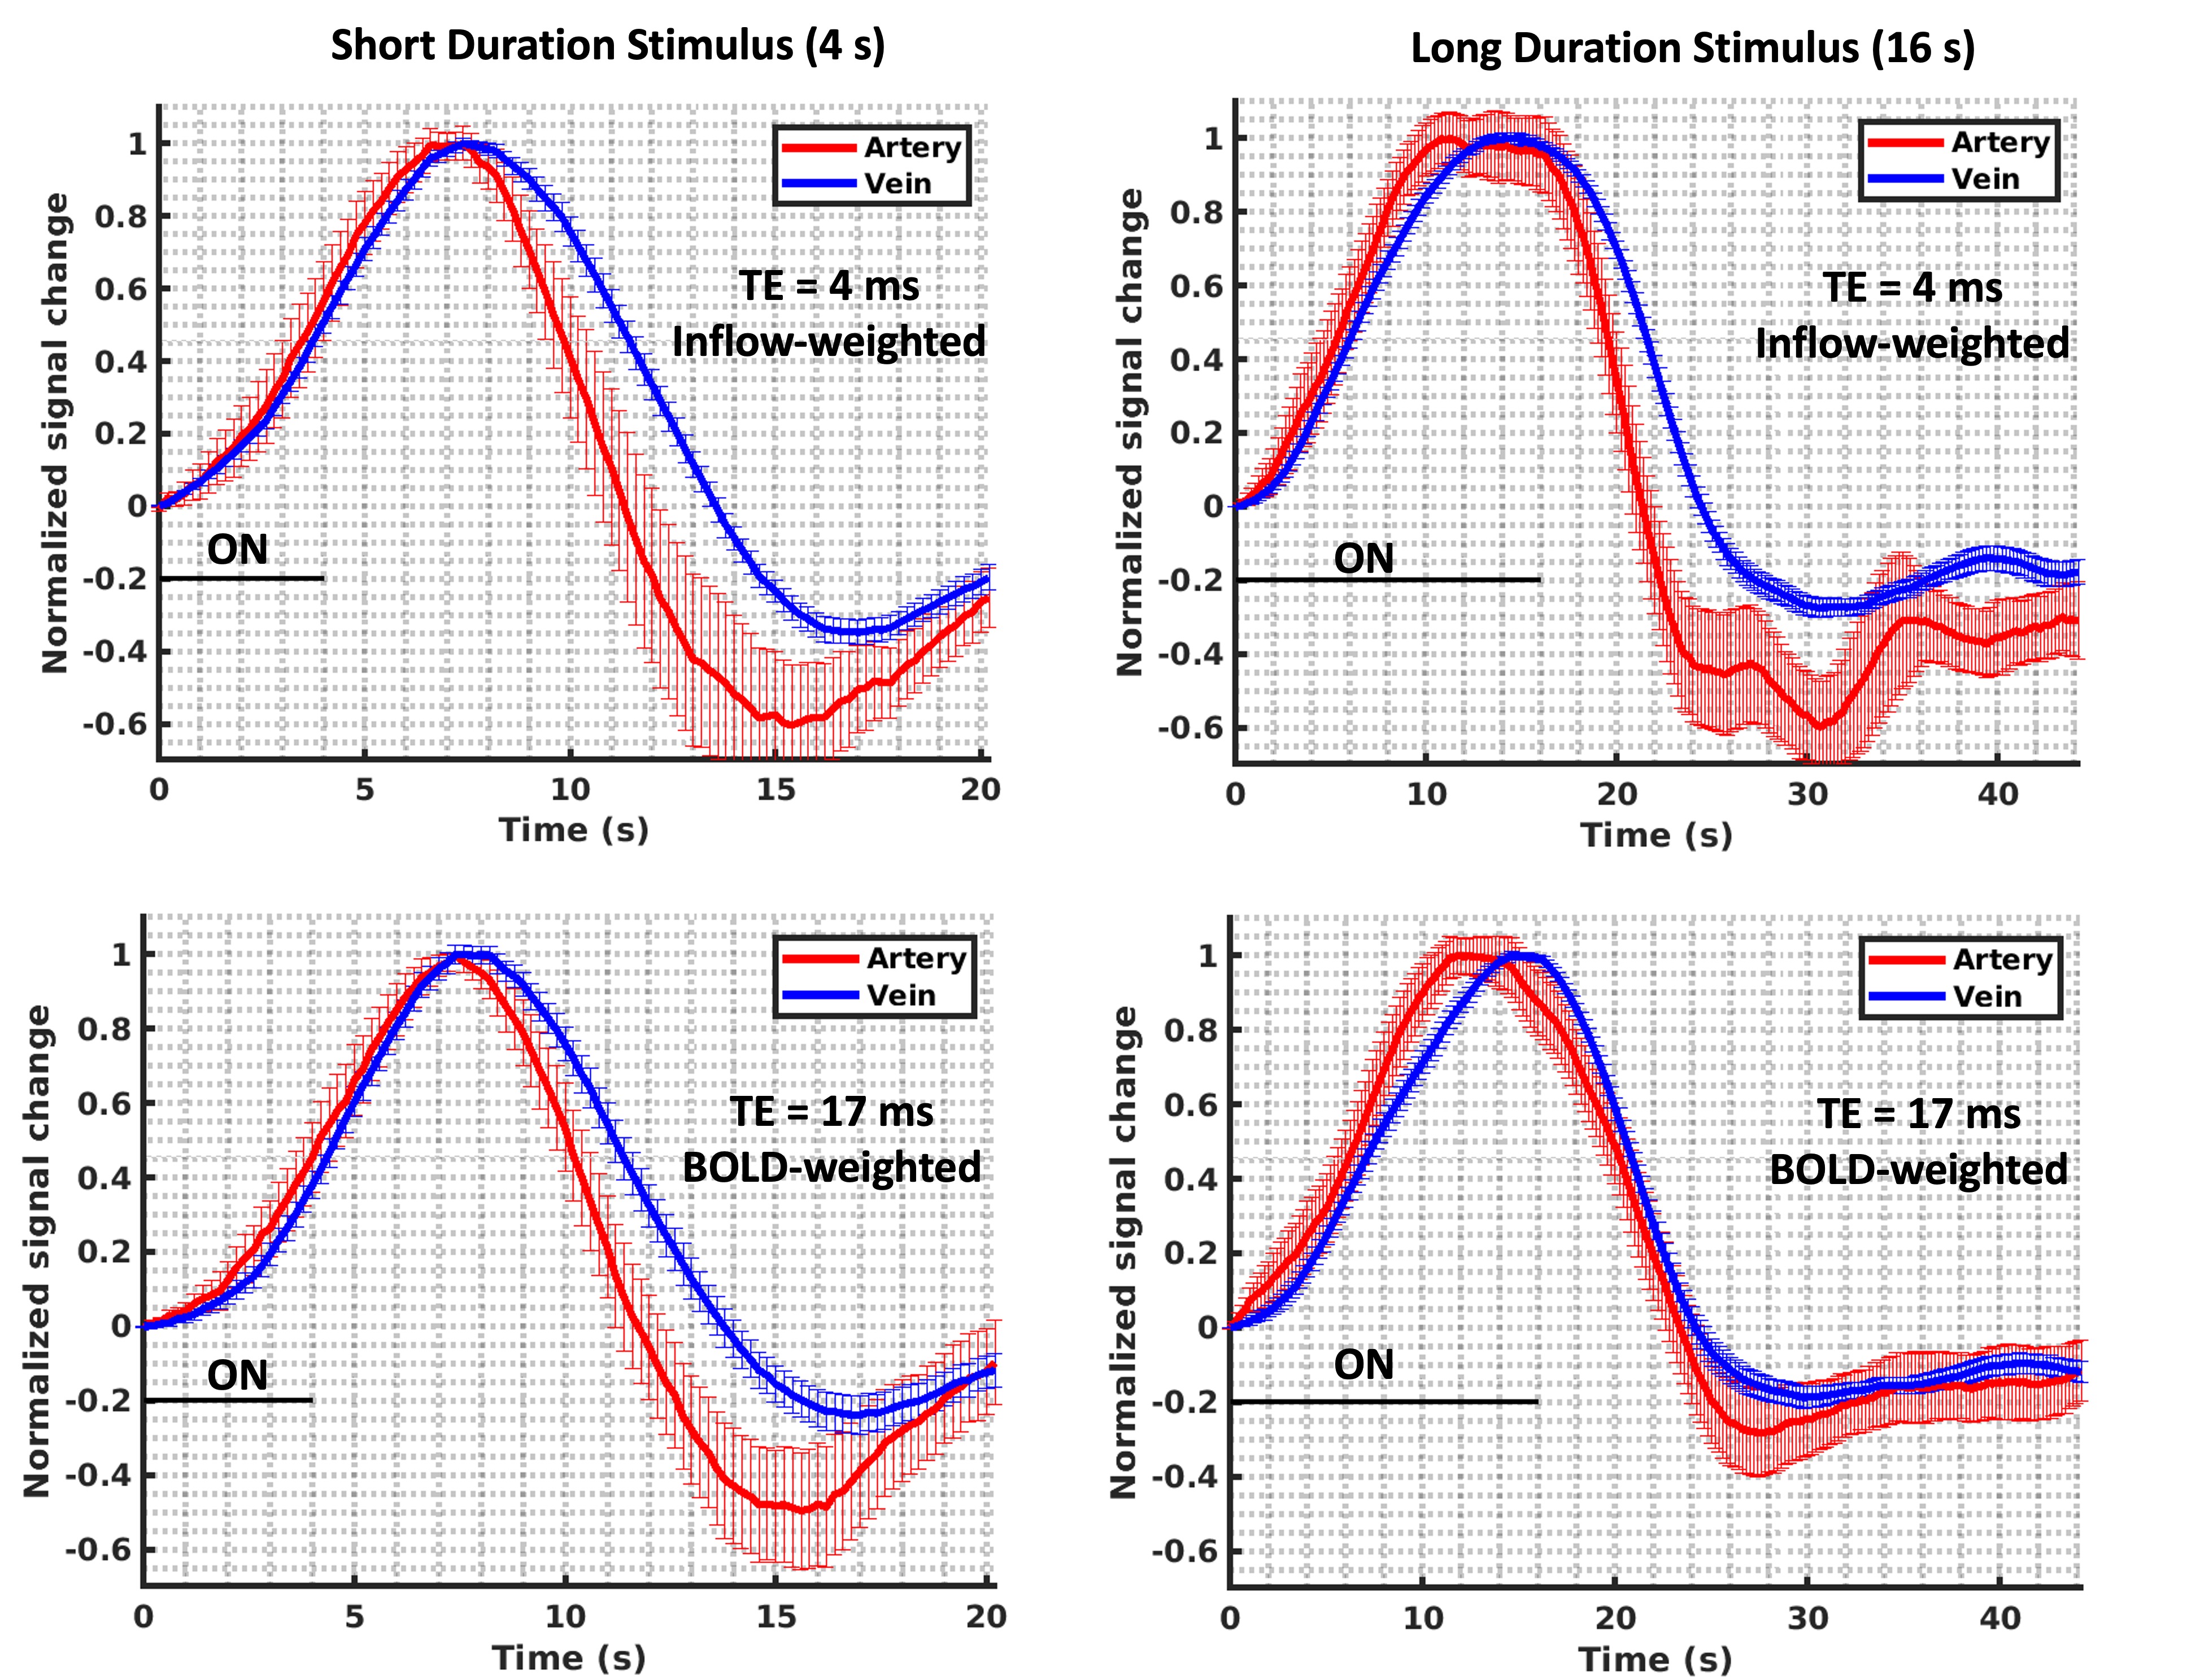
Figure 1 shows an A-V map, with all vessels bright due to inflow contrast at short TE, and veins becoming dark at long TE. Included is a frame of fMRI data showing both vessels and the corresponding activation map. The inflow-weighted (TE = 4 ms) and BOLD-weighted (TE = 17 ms) intravascular response to 4-s- and 16-s-long stimulation differ in their amplitude and timing for arteries and veins, as shown in Figure 2.The normalized signal response in Figure 3 demonstrates that hemodynamics in arteries appears faster than that of veins, especially for short-duration stimulation. Both inflow-weighted and BOLD-weighted data consistently exhibit faster arteriolar responses, with a 2 s earlier time-to-baseline in response to short-duration stimulation. Time-to-peak for arteries is earlier by ~3 s for long-duration stimulation. Lastly, we also observe a 4-s earlier time-to-baseline for the inflow-weighted response to long-duration stimulation. A post-stimulus undershoot is seen in all vessels but is more prominent and consistently earlier in arteries.
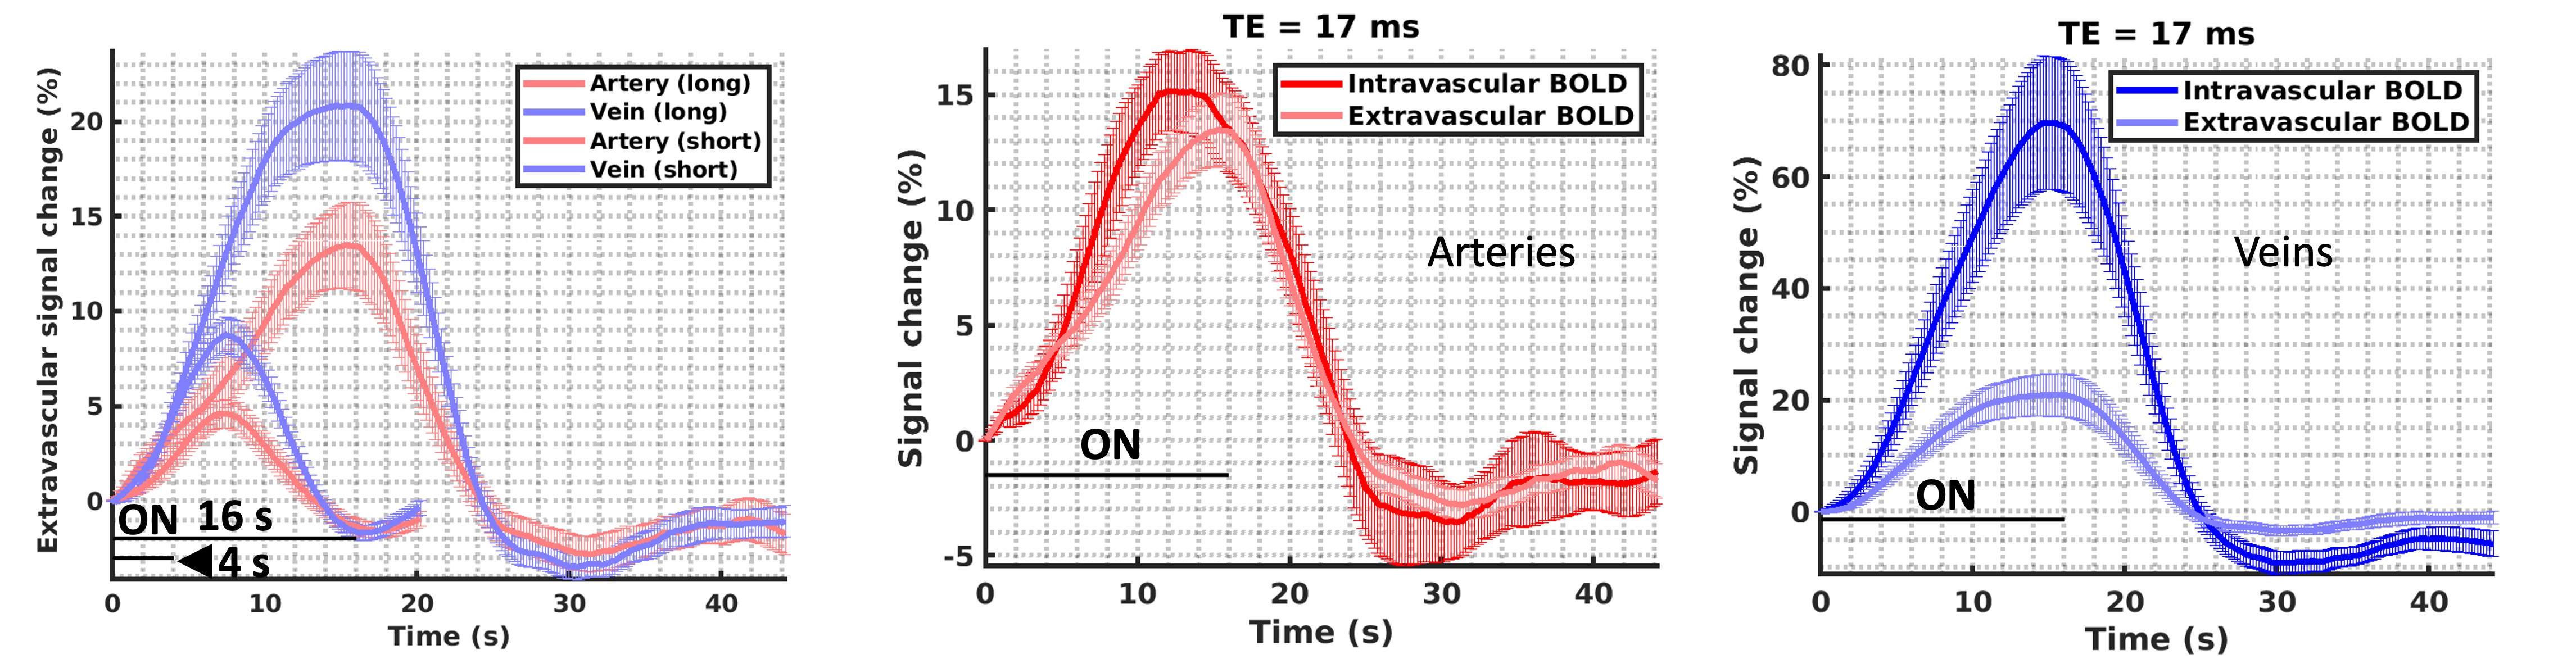
The extravascular response adjacent to each identified vessel was weaker than the intravascular response in arteries and veins (Figure 4), although this may be partly due to lower baseline signal level. Arteriolar and venular extravascular responses have different timings that closely follow the vessel they are surrounding, as expected.
Discussion and Conclusion
We demonstrated both BOLD- and inflow-weighted components of the hemodynamic responses in arteries and veins, and observed faster dynamics in arteries. This difference was most pronounced with short-duration stimulation. Next steps will involve fitting T2* with our multi-echo data to further separate blood velocity and oxygenation components of the hemodynamics, and further interpretation of these results using biophysical models.Acknowledgements
We would like to thank Estee Perelgut, Sarah Richter and Kyle Droppa for their help with subject recruitment and MRI scanning support, Azma Mareyam for 7T hardware support, and Drs. Sava Sakadžić and Xin Yu for their helpful feedback. This work was supported in part by the NIH NIBIB (grants P41-EB030006, R01-EB019437 and R01-EB032746), by the BRAIN Initiative (NIH NIMH grant R01-MH111419 and NIH NINDS grant U19-NS123717), and by the MGH/HST Athinoula A. Martinos Center for Biomedical Imaging; and was made possible by the resources provided by NIH Shared Instrumentation Grant S10-OD023637.References
- Varadarajan D., Wighton P., Chen J., Proulx S., Frost R., van der Kouwe A., Berman A., Polimeni J. R., Measuring individual vein and artery BOLD responses to visual stimuli in humans with multi-echo single-vessel functional MRI at 7T. International Society for Magnetic Resonance in Medicine, 2023, p. 3663.
- Yu, X., Glen, D., Wang, S., Dodd, S., Hirano, Y., Saad, Z. S., Reynolds, R., Silva, A. C., & Koretsky, A. P. (2012). Direct imaging of macrovascular and microvascular contributions to BOLD fMRI in layers IV-V of the rat whisker-barrel cortex. NeuroImage, 59(2), 1451–1460. https://doi.org/10.1016/j.neuroimage.2011.08.001
- Yu, X., He, Y., Wang, M., Merkle, H., Dodd, S. J., Silva, A. C., & Koretsky, A. P. (2016). Sensory and optogenetically driven single-vessel fMRI. Nature Methods, 13(4), 337–340. https://doi.org/10.1038/nmeth.3765
- He, Y., Wang, M., Chen, X., Pohmann, R., Polimeni, J. R., Scheffler, K., Rosen, B. R., Kleinfeld, D., & Yu, X. (2018). Ultra-slow single-vessel BOLD and CBV-based fMRI spatiotemporal dynamics and their correlation with neuronal intracellular calcium signals. Neuron, 97(4), 925-939.
- Sakadzić S, Roussakis E, Yaseen MA, et al. Two-photon high-resolution measurement of partial pressure of oxygen in cerebral vasculature and tissue. Nat Methods. 2010;7(9):755-759. doi:10.1038/nmeth.1490
- Tong, Y., Yao, J.F., Chen, J.J., Frederick, B.D., 2018. The resting-state fMRI arterial signal predicts differential blood transit time through the brain. J. Cereb. Blood Flow Metab. 271678X17753329.
- Lu H, van Zijl PC. A review of the development of Vascular-Space-Occupancy (VASO) fMRI. Neuroimage. 2012 Aug 15;62(2):736-42. doi: 10.1016/j.neuroimage.2012.01.013. Epub 2012 Jan 8. PMID: 22245650; PMCID: PMC3328630.
- Polimeni JR, Lewis LD. Imaging faster neural dynamics with fast fMRI: A need for updated models of the hemodynamic response. Prog Neurobiol. 2021 Dec;207:102174. doi: 10.1016/j.pneurobio.2021.102174. Epub 2021 Sep 12. PMID: 34525404; PMCID: PMC8688322.
- Mareyam A, Kirsch JE., Chang Y, Madan G, Wald LL. A 64-Channel 7T array coil for accelerated brain MRI, International Society for Magnetic Resonance in Medicine, 2020, p. 0764
- van der Kouwe AJ, Benner T, Fischl B, Schmitt F, Salat DH, Harder M, Sorensen AG, Dale AM. On-line automatic slice positioning for brain MR imaging. Neuroimage. 2005 Aug 1;27(1):222-30. doi: 10.1016/j.neuroimage.2005.03.035. PMID: 15886023.
- Cox RW. AFNI: Software for analysis and visualization of functional magnetic resonance neuroimages. Computers and Biomedical Research, 29:162-173, 1996.
Figures