0535
Measure the synchrony of fMRI signals on group-averaged fiber architectures1Department of Radiology and Huaxi MR Research Center (HMRRC), Functional and Molecular Imaging Key Laboratory of Sichuan Province, West China Hospital, Sichuan University, Chengdu, Sichuan, China, 2Research Unit of Psychoradiology, Chinese Academy of Medical Sciences, Chengdu, Sichuan, China, 3College of Electronic Engineering, Chengdu University of Information Technology, Chengdu, Sichuan, China, 4GE HealthCare MR Research, Beijing, China
Synopsis
Keywords: fMRI Analysis, Data Analysis, Synchrony
Motivation: Fiber architecture-informed synchrony mapping (FAISM) has been proposed to capture task-evoked nonlinear brain activations, which involves image acquisitions of fMRI and high angular resolution diffusion image MRI (HARDI) with a long scan time and thus limits its applications.
Goal(s): The aim of this study is to modify the FAISM approach to mapping brain activation without time-consuming acquisitions of the HARDI data.
Approach: Hence, group-averaged fiber structures were used to replace the individual data to perform a fast FAISM.
Results: This approach demonstrates a high reproducibility at an individual level, which suggests that it can be used for reliable detections of nonlinear brain activation.
Impact: This approach is expected to serve as a standardized tool to measure neural activations with nonlinear hemodynamic responses.
Introduction
The general linear model (GLM) is widely used for mapping task-evoked activations with an assumption that fMRI signals can be modeled by convolving the time course of the expected neural activity with a hemodynamic response function (HRF)1,2. However, the nonlinear nature of neurovascular coupling and background brain activities in the white matter that are unrelated to extrinsic task stimuli could result in an inadequate mapping of the task-evoked activations3,4. Fiber architecture-informed synchrony mapping (FAISM) has been proposed to capture task-evoked nonlinear brain activations, which involves image acquisitions of fMRI and high angular resolution diffusion MRI with a long scan time and thus limits its practical applications5. In this work, to reduce the scan time, we propose an approach that relies on group-averaged fiber structures to perform a fast FAISM.Methods
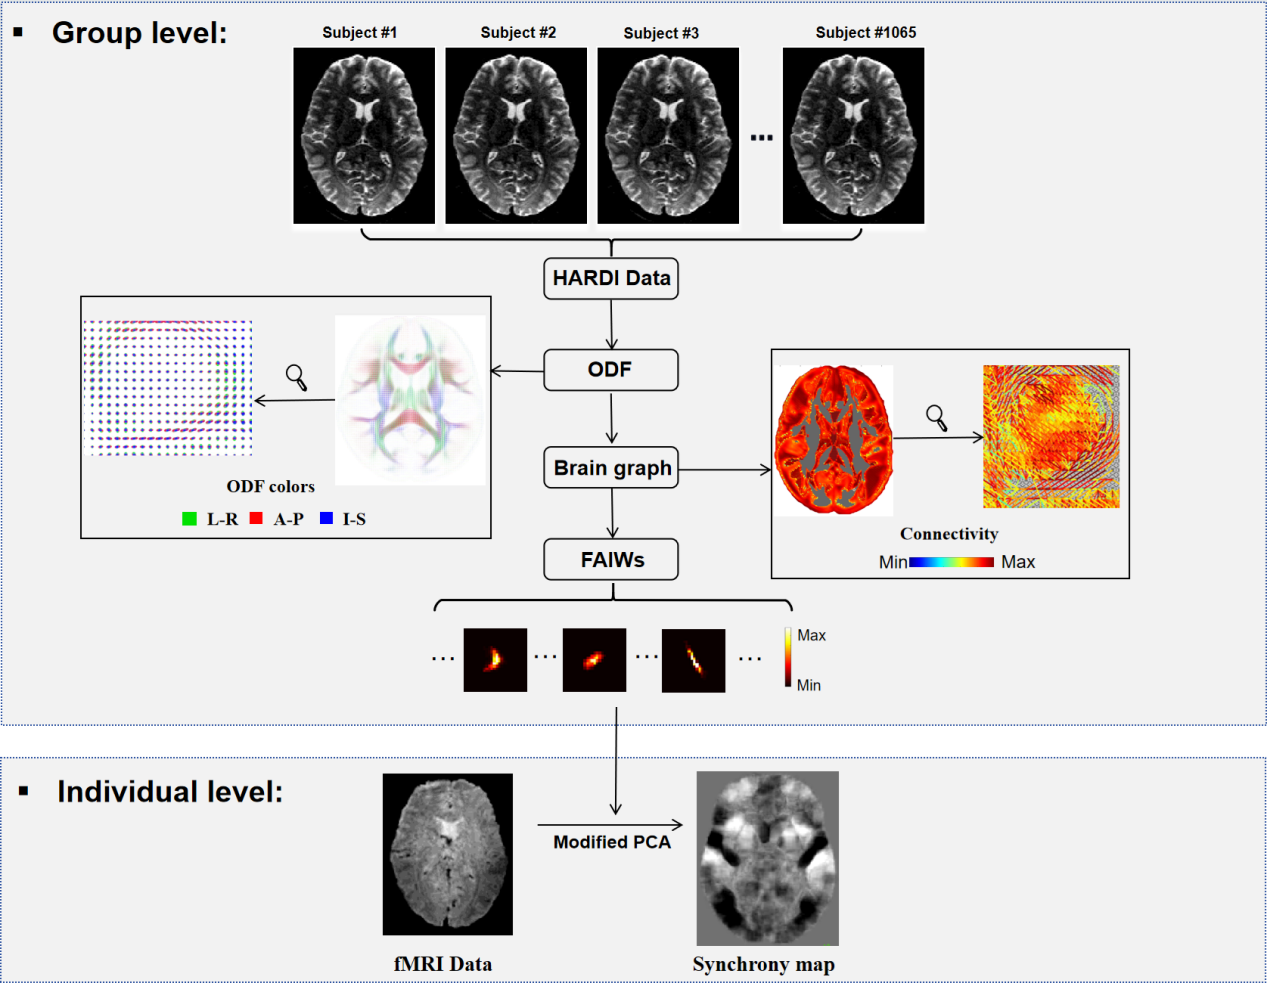
The resting-state fMRI data used in this study at the individual level were acquired using a 3T MRI scanner (SIGNA Premier, GE Healthcare) with a 48-channel head coil. After the informed consent of the participants, two independent resting-state data scans were performed with the following scanning parameters: repetition time (TR) = 2000 ms, echo time (TE) = 37 ms, slice thickness = 2 mm, slices = 72, resolution = 2*2 mm and a total of 260 volumes. The preprocessing of resting-state fMRI data (including distortion correction, head-motion correction and registration) is conducted using FSL6 and MRtrix37. The orientation distribution function (ODF) public template constructed at the group level based on 1065 cases of HARDI data from HCP was provided by the University of Pittsburgh8. In addition, WM fiber tracts were delineated using 48 WM tractography maps provided by the Johns Hopkins University School of Medicine9.The algorithm of the proposed approach included two major steps (Figure 1). At the group level, an ODF template in MNI space that represents group-averaged fiber structure information is constructed from HARDI data that was acquired from 1065 subjects. Subsequently, fiber-architecture-informed windows (FAIWs) are generated for each voxel based on this ODF template10, which are stored as common dictionaries and further used in the individual analysis. Finally, at the individual level, the synchrony map of individual whole-brain fMRI data is estimated using a modified Principal Component Analysis (PCA)11 with the group-level FAIWs.
Results
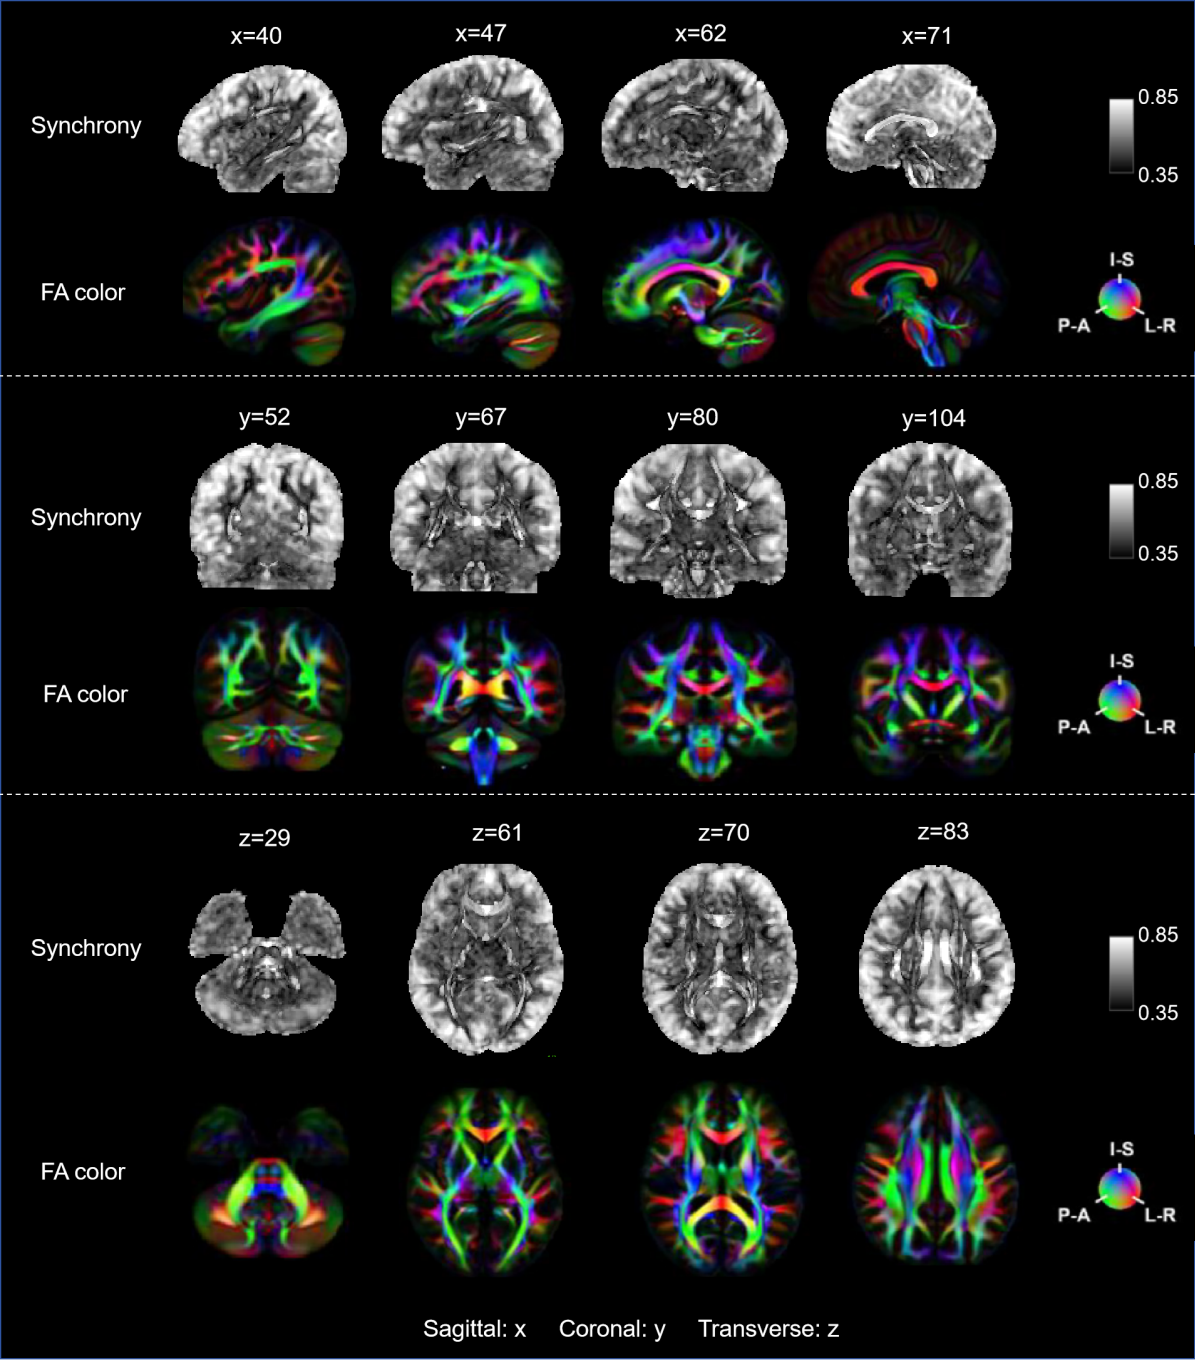
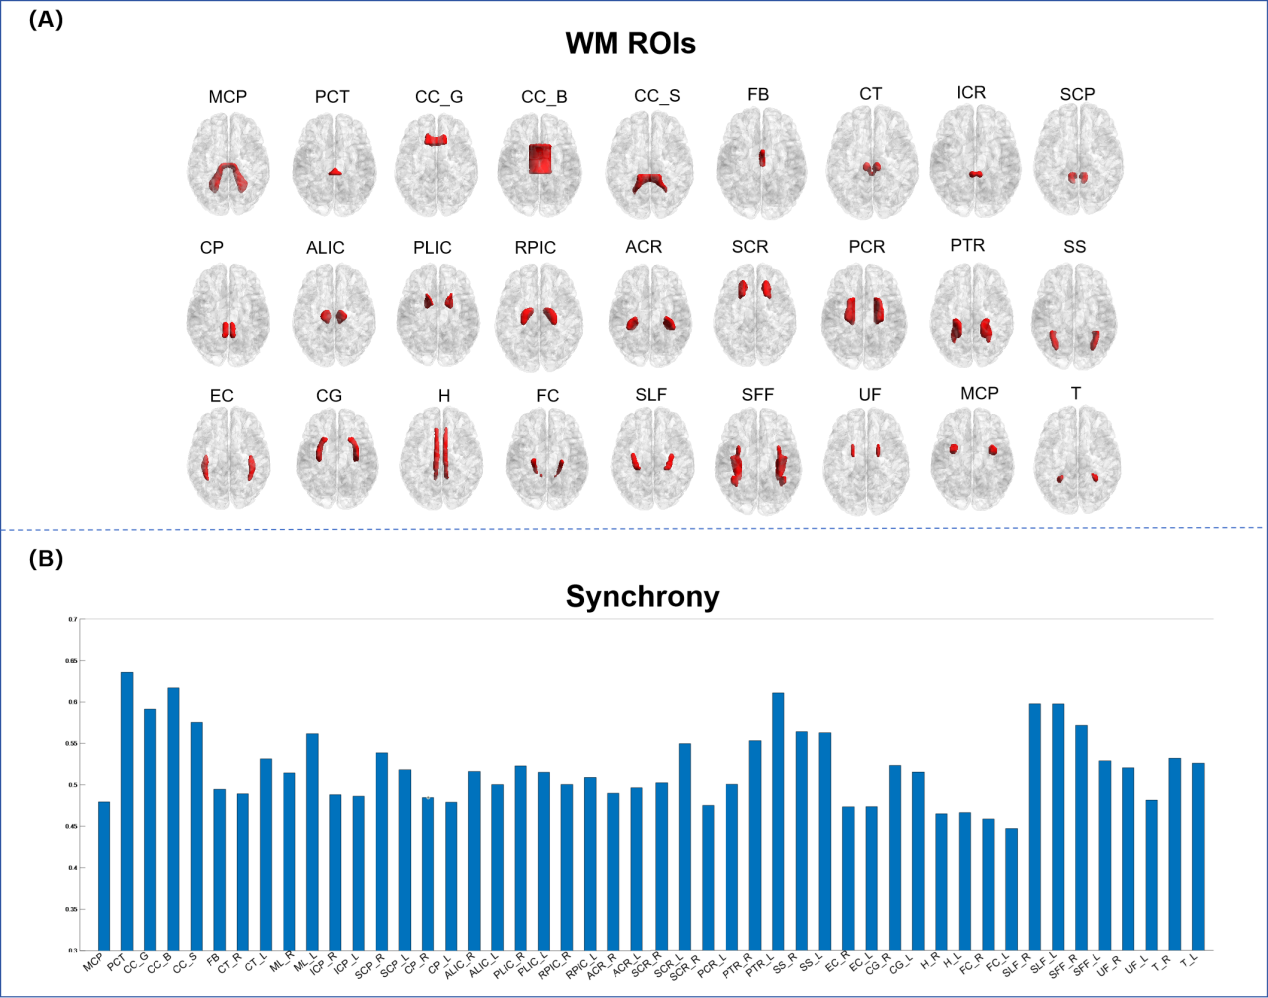
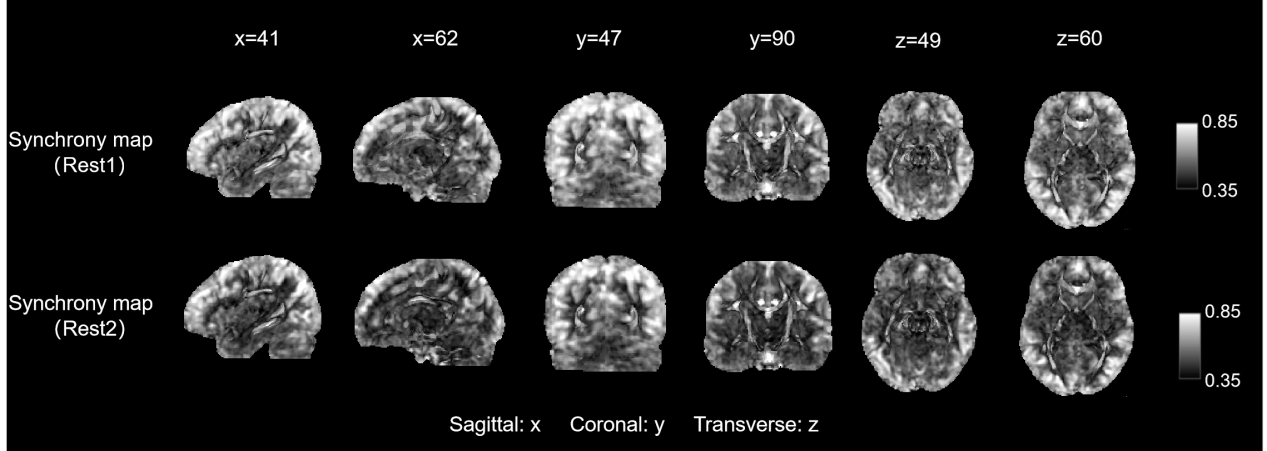
Figure 2 shows a synchrony map of an individual's resting-state fMRI using the proposed approach. The FA color map in Figure 2 is constructed from the individual's HARDI data that reflects the direction of the white matter fiber structure. It can be found that some areas with high synchrony in the brain exhibit consistency with white matter fiber architectures displayed in the FA color map. The synchrony distribution of 48 WM tractography maps provided by Johns Hopkins University has been shown in Figure 3. Figure 3(A) displays the spatial location of each white matter fiber tract in the brain, and Figure 3(B) provides the tract-averaged synchrony of 48 white matter fiber tracts, which could be used as a new biomarker for studying white matter function in future studies. As is shown in Figure 4, the synchrony maps are estimated by two resting-state fMRI scans of an individual, where a high degree of consistency between the two scans demonstrates the reproducibility and stability of the proposed approach.Discussion
Traditional GLM-based approaches are not suitable for whole-brain fMRI signal research, especially in the analysis of white matter signals. In this study, the previous fiber architecture-informed synchrony mapping is modified to detect the functional activity in the whole brain by estimating the synchrony of BOLD signals on the group-averaged fiber architectures11. This modified approach relies on a public ODF template and thus does not require an additional image acquisition of HARDI with a long scan time, which makes it possible for a practical application. Note that neural activations are mapped with the synchrony difference between resting and task-load states, which is not performed in this study due to the absence of stimulus devices. Nonetheless, the highly consistent synchrony of the two individual scans verified the reproducibility and stability of the proposed approach at an individual level, which suggests that it can be used for reliable detections of nonlinear brain activations.Conclusion
We propose a fast approach to detect the synchrony of fMRI signals within local group-averaged fiber architectures, which merely rely on a conventional fMRI image acquisition. This approach is expected to provide a reliable tool to detect brain activations with nonlinear hemodynamic response.Acknowledgements
No acknowledgement found.References
1. Monti M M. Statistical analysis of fMRI time-series: a critical review of the GLM approach[J]. Frontiers in human neuroscience, 2011, 5: 28.
2. Soch J, Haynes J D, Allefeld C. How to avoid mismodelling in GLM-based fMRI data analysis: cross-validated Bayesian model selection[J]. NeuroImage, 2016, 141: 469-489.
3. Li M, Newton A T, Anderson A W, et al. Characterization of the hemodynamic response function in white matter tracts for event-related fMRI[J]. Nature communications, 2019, 10(1): 1140.
4. Laird A R, Fox P M, Eickhoff S B, et al. Behavioral interpretations of intrinsic connectivity networks[J]. Journal of cognitive neuroscience, 2011, 23(12): 4022-4037.
5. Iturria-Medina Y, Canales-Rodríguez E J, Melie-García L, et al. Characterizing brain anatomical connections using diffusion weighted MRI and graph theory[J]. Neuroimage, 2007, 36(3): 645-660.
6. Jenkinson M, Beckmann C F, Behrens T E J, et al. Fsl[J]. Neuroimage, 2012, 62(2): 782-790.
7. Tournier J D, Smith R, Raffelt D, et al. MRtrix3: A fast, flexible and open software framework for medical image processing and visualisation[J]. Neuroimage, 2019, 202: 116137.
8. Yeh F C. Population-based tract-to-region connectome of the human brain and its hierarchical topology[J]. Nature communications, 2022, 13(1): 4933.
9. Mori S, Oishi K, Jiang H, et al. Stereotaxic white matter atlas based on diffusion tensor imaging in an ICBM template[J]. Neuroimage, 2008, 40(2): 570-582.
10. Abramian D, Larsson M, Eklund A, et al. Diffusion-informed spatial smoothing of fMRI data in white matter using spectral graph filters[J]. Neuroimage, 2021, 237: 118095.
11. Zhao Y, Gao Y, Zu Z, et al. Detection of functional activity in brain white matter using fiber architecture informed synchrony mapping[J]. Neuroimage, 2022, 258: 119399.
Figures