0534
Bebop-EPI (BEeping BOld Pulse sequence) – employing inherent acquisition acoustics to generate auditory stimuli for auditory fMRI1Department of Brain Sciences, Weizmann Institute of Science, Rehovot, Israel, 2Life Sciences Core Facilities, Weizmann Institute of Science, Rehovot, Israel
Synopsis
Keywords: fMRI Acquisition, fMRI (task based), Auditory stimuli
Motivation: With improved scanning methods and SNR, auditory response studies in functional MRI require well-defined stimuli but are encumbered by the acoustic noise from the acquisition gradients and by the temporal inaccuracy of the external audio source.
Goal(s): Our goal was to use the acoustic noise generated by the MRI gradients to circumvent an external source for auditory fMRI.
Approach: We implemented BEBOP (BEeping BOld Pulse sequence) EPI which enables varying the echo spacing, and thus pitch, per slice and per repetition and so provides a platform for auditory fMRI.
Results: An fMRI feasibility study at 7T was successfully implemented, measuring auditory-motor responses.
Impact: We demonstrated a new approach that simultaneously generates auditory stimuli and measures their BOLD response. The new approach offers high temporal accuracy of the auditory tasks due to the MRI gradients’ high temporal precision.
Introduction
One of the first auditory fMRI experiments performed1 used as stimuli the acoustics generated by gradients played (or not) before the excitation. This resulted in a simple experiment with high temporal accuracy. Later studies turned to external stimuli, enabling great versatility of the audio stimuli. However, the latter is confounded by acoustic noise from the scan itself2,3 and by the limited synchronization accuracy of the external audio source. With improved scanning methods and SNR, especially at ultra-high field, auditory fMRI studies require a well-defined stimuli. Suggested solutions include attenuation of the acoustic noise4 and sparse fMRI with embedded breaks for the stimuli2,3. We implemented a new approach employing the inherent acquisition acoustics to overcome the above disadvantages. Our BEBOP (BEeping BOld Pulse sequence) EPI utilizes controllable varying echo spacings (ESPs) that change the audio pitch per acquisition (changing with slice and repetition) and so provides a platform for planning auditory tasks. A feasibility study with a block-design auditory response was performed at 7T, using blocks of fixed and randomized ESPs as reference and “task” blocks, respectively.Methods
Pulse sequence with varying auditory pitch. Controllable varying ESPs were implemented by enabling delays around the EPI readout gradients (while maintaining the readout bandwidth).Stimuli and task block-design. Two blocks were defined - a ‘fixation’ block with a fixed pitch/ESP and a ‘task’ block with a preset randomization of pitches/ESPs. A ‘fixation’/‘task’ block-design of either 8/6 or 16/16 seconds was executed for ~6 minutes with a rate of 12 slices/2 sec. During some experiments, the volunteers were asked to tap with their 4 fingers but only when hearing the randomized-pitch.
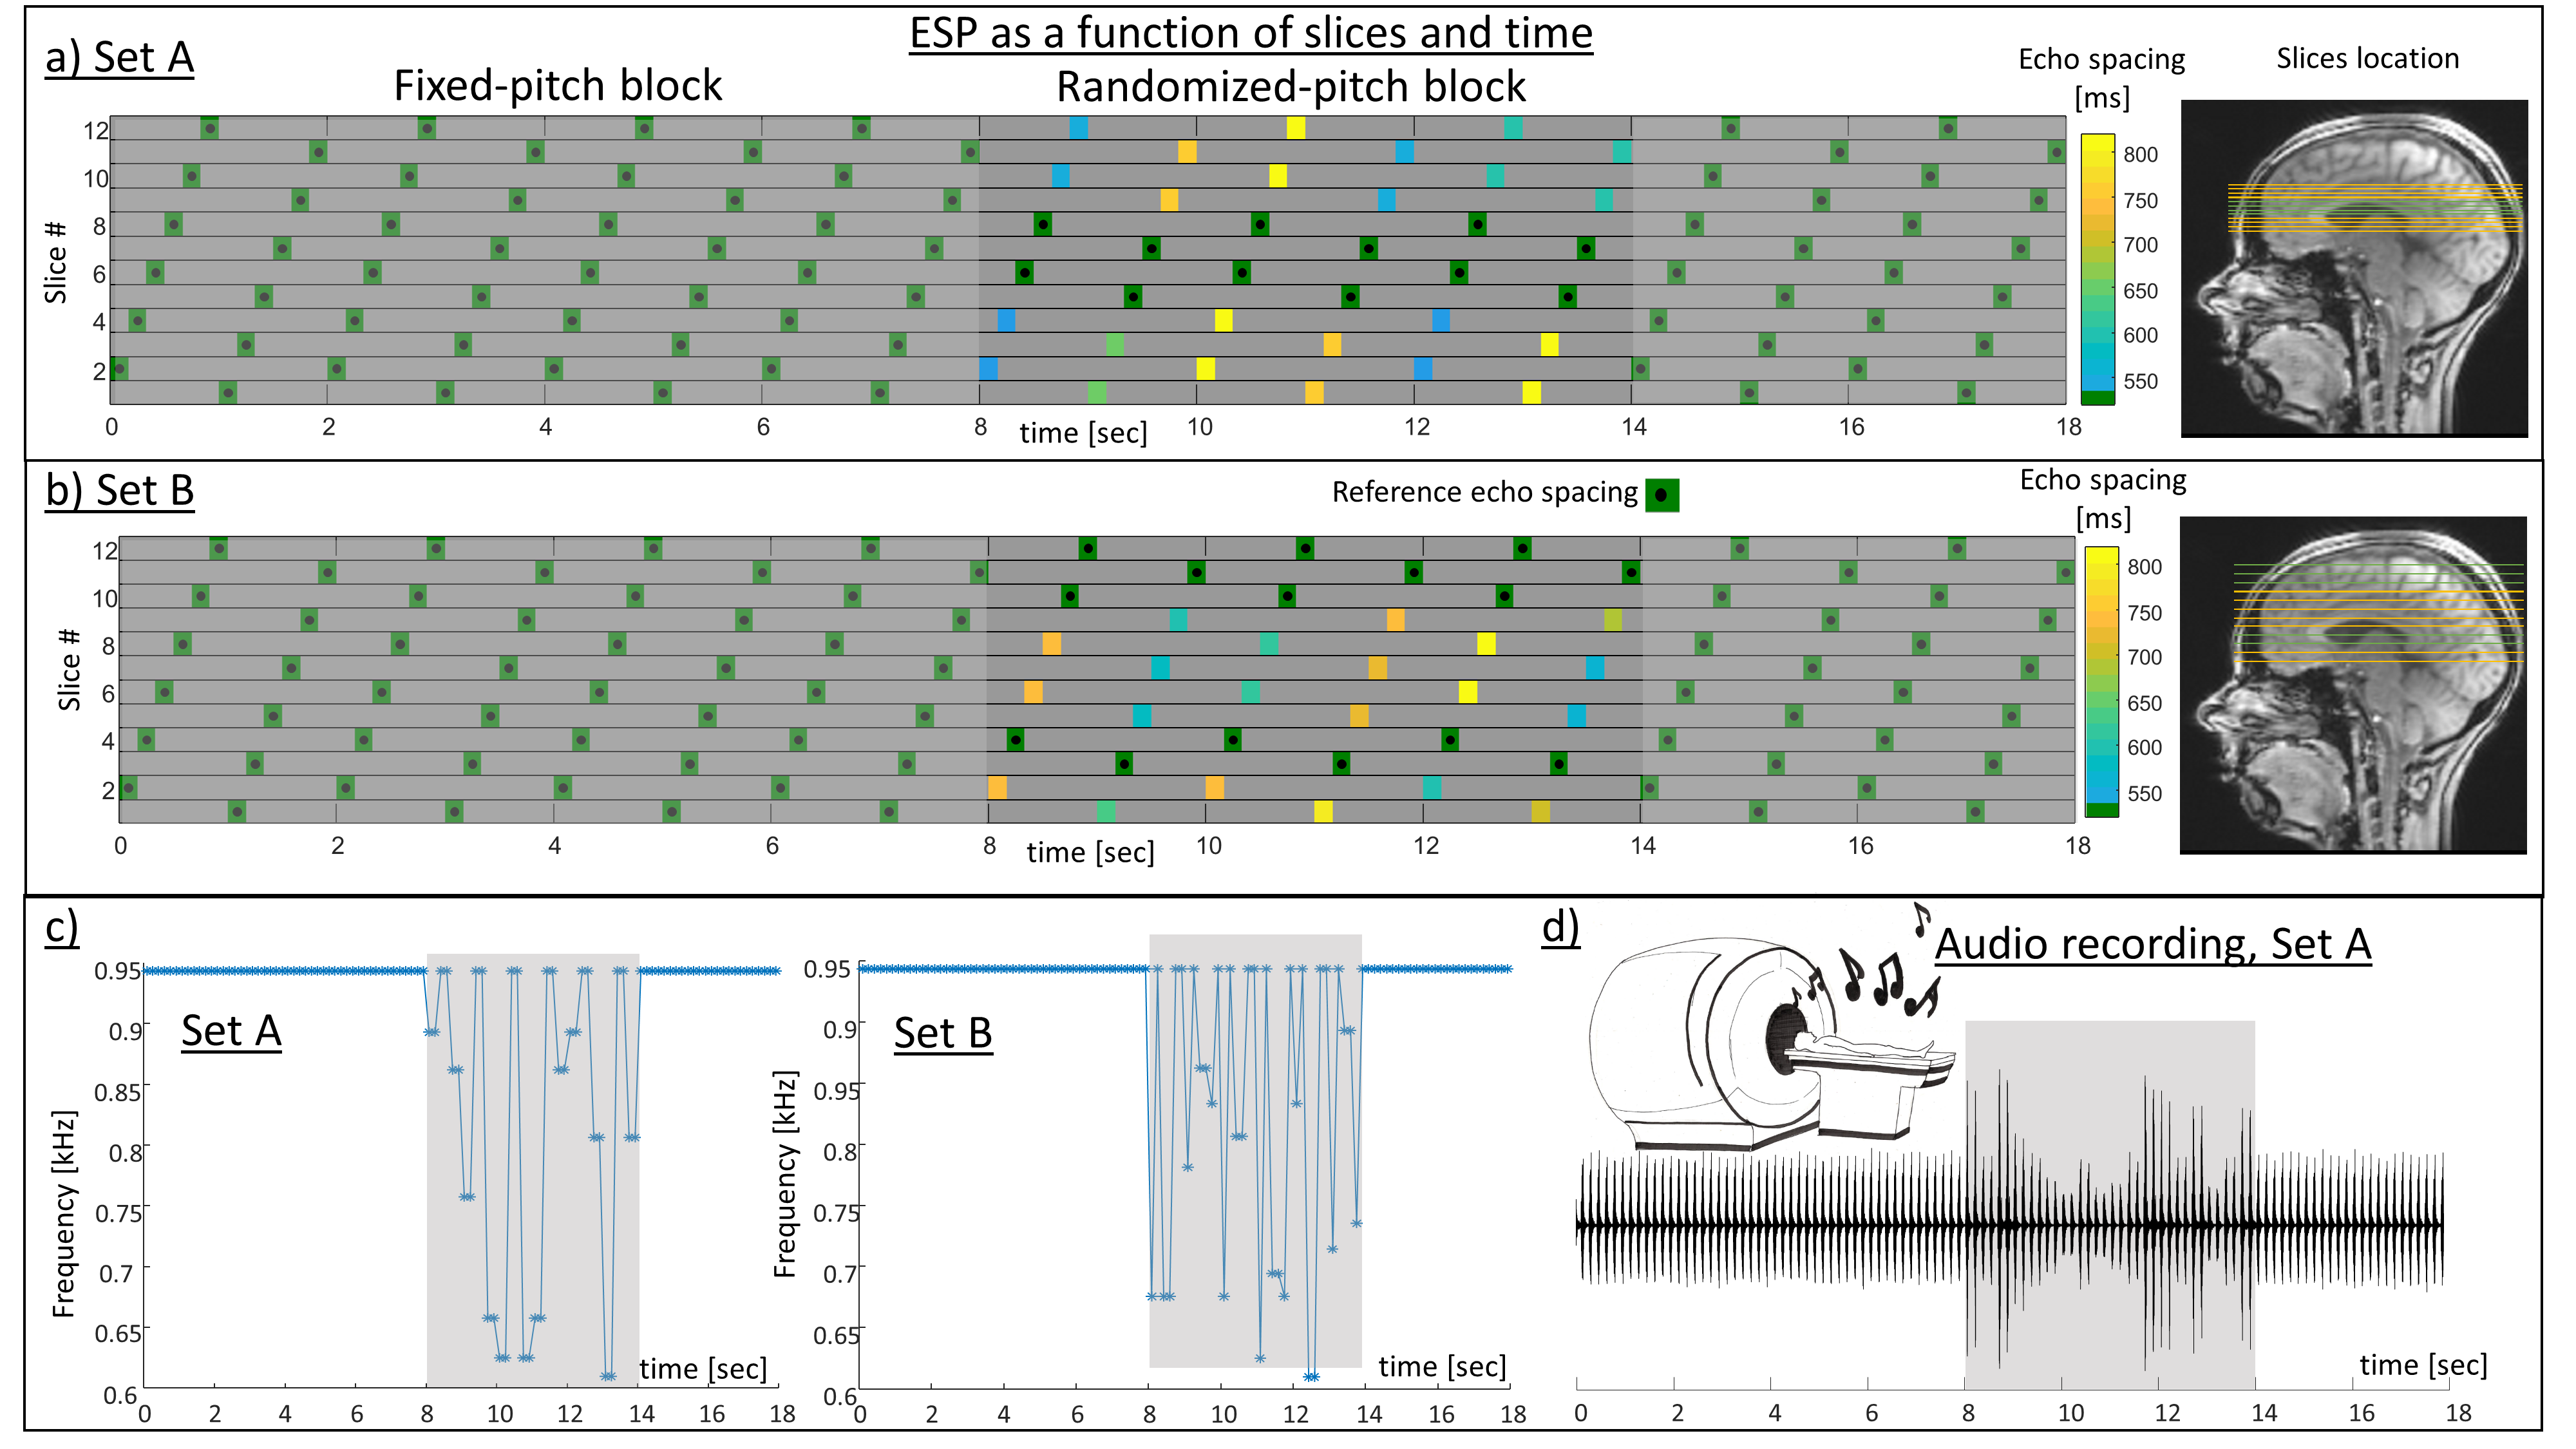
Varying ESPs and signal variation. Preliminary testing on a phantom showed signal variation when varying ESPs. Three possible factors are i) changes in image distortions, ii) differing ghost artifacts, and iii) eddy currents effects. Ghost artifact were found to be minimal when the navigators’ ESPs changed with the acquisitions’. To circumvent undesired signal changes in an actual fMRI experiment, a subset of slices of interest were forced to maintain the ‘fixed-pitch’ ESP even in the ‘randomized-pitch’ block (see Fig.1). The slices of interest were chosen as slices through the auditory cortex and optionally through the motor cortex.
Scan parameters. Scans of healthy volunteers were acquired with a 7T Terra scanner (Siemens). TR=2 sec, TE=22 ms, BW/Pixel=2480 Hz/pixel, x3 acceleration, in-plane resolution 2.1x2.1 mm2, 12 slices with 2.2 mm slice thickness, fixed ESP=0.53 ms, random ESP values range 0.53-0.8 ms. Two sets of scans were performed: Set A, a scan centered around the primary auditory cortex having 4 central slices (5 to 8) with fixed ESP (no gap between slices), and Set B, a scan covering both the primary auditory and the motor cortices (150% gap between slices, slices 3,4,10,11,12 with fixed ESP).
Results
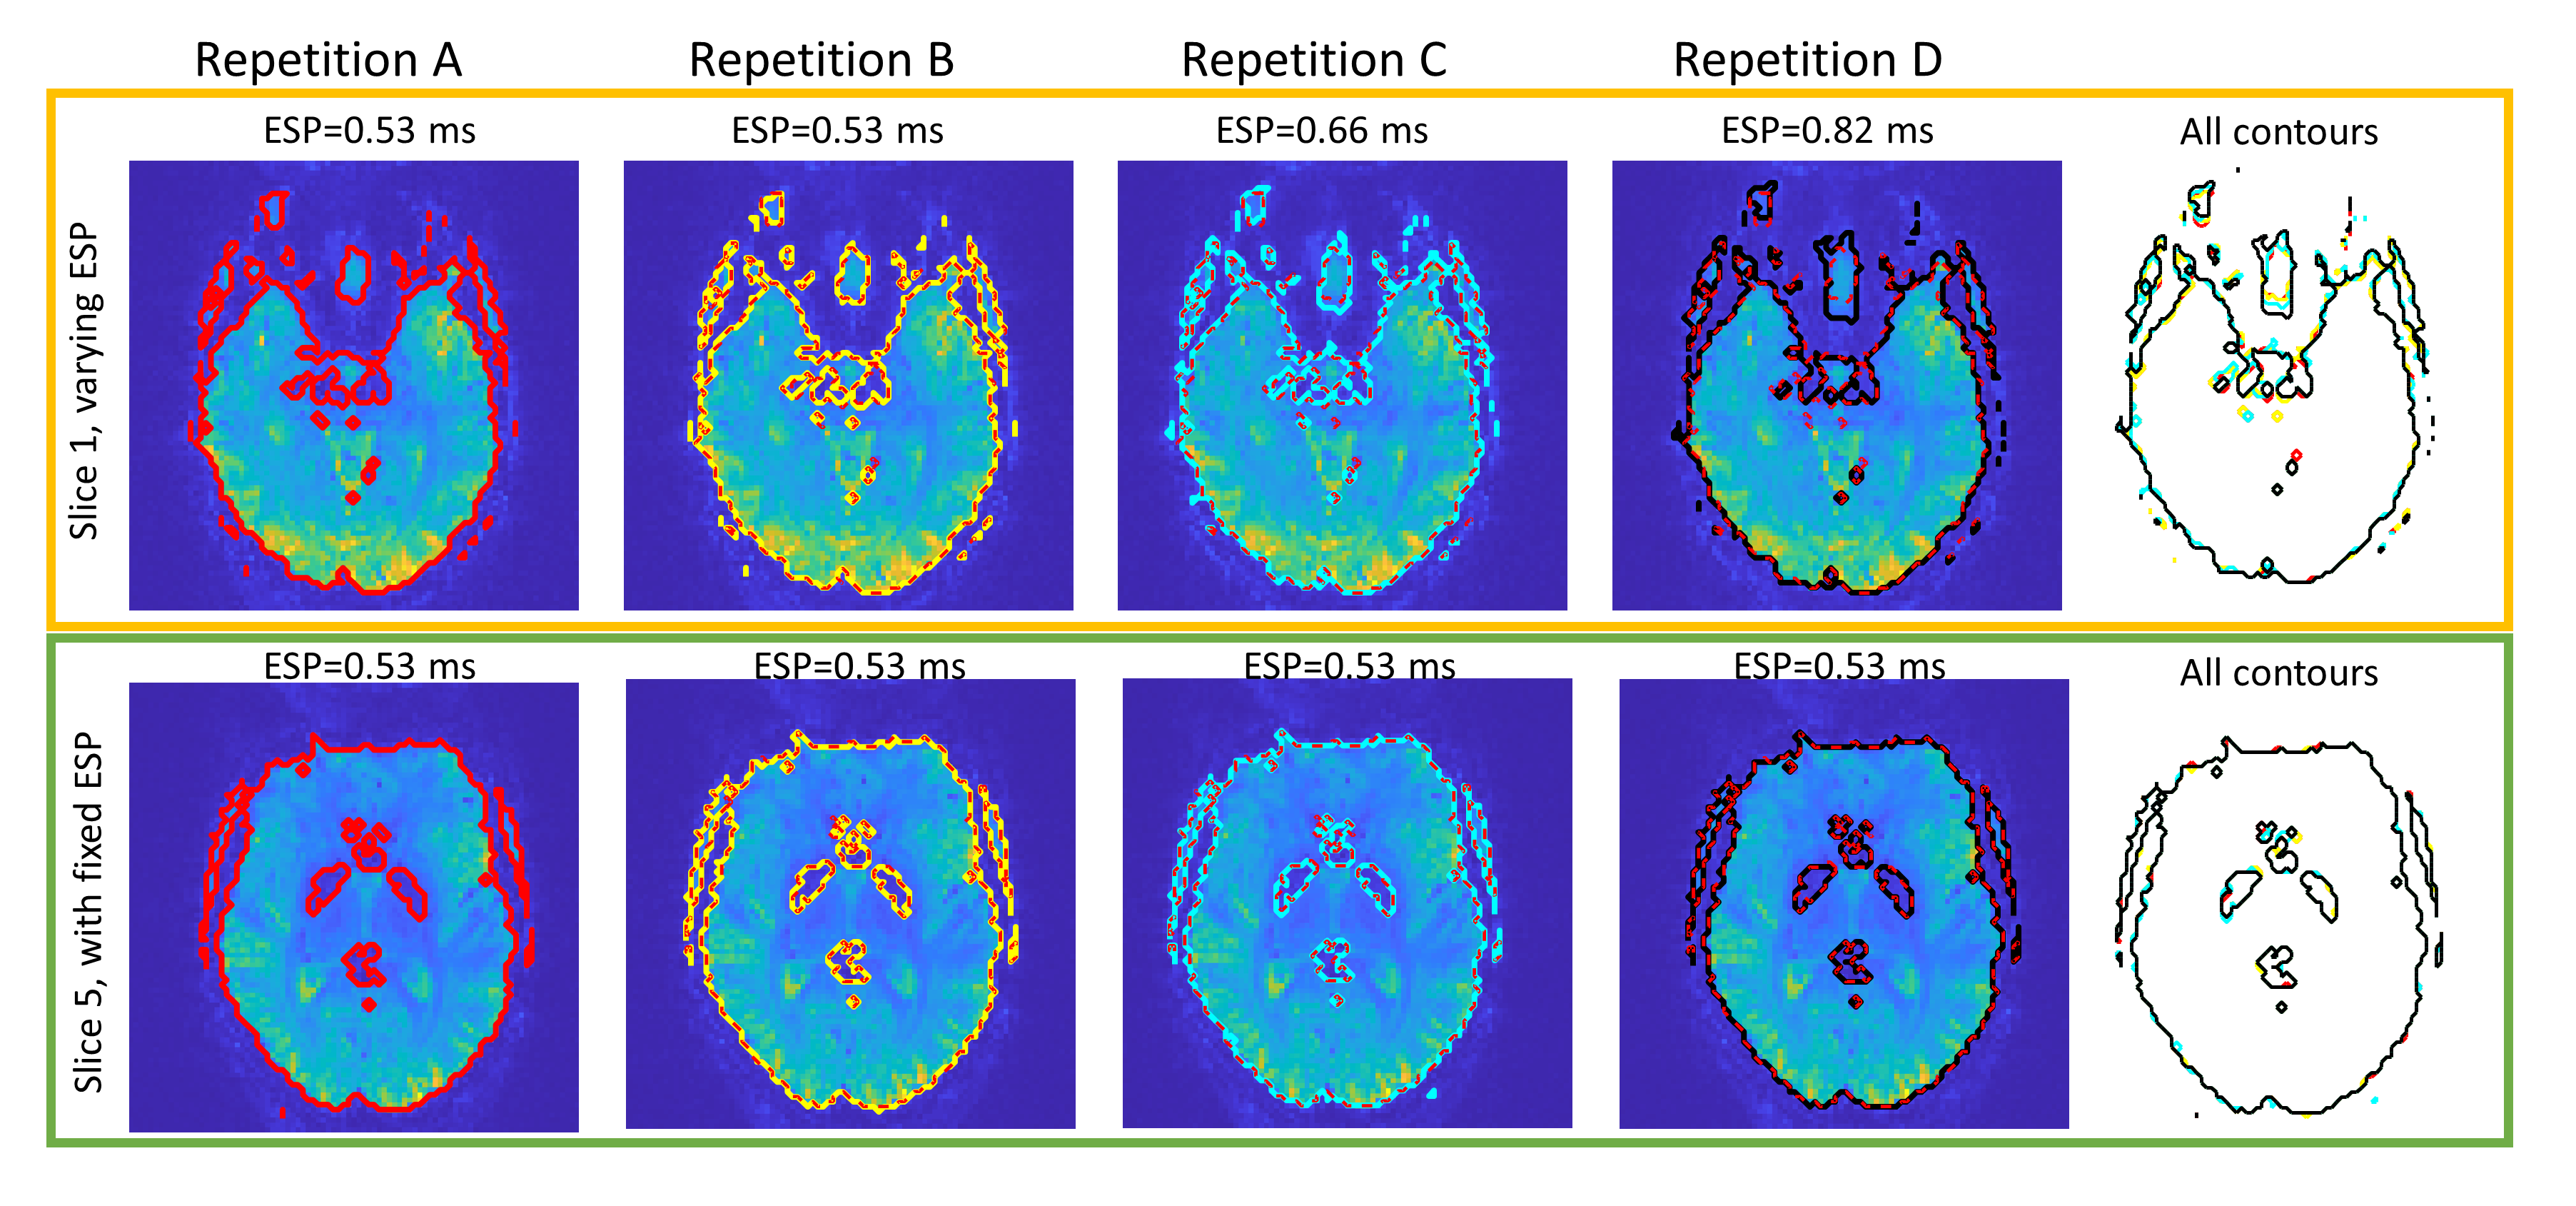
Fig.1a-b show the time varying ESPs, per slice, for Set A and for Set B. Fig.1c shows the main expected sound frequency due to the ESPs (freq=1/2ESP) as function of time. Fig.1d shows the recorded audio amplitude during 18 seconds of a Set A scan.Fig.2 shows image distortions for different ESPs. Only minor distortions were observed.
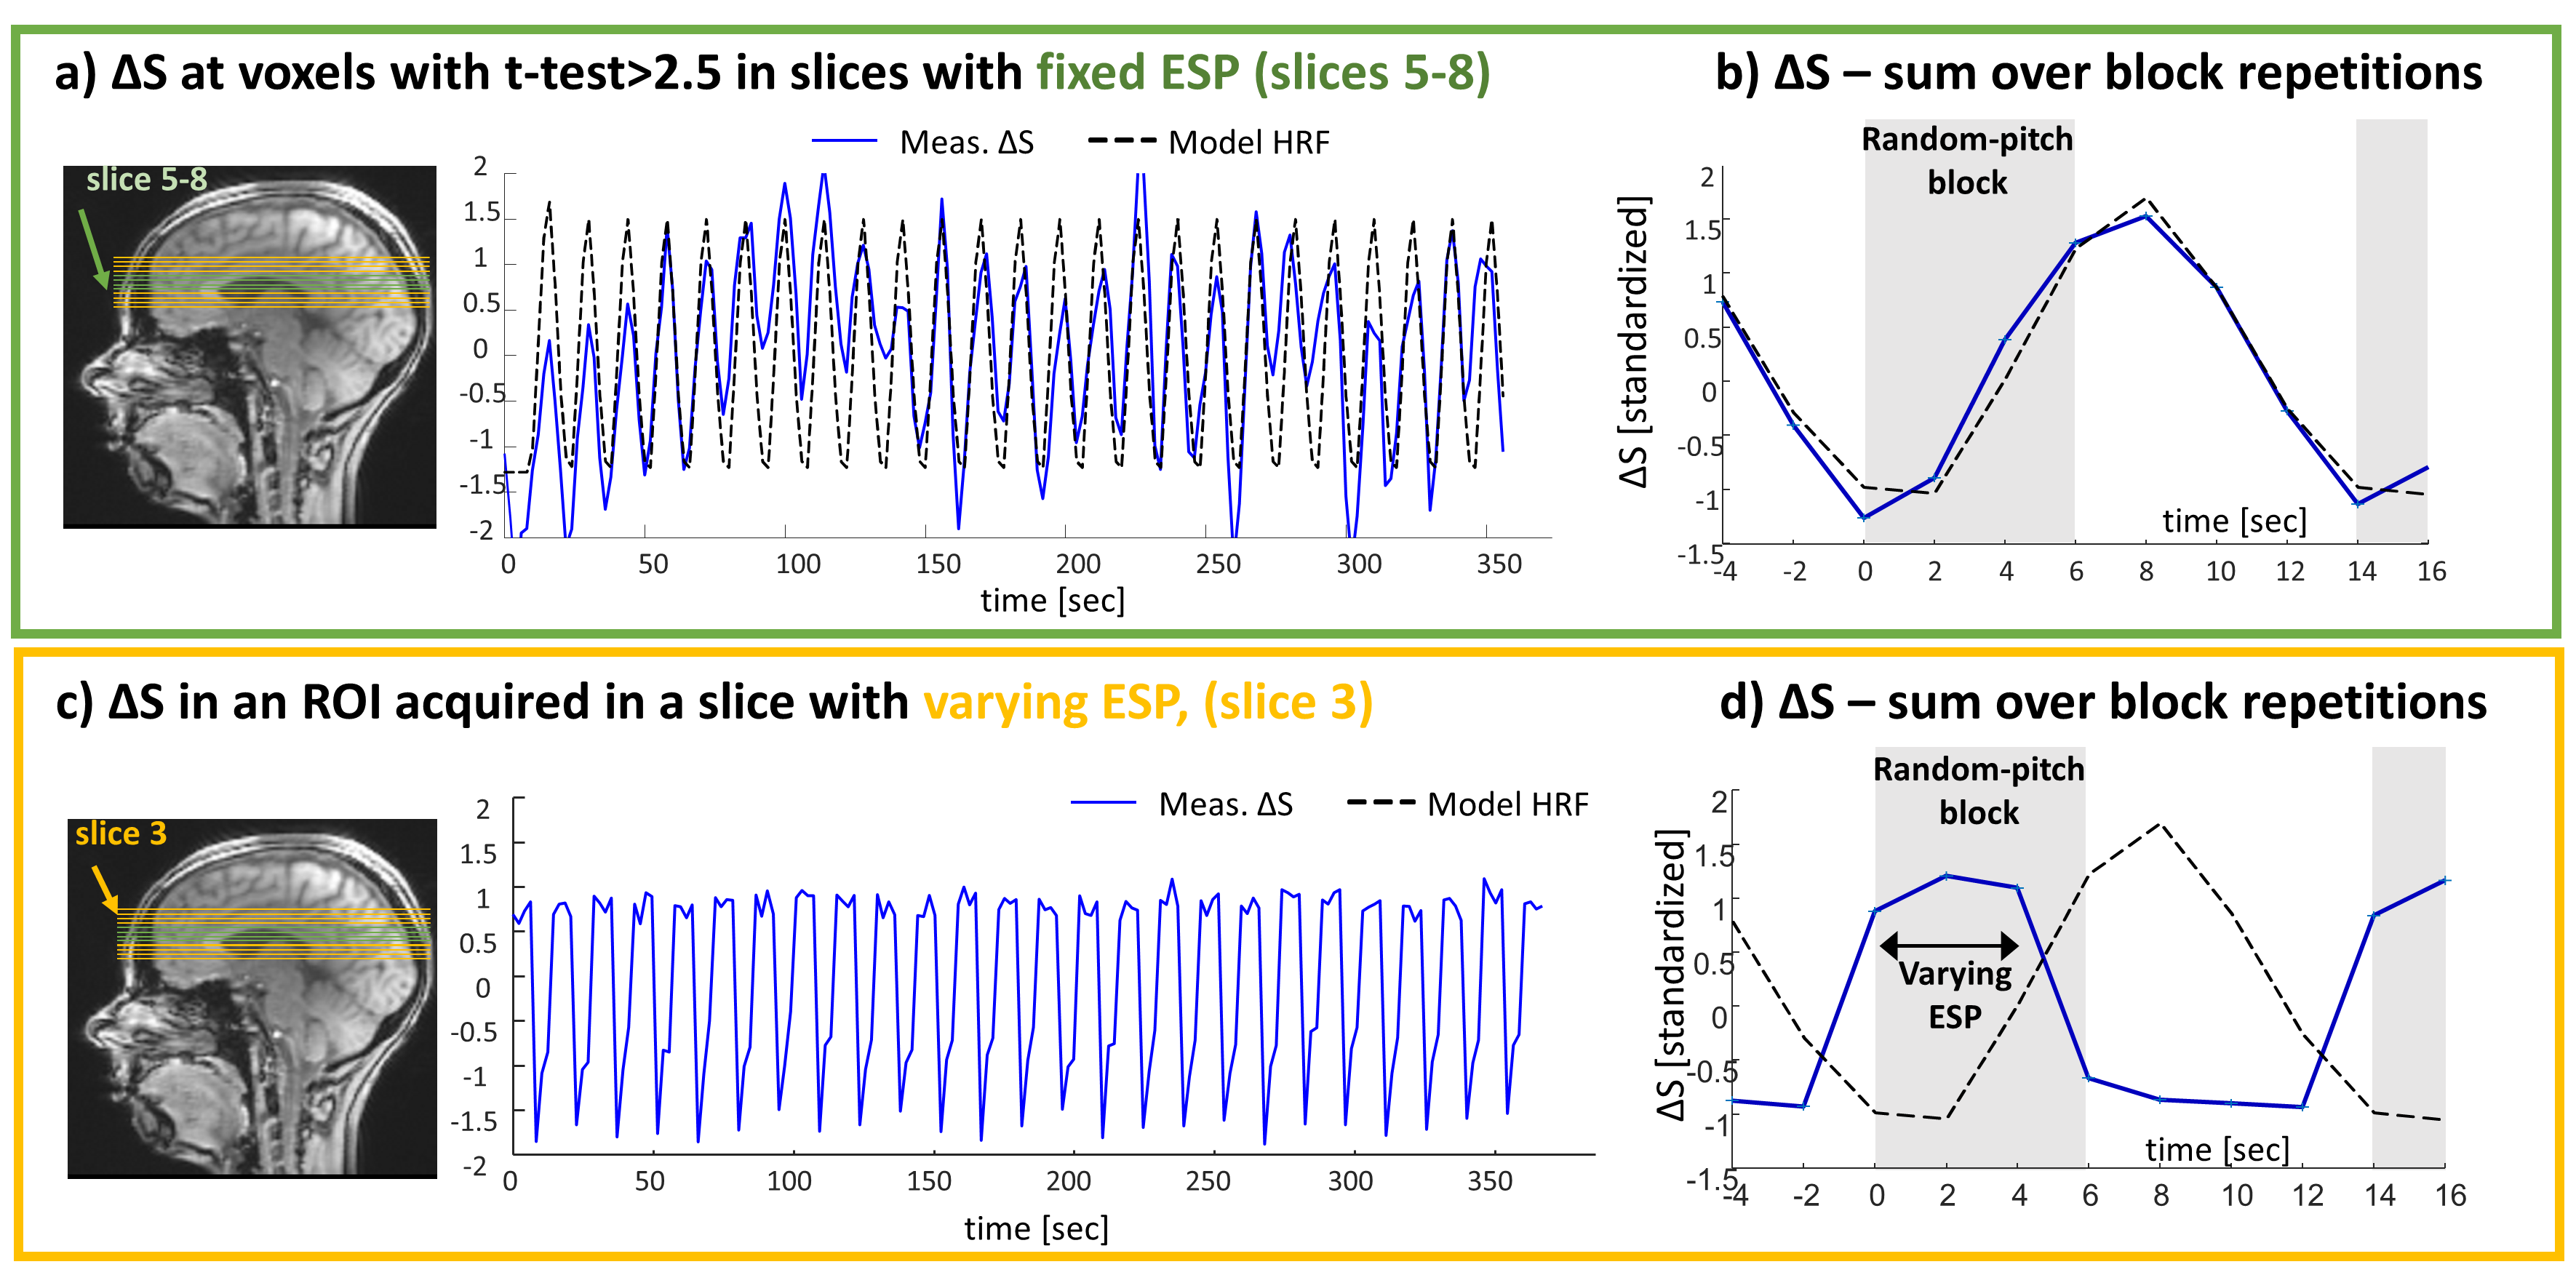
Fig.3 shows the standardized signal changes (ΔS) during a BEBOP scan. Fig.3a and 3b show ΔS in slices with fixed ESPs for voxels with t-test>2.5, while Fig.3c and 3d show ΔS of a set of voxels in a slice with varying ESPs. The plots show ΔS along the 6 min scan and summed over block repetitions. The signals are compared to a simulated hemodynamic response (HRF) of a matching “OFF/ON” block design. ΔS and the simulated HRF in Fig.3b are highly correlated (r=0.7) while in Fig.3d the signal is in correlation to the variation of the ESPs and not in correlation to the simulated HRF response.
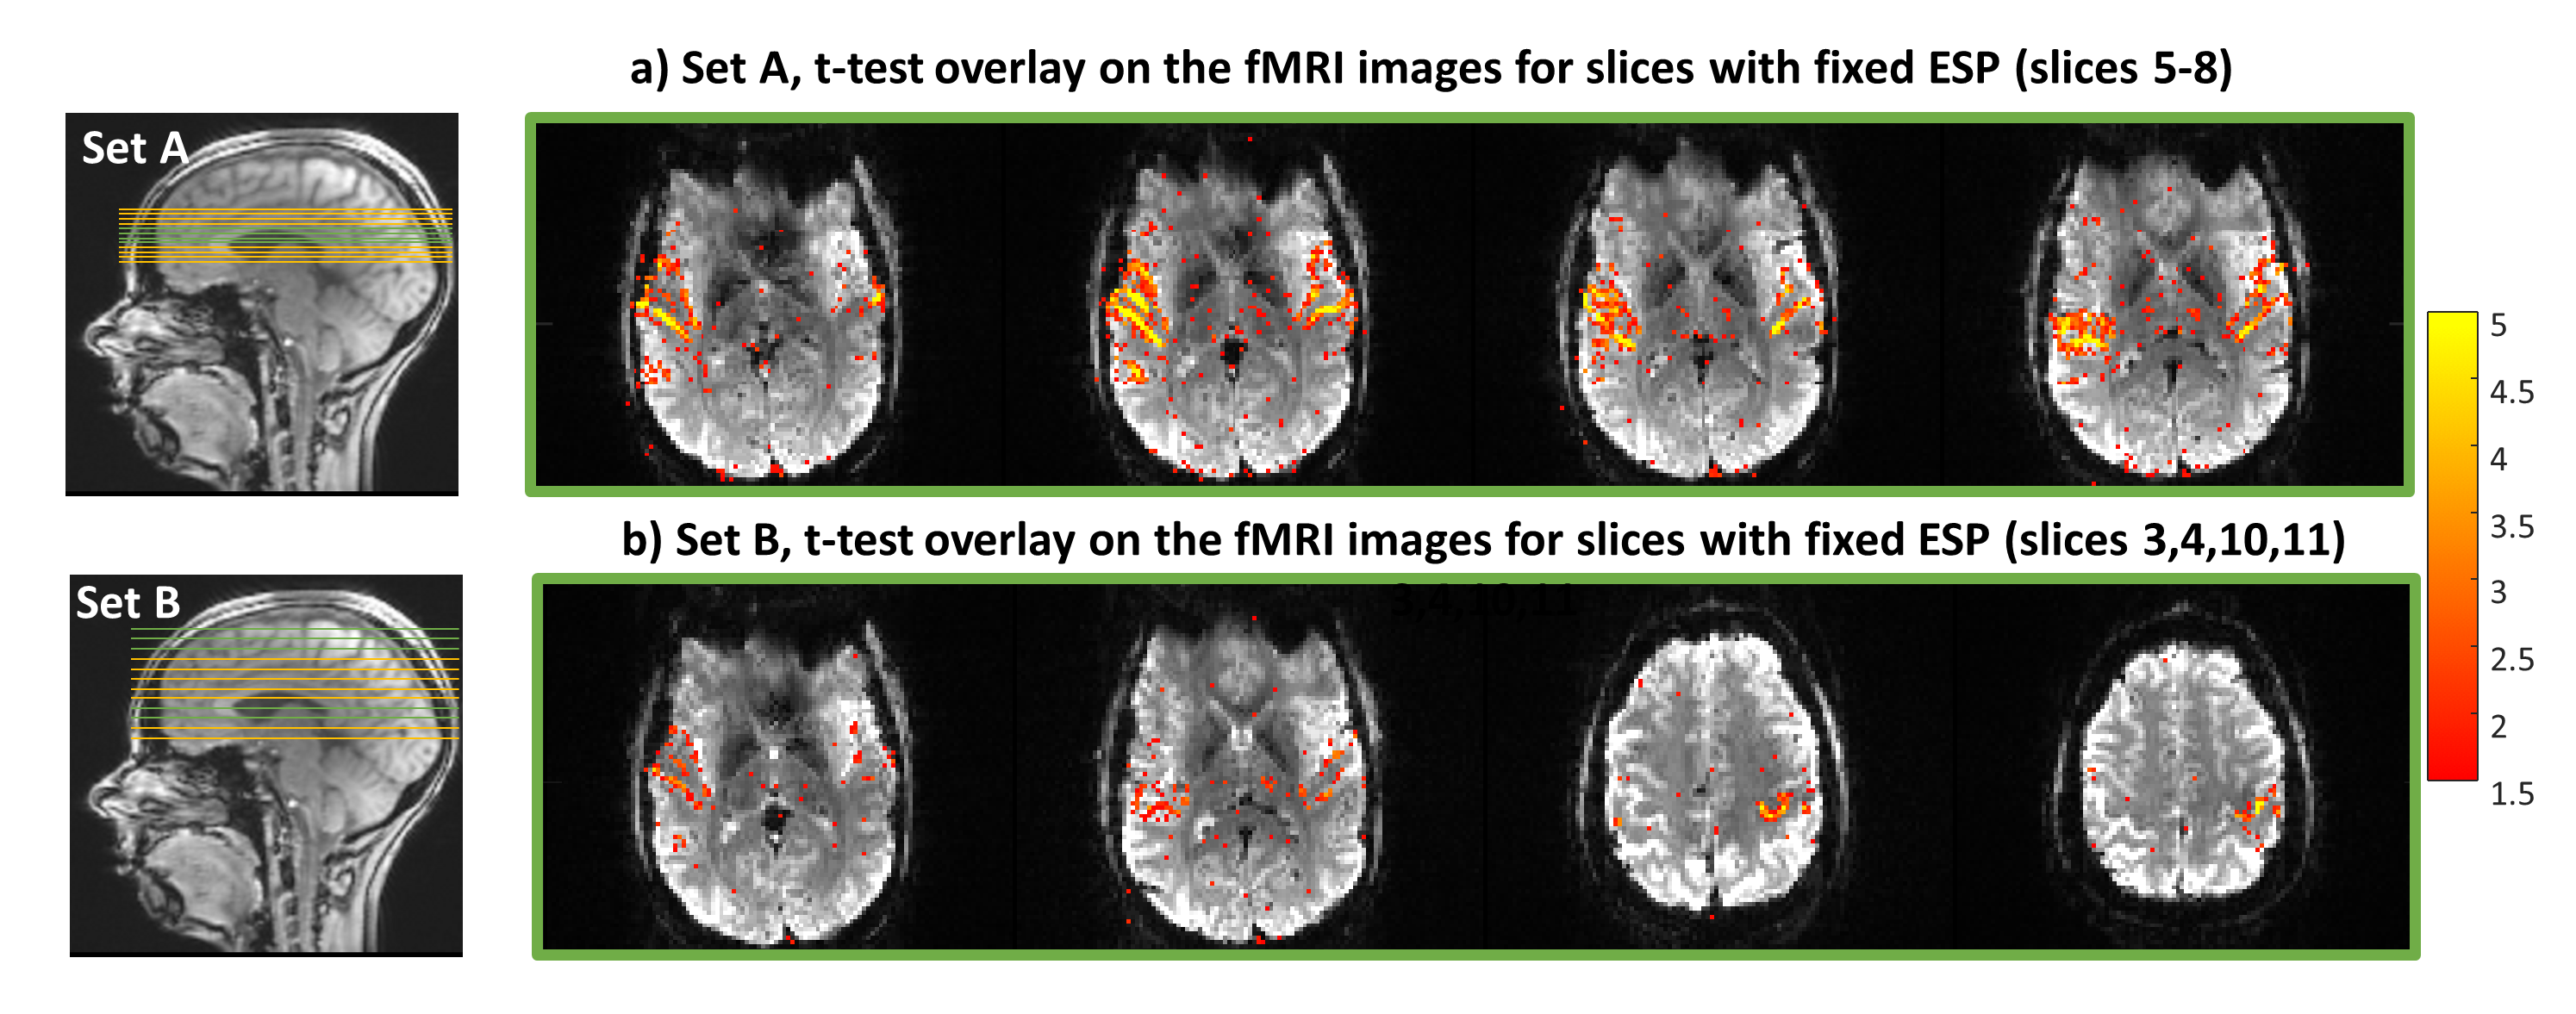
Fig.4 shows the t-test overlaid on EPI images for the slices of interest. Set A exhibits high scores at the primary auditory cortex. Set B shows high t-test scores for both auditory and motor regions.
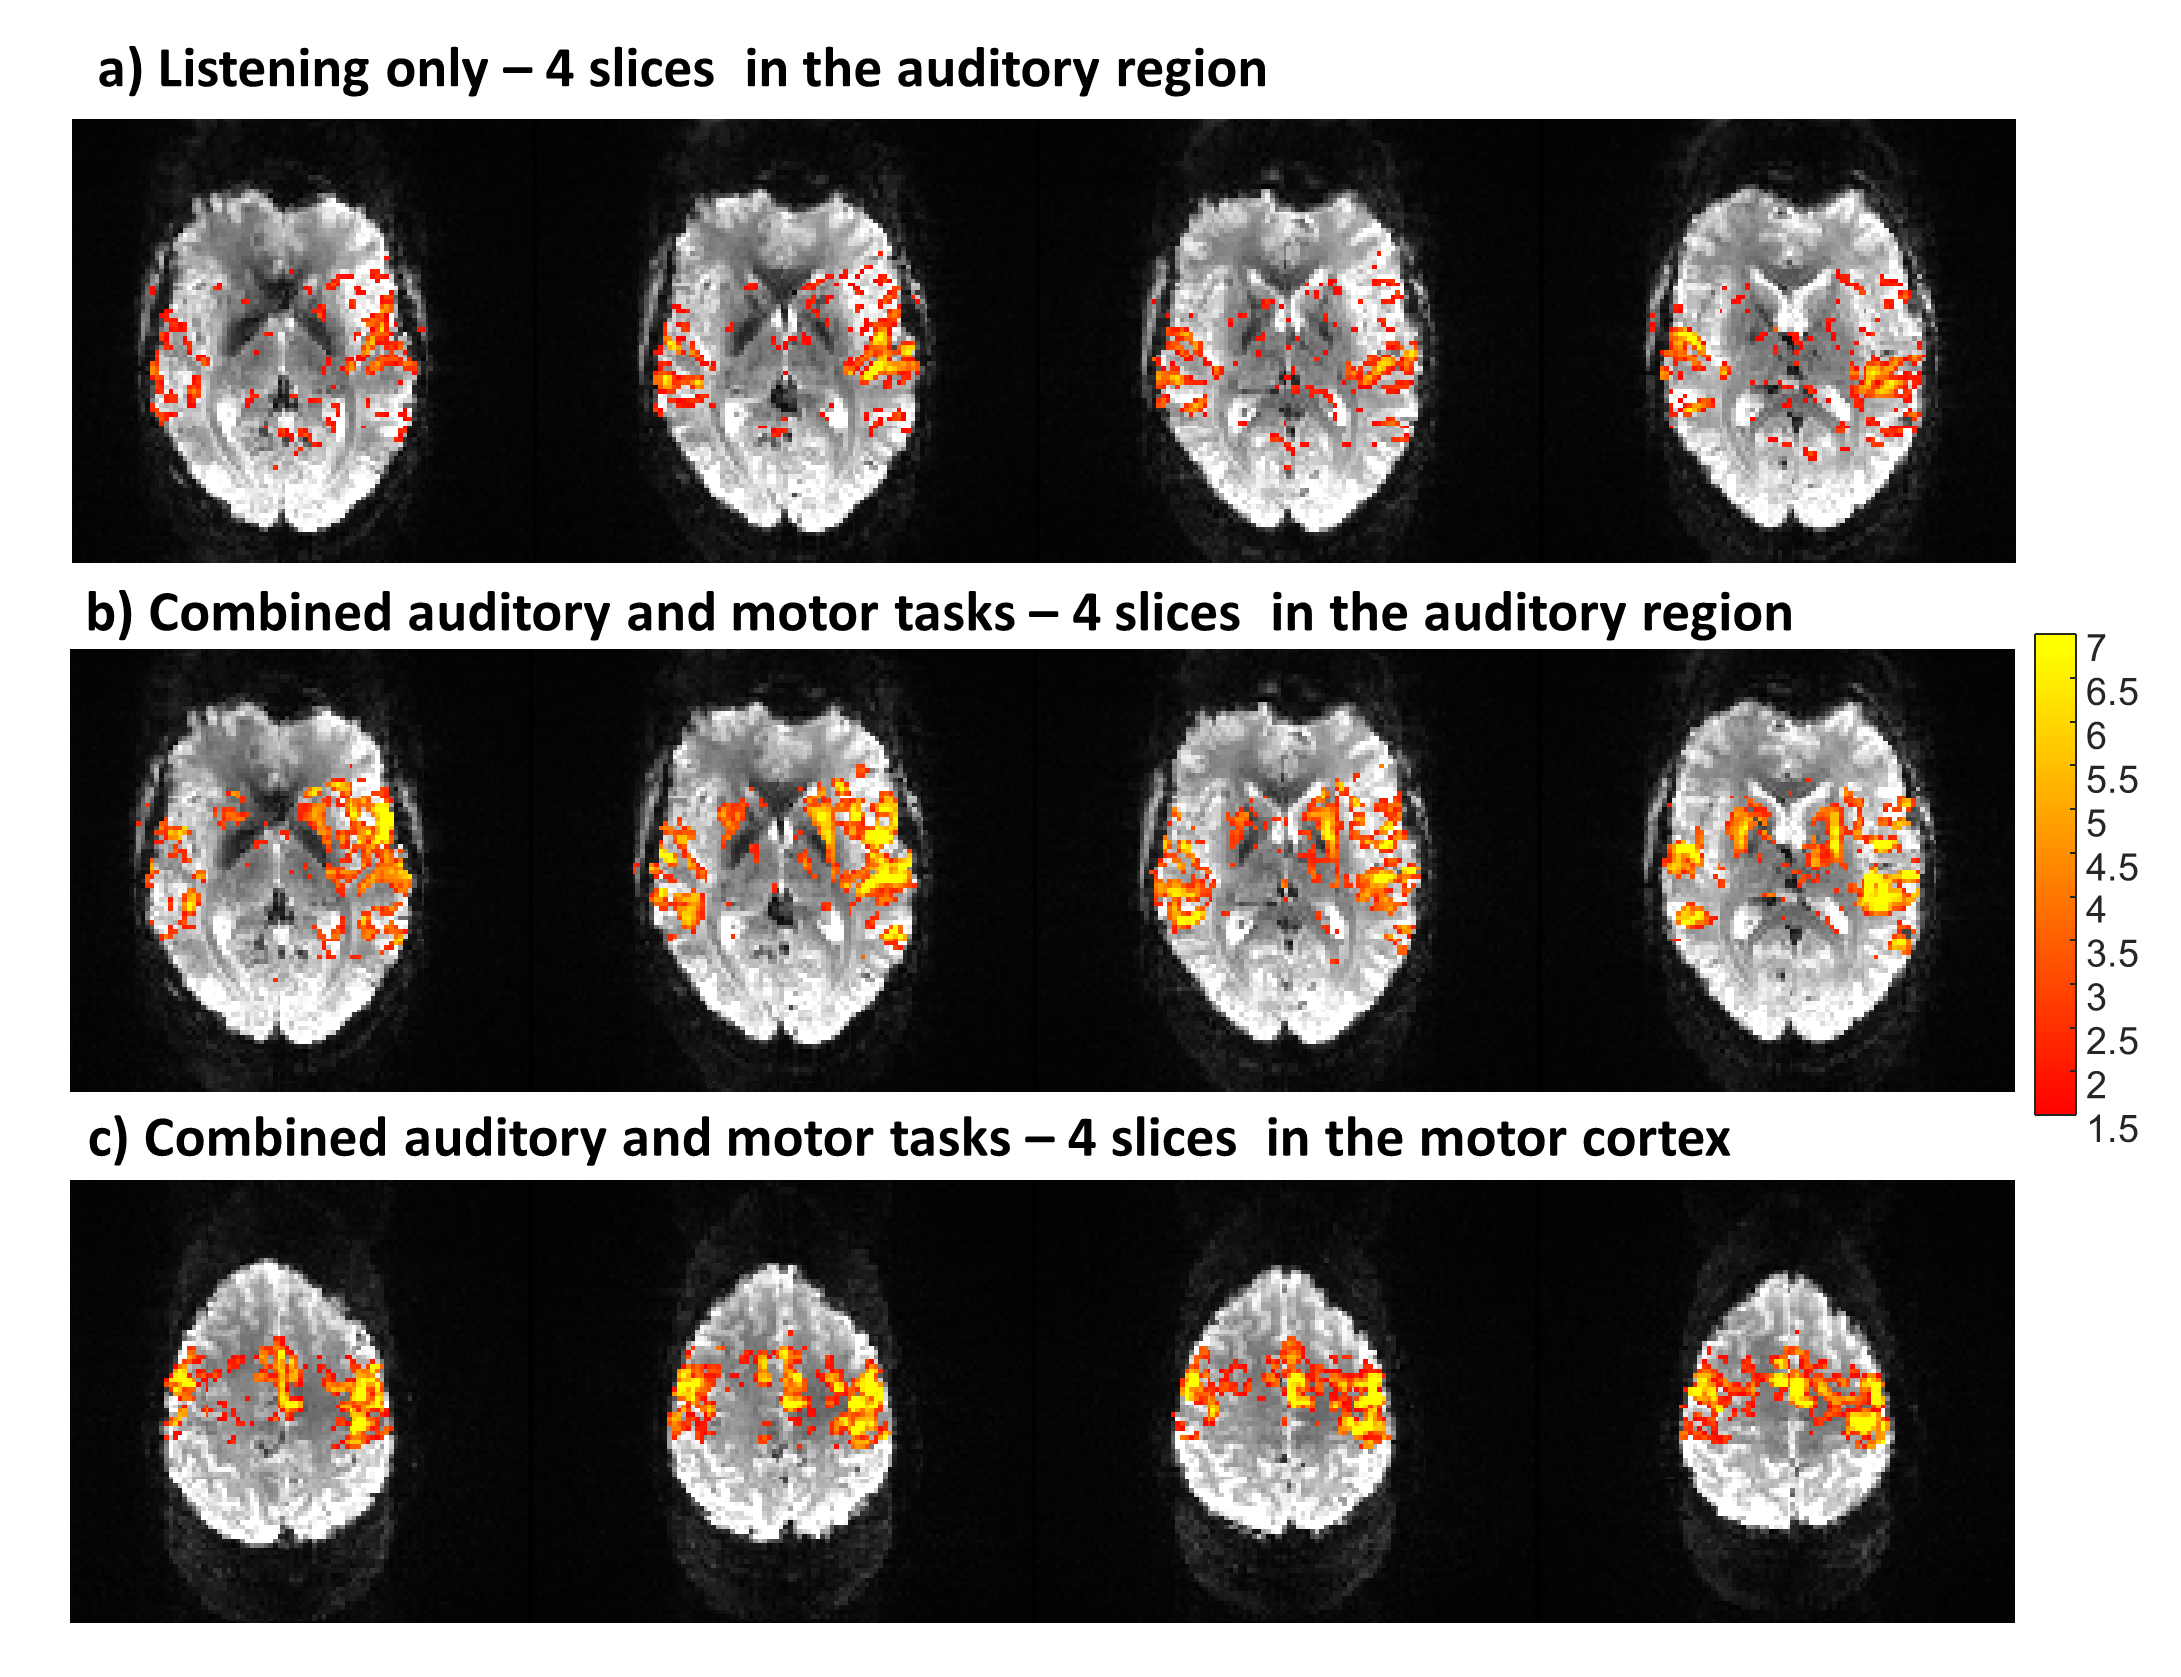
Fig.5 compares t-test maps for listening-only and for combined auditory and motor tasks. High activation is shown in the basal ganglia in Fig.5b and in the motor and supplementary motor areas in Fig.5c.
Conclusions
We demonstrated a new approach that simultaneously generates auditory stimuli and measures their BOLD response. The new approach offers high temporal accuracy of the auditory tasks due to the MRI gradients’ high temporal precision. A block design feasibility study was successfully implemented, measuring auditory-motor responses.Acknowledgements
Special thanks to Santosh Kumar Maurya for artistic visualization of the BEBOP scan.References
1. Bandettini, P. A., Jesmanowicz, A., Van Kylen, J., Birn, R. M., & Hyde, J. S. (1998). Functional MRI of brain activation induced by scanner acoustic noise. Magnetic resonance in medicine, 39(3), 410-416.
2. Peelle, J. E. (2014). Methodological challenges and solutions in auditory functional magnetic resonance imaging. Frontiers in neuroscience, 8, 253.
3. Gonzalez-Castillo, J., Olulade, O. A., & Talavage, T. M. (2012). Using functional MRI to study auditory comprehension. Imaging in Medicine, 4(1), 137.
4. Seifritz, E., Di Salle, F., Esposito, F., Herdener, M., Neuhoff, J. G., & Scheffler, K. (2006). Enhancing BOLD response in the auditory system by neurophysiologically tuned fMRI sequence. Neuroimage, 29(3), 1013-1022.
Figures