0533
Whisker pad stimulation elicits brain-wide cross-sensory activation in awake rats measured with zero echo time fMRI1A.I.V Institute for Molecular Sciences, University of Eastern Finland, Kuopio, Finland, 2Center for Magnetic Resonance Research, University of Minnesota, Minneapolis, MN, United States
Synopsis
Keywords: Task/Intervention Based fMRI, fMRI (task based), awake, rat, multisensory
Motivation: Sensory research has typically focused on one system at a time, and basic mechanisms related to interactions between sensory systems remain poorly understood.
Goal(s): To detect and characterize brain-wide cross-sensory interplay, and to study how non-core circuits react to varying input into the core circuit.
Approach: Classical whisker pad stimulation in head-fixed awake and anesthetized rats in combination with a large number of fMRI measurements.
Results: We detected cross-sensory brain-wide activations to whisker pad stimulation. The activation profile of many non-core regions differed from that of the core circuit. Importantly, some features of cross-sensory interplay were not visible under anesthesia.
Impact: Cross-sensory activations are gaining increasing attention in imaging studies. Previously, multisensory interplay may have gone unnoticed, as the focus has been in the primary pathway. Our results also emphasize the importance of avoiding anesthesia in preclinical cross-sensory research.
Introduction
The core pathways of sensory circuits, such as the barrel circuit in rats1, are well characterized with electrophysiological, histological, and neuroimaging techniques. While most of the sensory research has focused on one sensory system, there is strong evidence that sensory circuits form an integrated system at multiple levels of the ascending pathways2-4. Currently, many aspects of the cross-sensory interplay remain poorly understood, such as how the secondary (non-core) circuits respond to varying input into the primary (core) circuit. Such experiments are challenging with electrophysiological recordings due to the limited spatial coverage, but ideal for modern neuroimaging techniques. Therefore, to understand better cross-sensory interplay, we implemented a zero-echo time Multi-Band SWeep Imaging with Fourier Transformation (MB-SWIFT) functional magnetic resonance (fMRI) approach5-7 to study the cross-sensory activations of whisker pad stimulation in rats. We have demonstrated that the novel fMRI method is quiet, resistant to movement artefacts and image distortions, and provides high-quality images from whole-brain, including brain stem and cerebellum7. Here, the experiments were conducted in both anesthetized and awake animals, to further evaluate the role of anesthesia in the activation of core and/or non-core circuits.Methods
All animal procedures were approved by the National Animal Experiment Board. Sprague-Dawley rats (7 males and 6 females) underwent a surgery for an implant for head-fixation7. After a 1-3-week recovery period, the rats were habituated to awake imaging8. fMRI followed our previous protocol7. Briefly, MB-SWIFT fMRI data were acquired with a 9.4 T scanner with a 22-mm transmit-receive surface coil with the following parameters: 2047 spokes, TR 0.97 ms, temporal resolution 2 s, 192/384 kHz excitation/acquisition bandwidths, 5-6° flip angle, and 643 matrix size with 625 µm isotropic resolution. Each rat underwent 2–5 sessions of imaging in either awake state or under isoflurane (0.5%) + medetomidine (0.03 mg/kg/h, s.c.) anesthesia. Electrical (anesthesia, group 1) or mechanical (anesthesia, group 2; awake, group 3) unilateral stimulation was given during the 23-min or 31-min functional scan in awake and anesthetized rats, respectively. Mechanical stimulation was induced with 5-ms pulses of compressed air. Electrical stimulation (±2 mA, 300/300 µs) was delivered via subcutaneous needles placed in the whisker pad. The 16-s stimulation block (low-frequency (1 Hz), mid-frequency (5 or 9 Hz), or high-frequency (13 or 17 Hz); total n = 1600 stimuli blocks) was followed by a 44-s baseline period. The order of stimulation frequency and delivery type was randomized. Data were processed and analyzed as described earlier6-7.Results
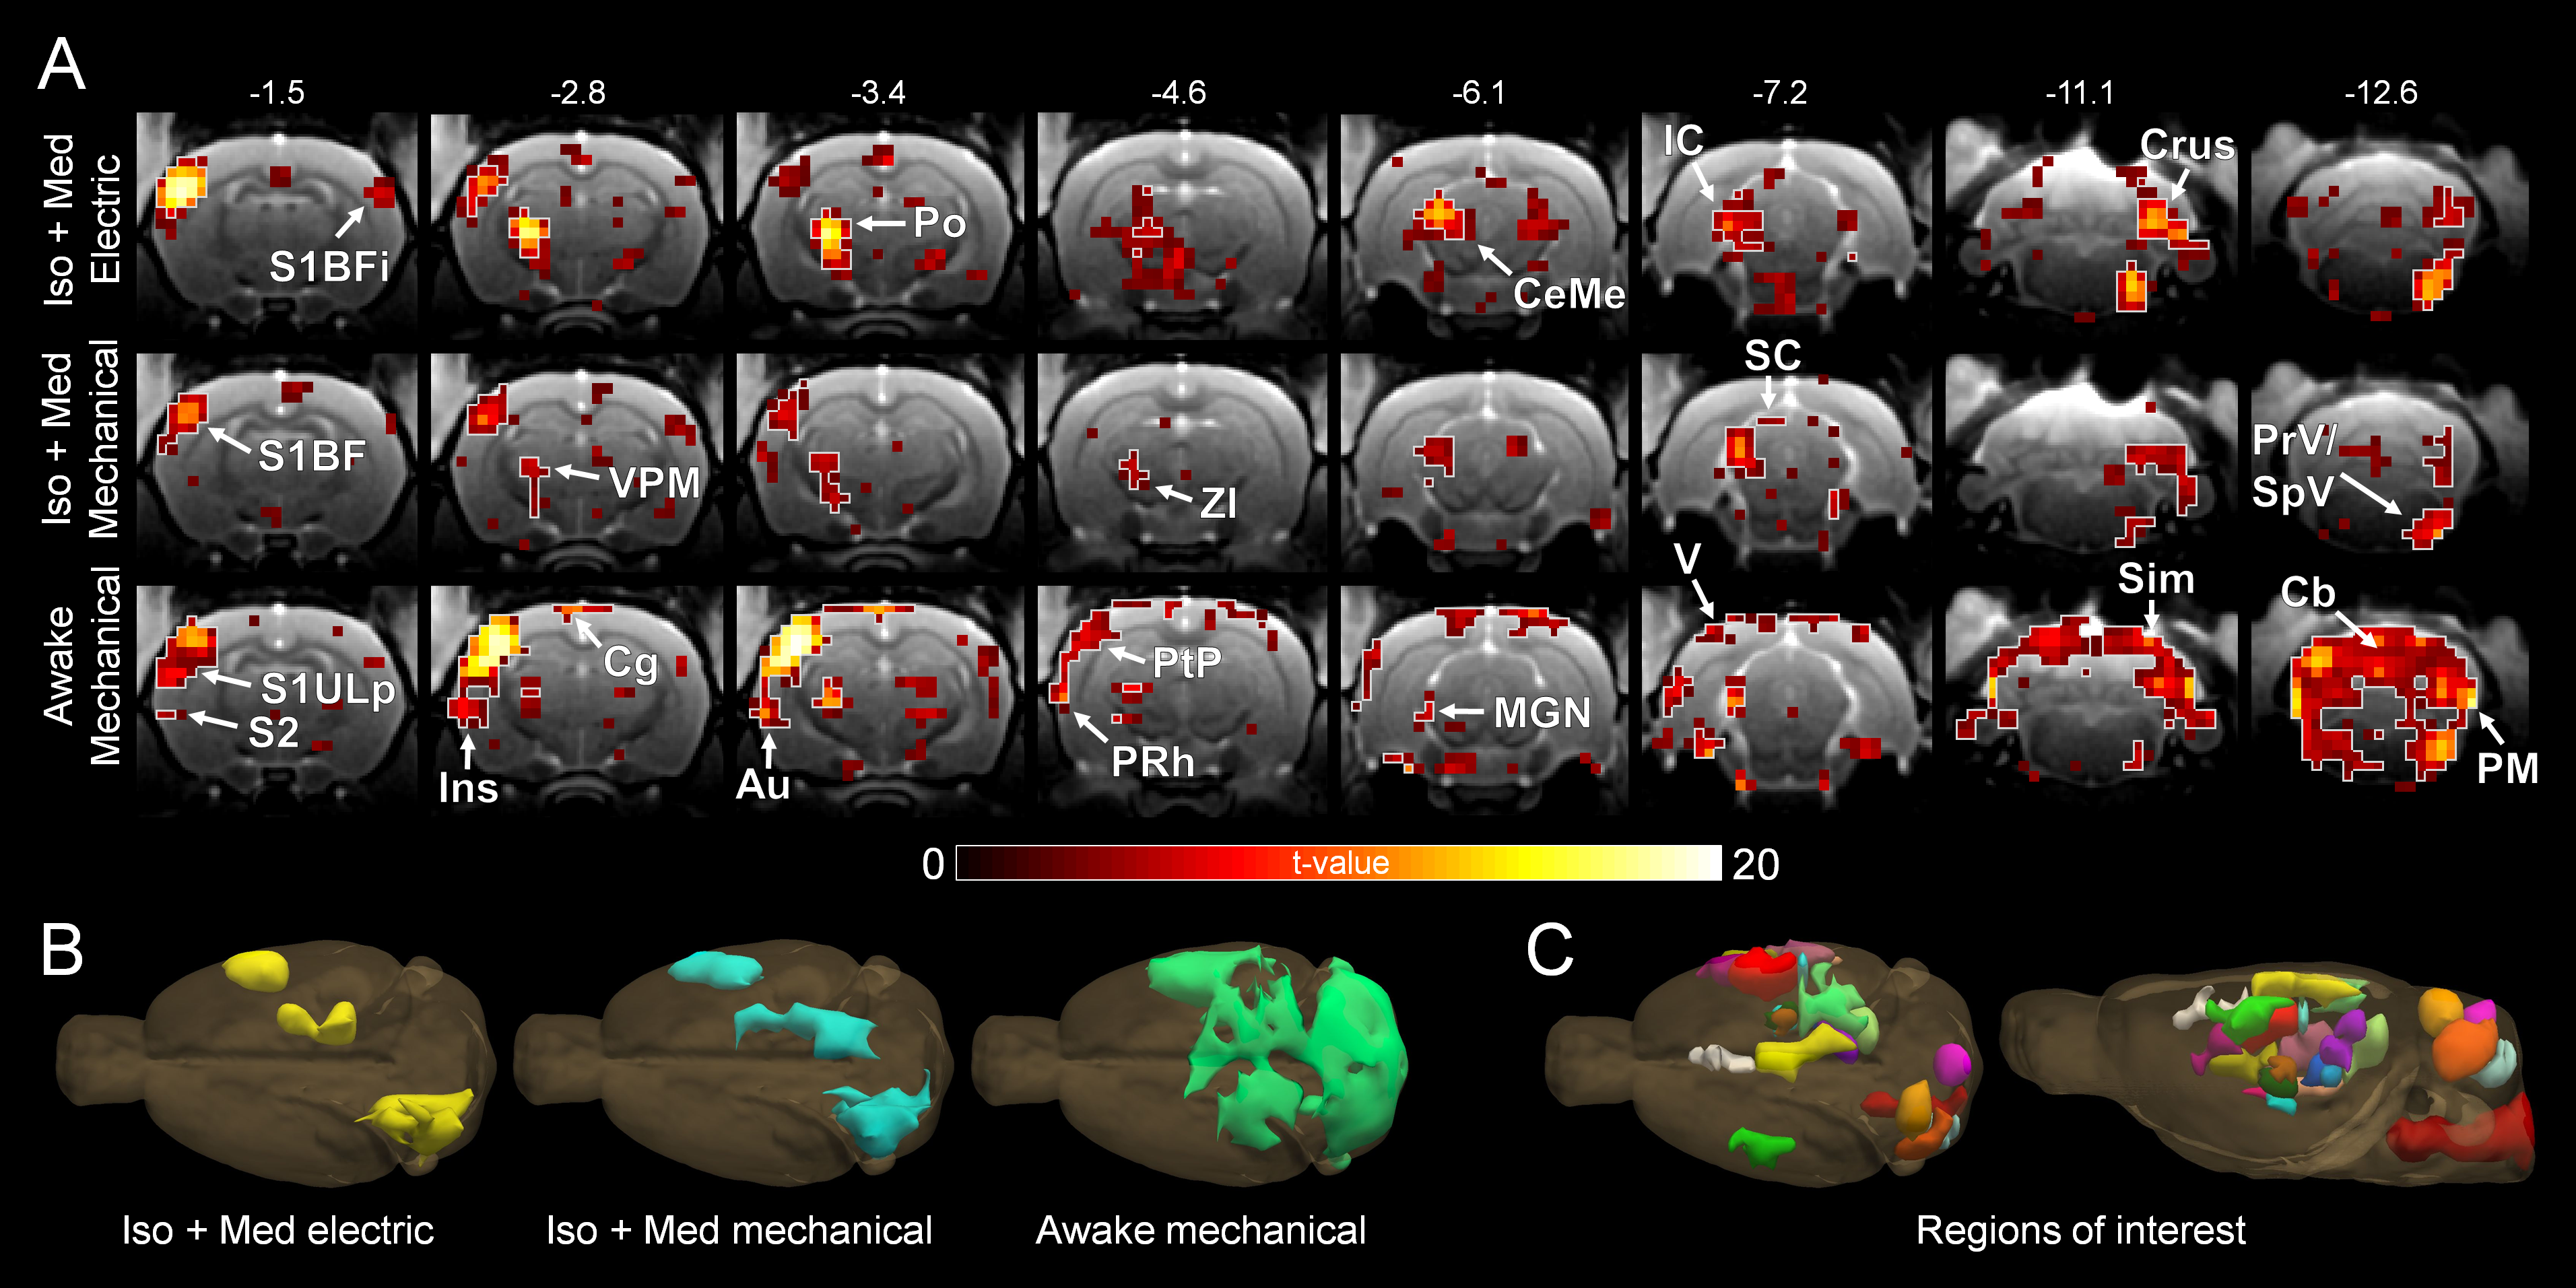
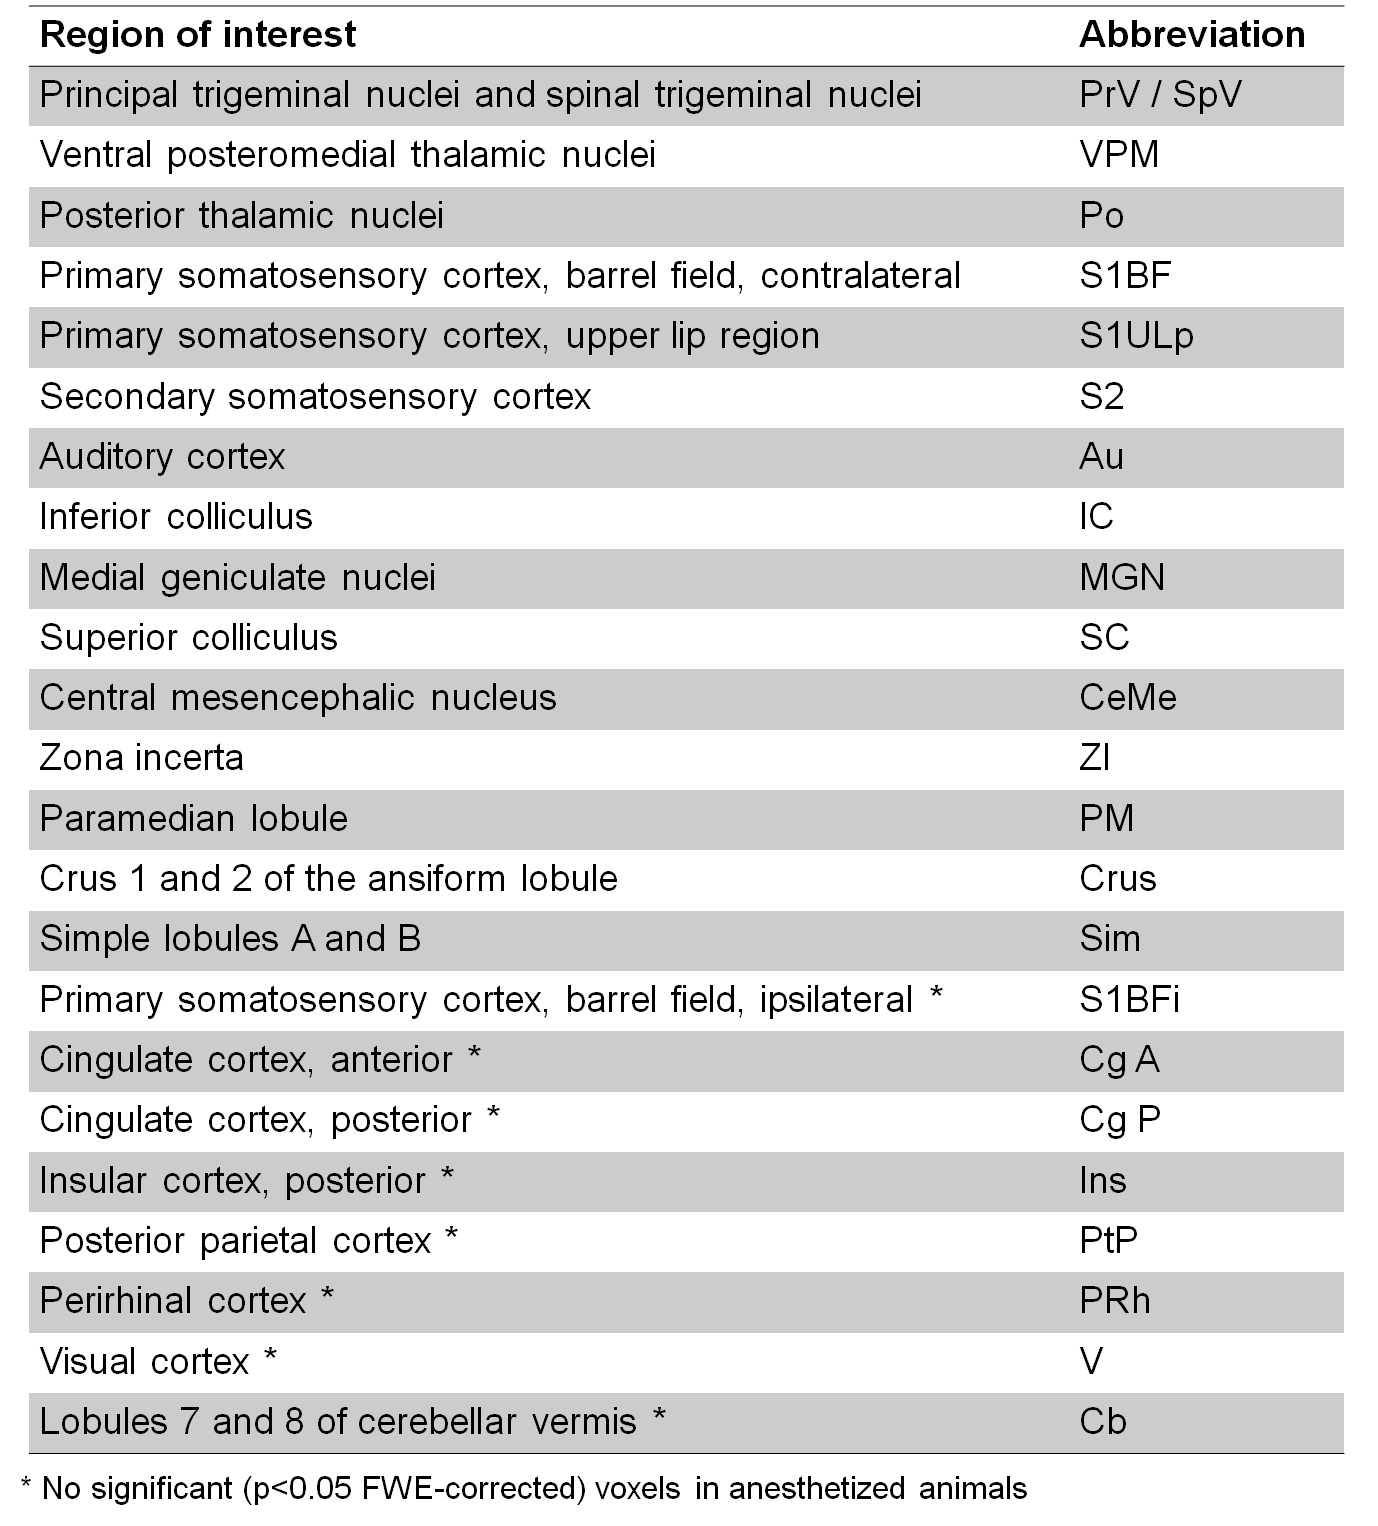
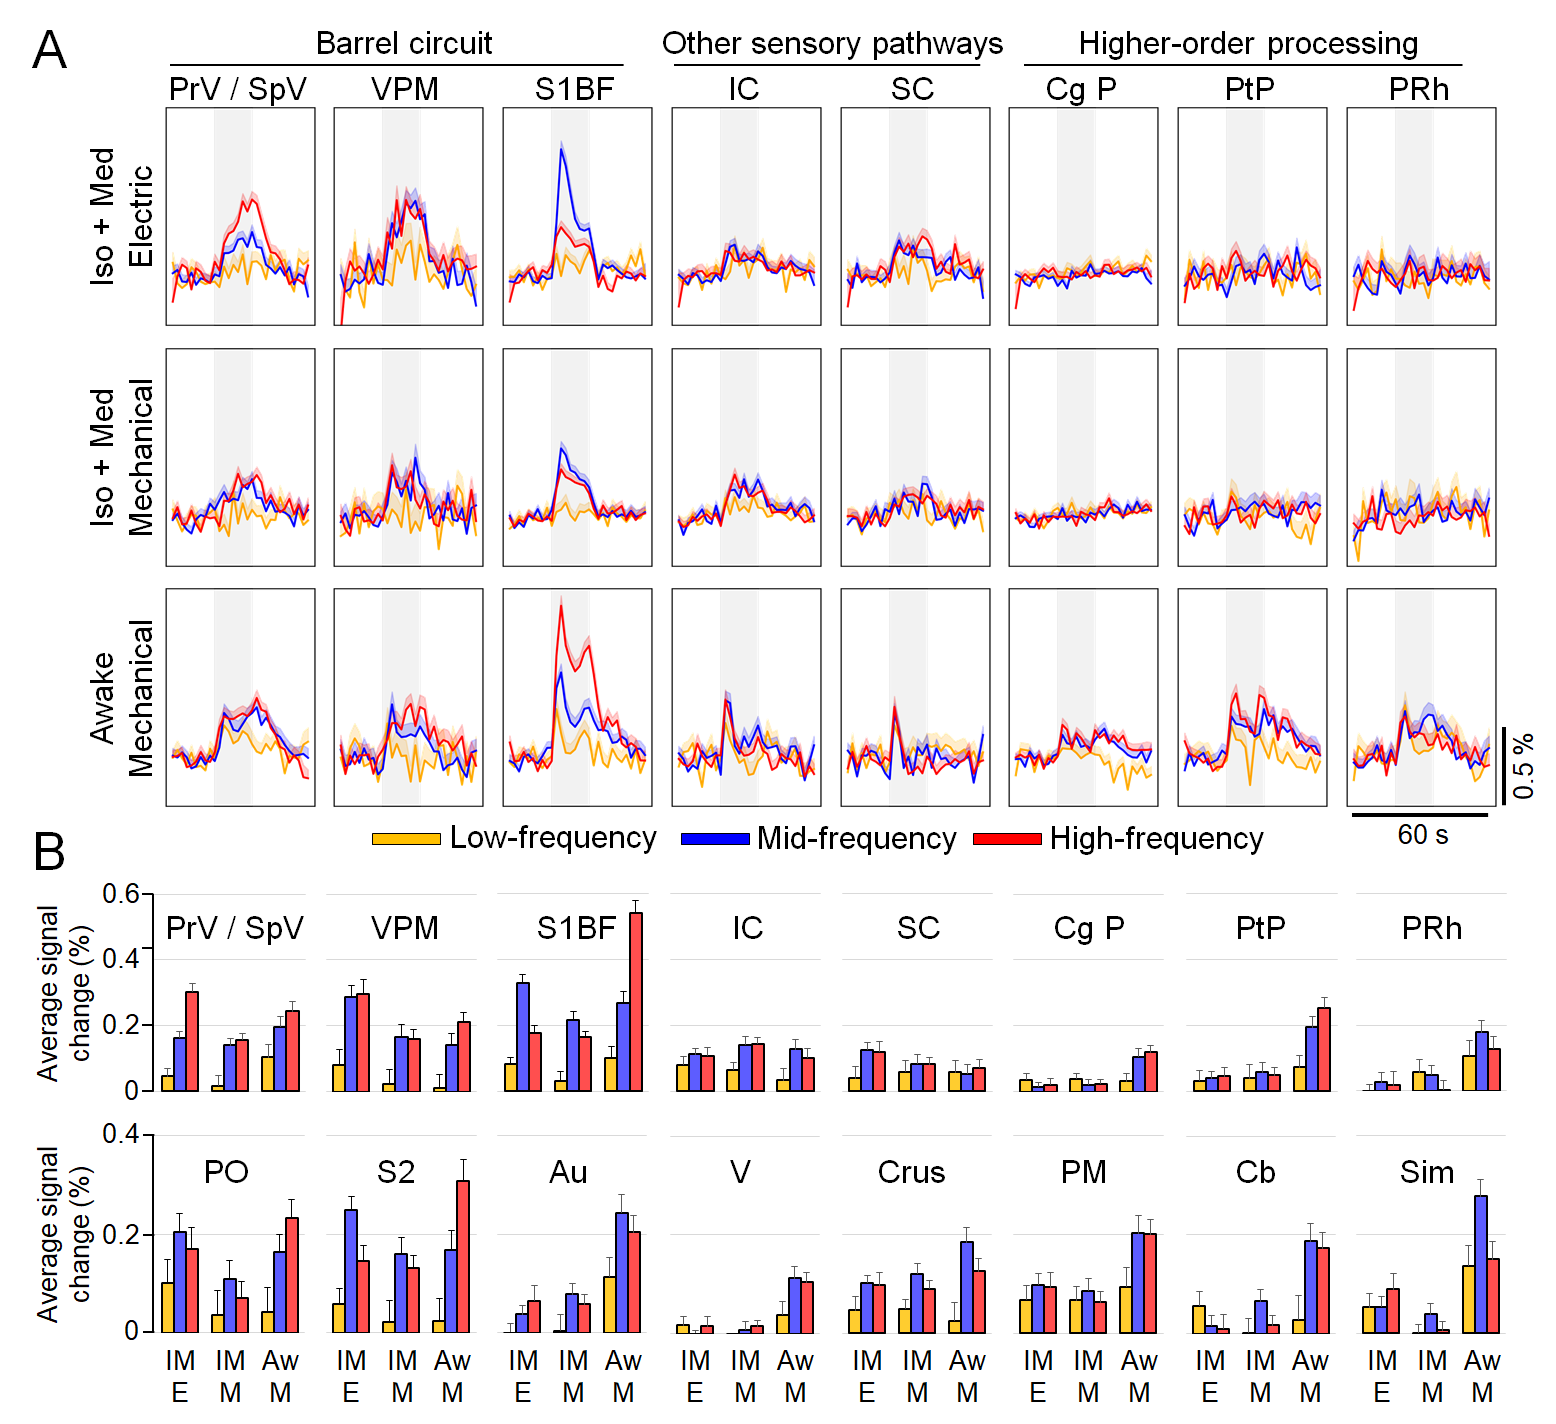
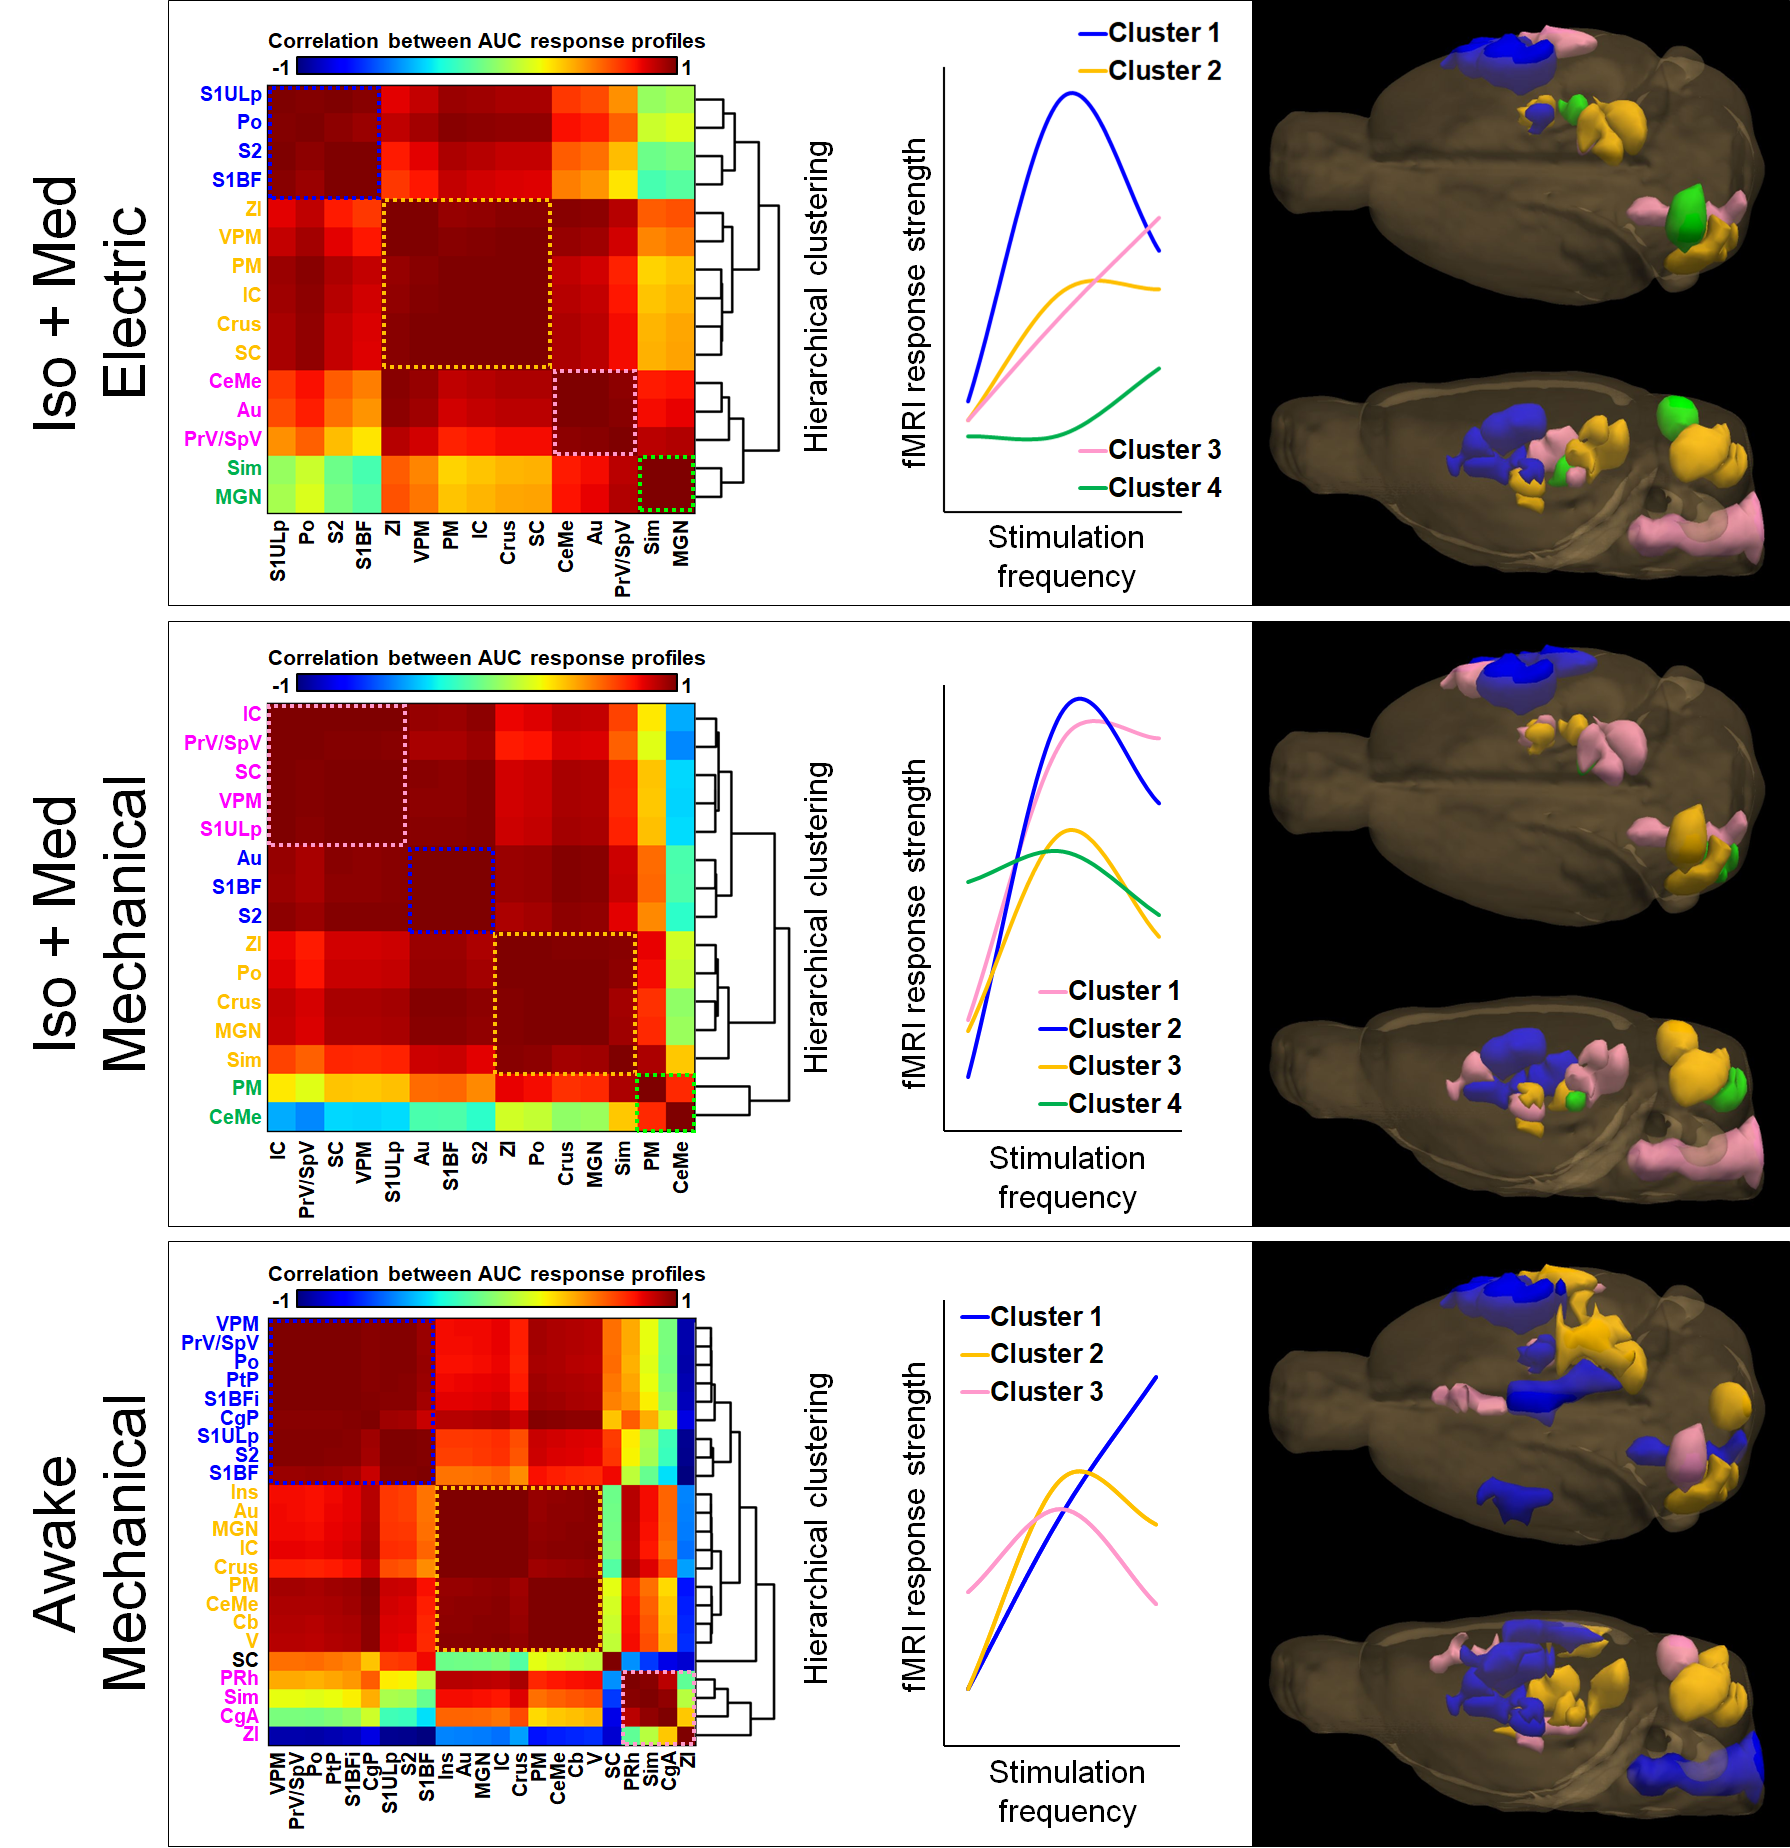
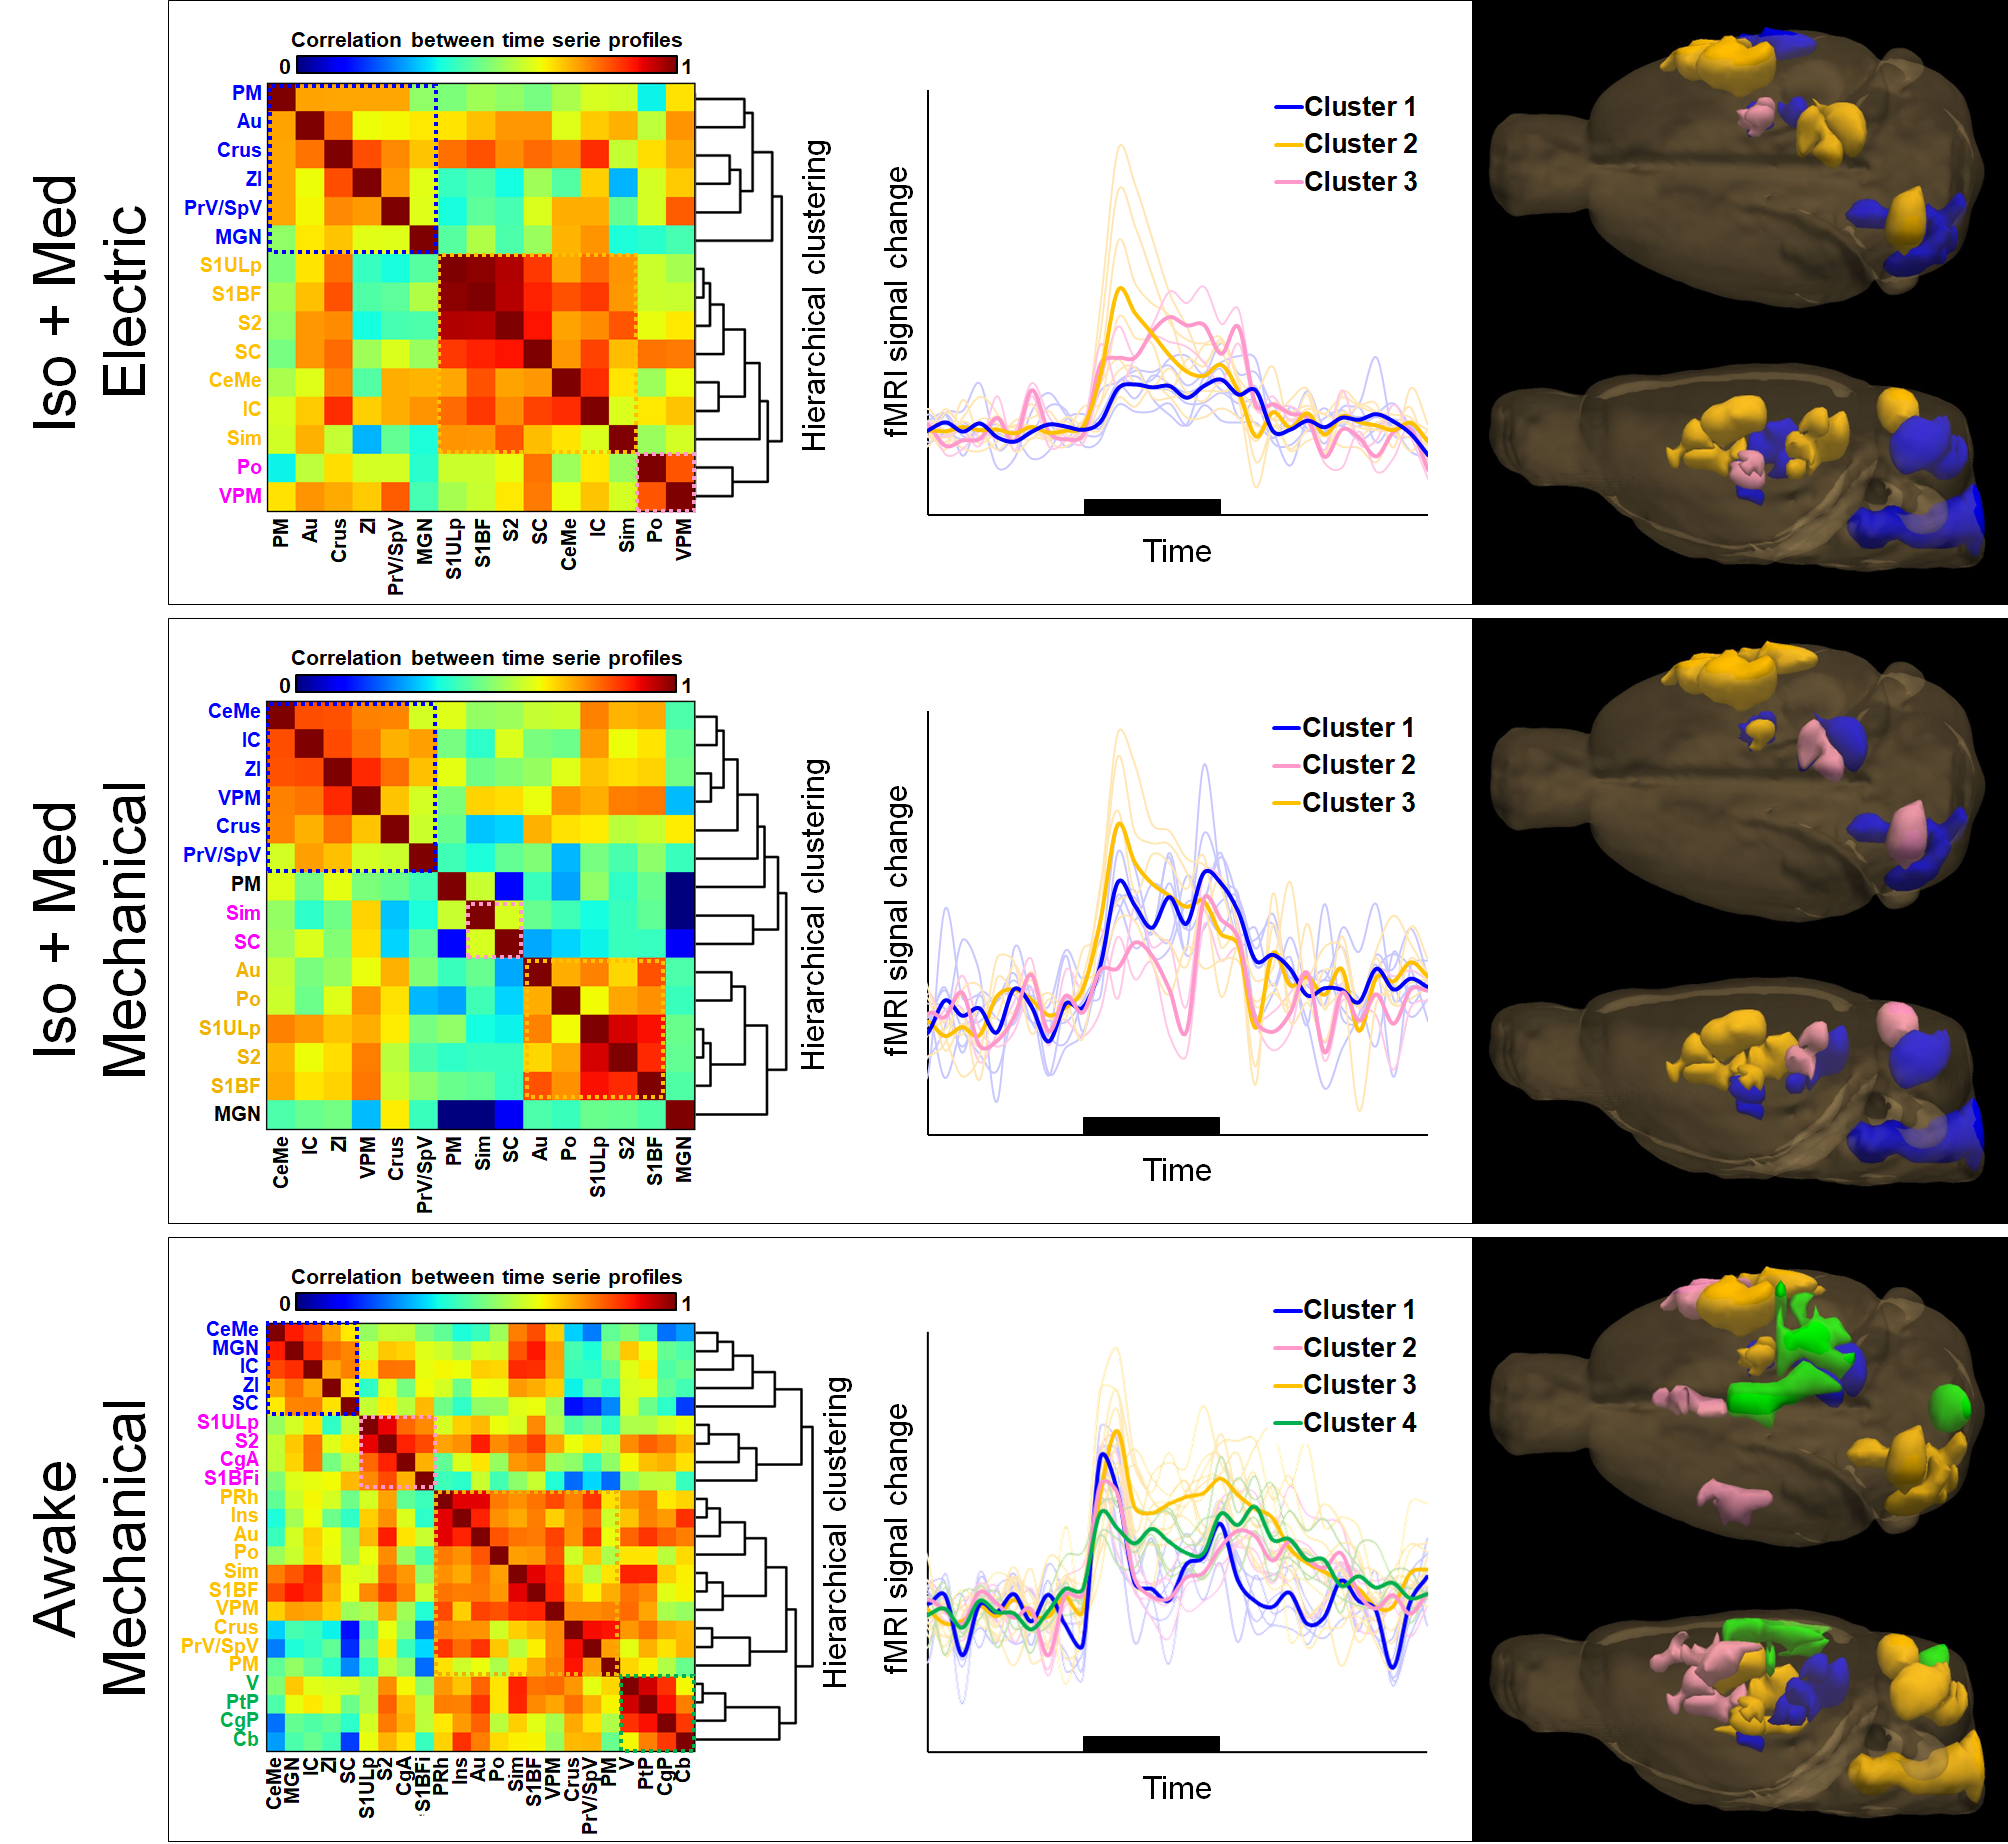
Figure 1A and 1B display the activation maps. Key nodes of barrel circuit, such as principal and spinal trigeminal nuclei, ventral posteromedial and posterior thalamic nuclei, and barrel cortex, were visible in all groups. Additionally, activation was detected in other parts of barrel circuit, such as secondary somatosensory circuit and zona incerta, but also in auditory and visual pathways and cerebellum. Moreover, the activation of cingulate, insular, visual, posterior parietal, and perirhinal cortices was detected only in awake rats. Subsequently, regions of interest (Figure 1C, Table 1) were defined for time series analyses. Figure 2 shows the characteristics of fMRI signals during different stimulation frequencies. In core pathway, we observed an almost linear increase in response strength in awake animals, whereas anesthetized animals expressed saturation or inhibition of responses at mid- to high-frequency stimuli. Surprisingly, many non-core sensory regions, such as superior and inferior colliculus, exhibited steady responses to mid- and high-frequency stimuli in all groups, despite the clear differences in the core circuit across groups. The hierarchical clustering of area-under-curve response profiles (Figure 3) and time serie profiles (Figure 4) further supported that the activation of core and non-core pathways do not share similar response profiles or temporal dynamics in awake animals. In anesthetized animals, a similar but not as clear trend was observed.Discussion
Our results suggest that whisker pad stimulation induces widespread activations in brain-wide non-core circuits, indicating cross-sensory integration. The responses in non-core regions are small, but detectable with a large amount of data. Many aspects of the cross-sensory interplay were preserved under mild anesthesia, but particularly the emotional, decision-making, and cortical higher order processing were suppressed. Importantly, only the observations in awake animals strongly suggest that the level of input into the core pathway does not necessarily correlate with the activity level of non-core pathways.Conclusion
We conclude that cross-sensory interplay can be detected and studied with fMRI, revealing novel aspects of the very basic cross-sensory processes. Also, our results suggest that anesthesia modulates cross-sensory interactions and may thus represent a significant confounding factor.Acknowledgements
This work was supported by NIH grants P41 EB027061 and R01 MH127548-01.References
1. Petersen CC. The functional organization of the barrel cortex. Neuron. 2007 Oct 25;56(2):339-55. doi: 10.1016/j.neuron.2007.09.017
2. Driver J, Noesselt T. Multisensory interplay reveals crossmodal influences on 'sensory-specific' brain regions, neural responses, and judgments. Neuron. 2008 Jan 10;57(1):11-23. doi: 10.1016/j.neuron.2007.12.013
3. Gruters KG, Groh JM. Sounds and beyond: multisensory and other non-auditory signals in the inferior colliculus. Front Neural Circuits. 2012 Dec 11;6:96. doi: 10.3389/fncir.2012.00096
4. Henschke JU, Noesselt T, Scheich H, Budinger E. Possible anatomical pathways for short-latency multisensory integration processes in primary sensory cortices. Brain Struct Funct. 2015 Mar;220(2):955-77. doi: 10.1007/s00429-013-0694-4
5. Lehto LJ, Idiyatullin D, Zhang J, Utecht L, Adriany G, Garwood M, Gröhn O, Michaeli S, Mangia S. MB-SWIFT functional MRI during deep brain stimulation in rats. Neuroimage. 2017 Oct 1;159:443-448. doi: 10.1016/j.neuroimage.2017.08.012
6. Paasonen J, Laakso H, Pirttimäki T, Stenroos P, Salo RA, Zhurakovskaya E, Lehto LJ, Tanila H, Garwood M, Michaeli S, Idiyatullin D, Mangia S, Gröhn O. Multi-band SWIFT enables quiet and artefact-free EEG-fMRI and awake fMRI studies in rat. Neuroimage. 2020 Feb 1;206:116338. doi: 10.1016/j.neuroimage.2019.116338
7. Paasonen J, Stenroos P, Laakso H, Pirttimäki T, Paasonen E, Salo RA, Tanila H, Idiyatullin D, Garwood M, Michaeli S, Mangia S, Gröhn O. Whole-brain studies of spontaneous behavior in head-fixed rats enabled by zero echo time MB-SWIFT fMRI. Neuroimage. 2022 Apr 15;250:118924. doi: 10.1016/j.neuroimage.2022.118924
8. Stenroos P, Paasonen J, Salo RA, Jokivarsi K, Shatillo A, Tanila H, Gröhn O. Awake Rat Brain Functional Magnetic Resonance Imaging Using Standard Radio Frequency Coils and a 3D Printed Restraint Kit. Front Neurosci. 2018 Aug 20;12:548. doi: 10.3389/fnins.2018.00548
Figures