0530
Single-pulse optogenetic perturbation of thalamo-cortical networks reveals functional architecture of rsfMRI networks1Laboratory of Biomedical Imaging and Signal Processing, The University of Hong Kong, Hong Kong SAR, China, 2Department of Electrical and Electronic Engineering, The University of Hong Kong, Hong Kong SAR, China, 3Department of Diagnostic Radiology, The University of Hong Kong, Hong Kong SAR, China, 4School of Biomedical Sciences, The University of Hong Kong, Hong Kong SAR, China
Synopsis
Keywords: Functional Connectivity, fMRI (resting state), functional connectivity, neuroscience, brain connectivity
Motivation: A current overarching challenge in neuroscience is to establish an integrated understanding of brain circuits and networks, particularly the interactions of neural populations across various spatiotemporal scales that give rise to functions and behavior.
Goal(s): We posit that dissecting rsfMRI dynamics under direct single-pulse optogenetic modulation of thalamo-cortical networks will reveal critical insights into the functional architecture of rsfMRI networks.
Approach: We deployed a computational approach (i.e., Gaussian PCA-HMM) to examine the organization of rsfMRI networks before and upon single-pulse stimulation of thalamus.
Results: We demonstrated a significant role of the basal forebrain and hypothalamus in regulating the transient dynamics of rsfMRI networks.
Impact: The ability to directly perturb and model dynamics of rsfMRI networks present an unprecedented opportunity to understand brain-wide and higher-order circuits/networks, and their functions, which are difficult to probe using traditional behavioral and/or cognitive tasks and other neuroimaging approaches.
Introduction
Resting-state fMRI (rsfMRI)1-12 has emerged as the most valuable, non-invasive imaging technique to map long-range, brain-wide functional connectivity networks. Recently, dynamic rsfMRI network segregation and integration have been shown to facilitate and modulate diverse cognitive functions13-16. Such dynamics are structural-functional hierarchically organized and has been observed across a range of temporal scales17-21, spanning from days or hours, to minutes. Converging studies postulate that critical transient states and their transition processes subserve such functional architecture of rsfMRI networks20-23.However, previous studies using either rsfMRI measurements only (i.e., during awake/sleep state) or task-based fMRI with conventional stimulation paradigms (i.e., block-designed/pulse trains) fail to clearly dissect transient/seconds-level reorganization of rsfMRI architecture upon stimulations. Here, we propose to implement a single-pulse stimulation design to exert minimum influence on spontaneous activities (e.g., occurrence/intensity of spontaneous neural events) while modulating rsfMRI transient states and transition processes. The ability to initiate single impulse neural activity offers a unique opportunity to dissect the complex functional architecture of rsfMRI networks, akin to the use of a single electrical pulse to determine the characteristics/properties of a complex electrical circuit.
Method
Animal preparation (Figure 1): 3μl AAV5-CaMKIIα::ChR2(H134R)-mCherry was injected to ventral posteromedial thalamus (VPM) of SD rats (6-7 weeks, n=11). Four weeks after injection, rats were implanted with an opaque optical fiber cannula (d=450μm).fMRI acquisition and analysis: fMRI data were acquired at 7T Bruker scanner using GE-EPI. Standard fMRI preprocessing and concatenation of all optogenetic fMRI (ogfMRI) scans (N=11 animals, n=102 trials) were performed. Seed-based analysis (SBA) was applied to map the interhemispheric rsfMRI connectivity (N=17 animals, n=90 trials) .
Hidden Markov modeling (HMM): The Gaussian HMM model14 generated 18 states composing mean activation, state transition matrix, and state time course based on the PCA time courses (70% variance explained) on the shared space of rsfMRI and ogfMRI data (Figure 1D). Voxel-based mean activation map was obtained by averaging the BOLD signal when each state was activated. States were further decomposed into rising, during, and decreasing phases to examine the temporal information transmission and state stability.
Results
Transient states and transition pathways in rsfMRI networks (Figure 2):HMM network states resembled the combination of several seed-based rsfMRI networks (RSN), such as homotopic primary somatosensory (S1), hippocampus (HP), default mode network (DMN), and caudata putamen (CPu) networks. States 1-14 exhibited short lifetime (median ranging 1-3s) and high occurrence rate (>20/hr), indicating their transient and repeatedly occurring properties. Such transient states were categorized into three groups based on the state transition space capturing the 90th percentile transitions. Specifically, states in instantaneous upon-stimulus pathways (IUS) resembled single-pulse activity propagation map with high spatiotemporal similarity in S1 (state 1) and remote regions (state 2)24. Recurrent loop (RL) showed a high transition probability between states with brain-wide regions co-fluctuating either positively or negatively. Background states exhibited directional efferent but no directional afferent transitions, encompassing HP network (states 11,12) or DMN (states 13-14) .
Single-pulse thalamic stimulation selectively alters transient states (Figure 3):
Transient states were significantly increased (states 1-3, 9-11) or decreased (states 4-8, 12-14) upon stimulation. Specifically, the probabilities of states with positive mean S1 activations (states 1, 2, 9, 10), and negative Cg (state 3) and HP networks (state 11) increased upon stimulation. In contrast, the probabilities of states with negative mean somatosensory cortical activations (states 5-8), and positive DMN accompanied with or without HP (states 13-14), DMN with CPu and S2 (state 4) and HP network (state 12) decreased.
Single-pulse stimulation reorganizes state transition pathways (Figure 4):
Single-pulse stimulation increased the transition probability to IUS and its occurrence rate, while decreased those of RL, without significantly affecting the duration of RL and IUS. Specifically, state 6 (CPu and HTh) exhibited the largest state transition pathway change from RL to IUS, indicating its role as a major bifurcation point between RL and IUS pathways upon impulse neural activity input from VPM.
Discussion and Conclusion
In conclusion, our findings demonstrate that single-pulse optogenetic stimulation at VPM unveils the functional architecture of rsfMRI networks. Stimulation enhances positive sensorimotor cortical networks, but suppresses negative counterparts, as we targeted the excitatory neurons at VPM that directly project to the somatosensory cortex. Conversely, the stimulation suppresses the positive DMN and HP network, but enhances their negative counterparts. DMN is typically deactivated during externally-oriented cognitive tasks25. Importantly, our results reveal the significant role of the basal forebrain and hypothalamus in regulating the dynamics of rsfMRI networks transiting between the stimulated- and resting-state26.Acknowledgements
This work was supported in part by Hong Kong Research Grant Council (HKU17112120, HKU17127121, HKU17127022 and HKU17127523 to E.X.W; and HKU17104020, HKU17127021, HKU17127723 to A.T.L.L.), Lam Woo Foundation, and Guangdong Key Technologies for AD Diagnostic and Treatment of Brain (2018B030336001) to E.X.W.References
1. Park, H.J. & Friston, K. Structural and functional brain networks: from connections to cognition. Science 342, 1238411 (2013).
2. Buckner, R.L., Krienen, F.M. & Yeo, B.T. Opportunities and limitations of intrinsic functional connectivity MRI. Nat Neurosci 16, 832-837 (2013).
3. Fox, M.D. & Raichle, M.E. Spontaneous fluctuations in brain activity observed with functional magnetic resonance imaging. Nat Rev Neurosci 8, 700-711 (2007).
4. Chuang, K.H. & Nasrallah, F.A. Functional networks and network perturbations in rodents. Neuroimage (2017).
5. Eickhoff, S.B., Yeo, B.T.T. & Genon, S. Imaging-based parcellations of the human brain. Nat Rev Neurosci 19, 672-686 (2018).
6. Bolt, T., et al. A parsimonious description of global functional brain organization in three spatiotemporal patterns. Nat Neurosci 25, 1093-1103 (2022).
7. Drysdale, A.T., et al. Resting-state connectivity biomarkers define neurophysiological subtypes of depression. Nat Med 23, 28-38 (2017).
8. Liégeois, R., et al. Resting brain dynamics at different timescales capture distinct aspects of human behavior. Nature Communications 10, 2317 (2019).
9. Kaefer, K., Stella, F., McNaughton, B.L. & Battaglia, F.P. Replay, the default mode network and the cascaded memory systems model. Nat Rev Neurosci 23, 628-640 (2022).
10. Ito, T., et al. Cognitive task information is transferred between brain regions via resting-state network topology. Nat Commun 8, 1027 (2017).
11. Smith, S.M., et al. Resting-state fMRI in the Human Connectome Project. Neuroimage 80, 144-168 (2013).
12. Zhou, I.Y., et al. Brain resting-state functional MRI connectivity: morphological foundation and plasticity. NeuroImage 84, 1-10 (2014).
13. Vidaurre, D., Smith, S.M. & Woolrich, M.W. Brain network dynamics are hierarchically organized in time. Proc Natl Acad Sci U S A 114, 12827-12832 (2017).
14. Stevner, A.B.A., et al. Discovery of key whole-brain transitions and dynamics during human wakefulness and non-REM sleep. Nat Commun 10, 1035 (2019).
15. Ito, T. & Murray, J.D. Multitask representations in the human cortex transform along a sensory-to-motor hierarchy. Nat Neurosci 26, 306-315 (2023).
16. Chuang, K.H., Li, Z., Huang, H.H., Khorasani Gerdekoohi, S. & Athwal, D. Hemodynamic transient and functional connectivity follow structural connectivity and cell type over the brain hierarchy. Proc Natl Acad Sci U S A 120, e2202435120 (2023).
17. Wang, R., et al. Segregation, integration, and balance of large-scale resting brain networks configure different cognitive abilities. Proc Natl Acad Sci U S A 118(2021).
18. Shine, J.M., et al. Human cognition involves the dynamic integration of neural activity and neuromodulatory systems. Nat Neurosci 22, 289-296 (2019).
19. Chao, T.-H.H., et al. Neuronal dynamics of the default mode network and anterior insular cortex: Intrinsic properties and modulation by salient stimuli. Science Advances 9, eade5732 (2023).
20. Favaretto, C., et al. Subcortical-cortical dynamical states of the human brain and their breakdown in stroke. Nat Commun 13, 5069 (2022).
21. Allen, E.A., et al. Tracking whole-brain connectivity dynamics in the resting state. Cereb Cortex 24, 663-676 (2014).
22. Menon, V., et al. Optogenetic stimulation of anterior insular cortex neurons in male rats reveals causal mechanisms underlying suppression of the default mode network by the salience network. Nat Commun 14, 866 (2023).
23. Damaraju, E., et al. Dynamic functional connectivity analysis reveals transient states of dysconnectivity in schizophrenia. Neuroimage Clin 5, 298-308 (2014).
24. Xie, L., et al. Short single pulse optogenetic fMRI mapping of long-range downstream targets in thalamo-cortical pathways. in International Society for Magnetic Resonance in Medicine (2023).
25. Raichle, M.E. The brain's default mode network. Annu Rev Neurosci 38, 433-447 (2015).
26. Fernandez, L.M.J. & Luthi, A. Sleep Spindles: Mechanisms and Functions. Physiol Rev 100, 805-868 (2020).
Figures
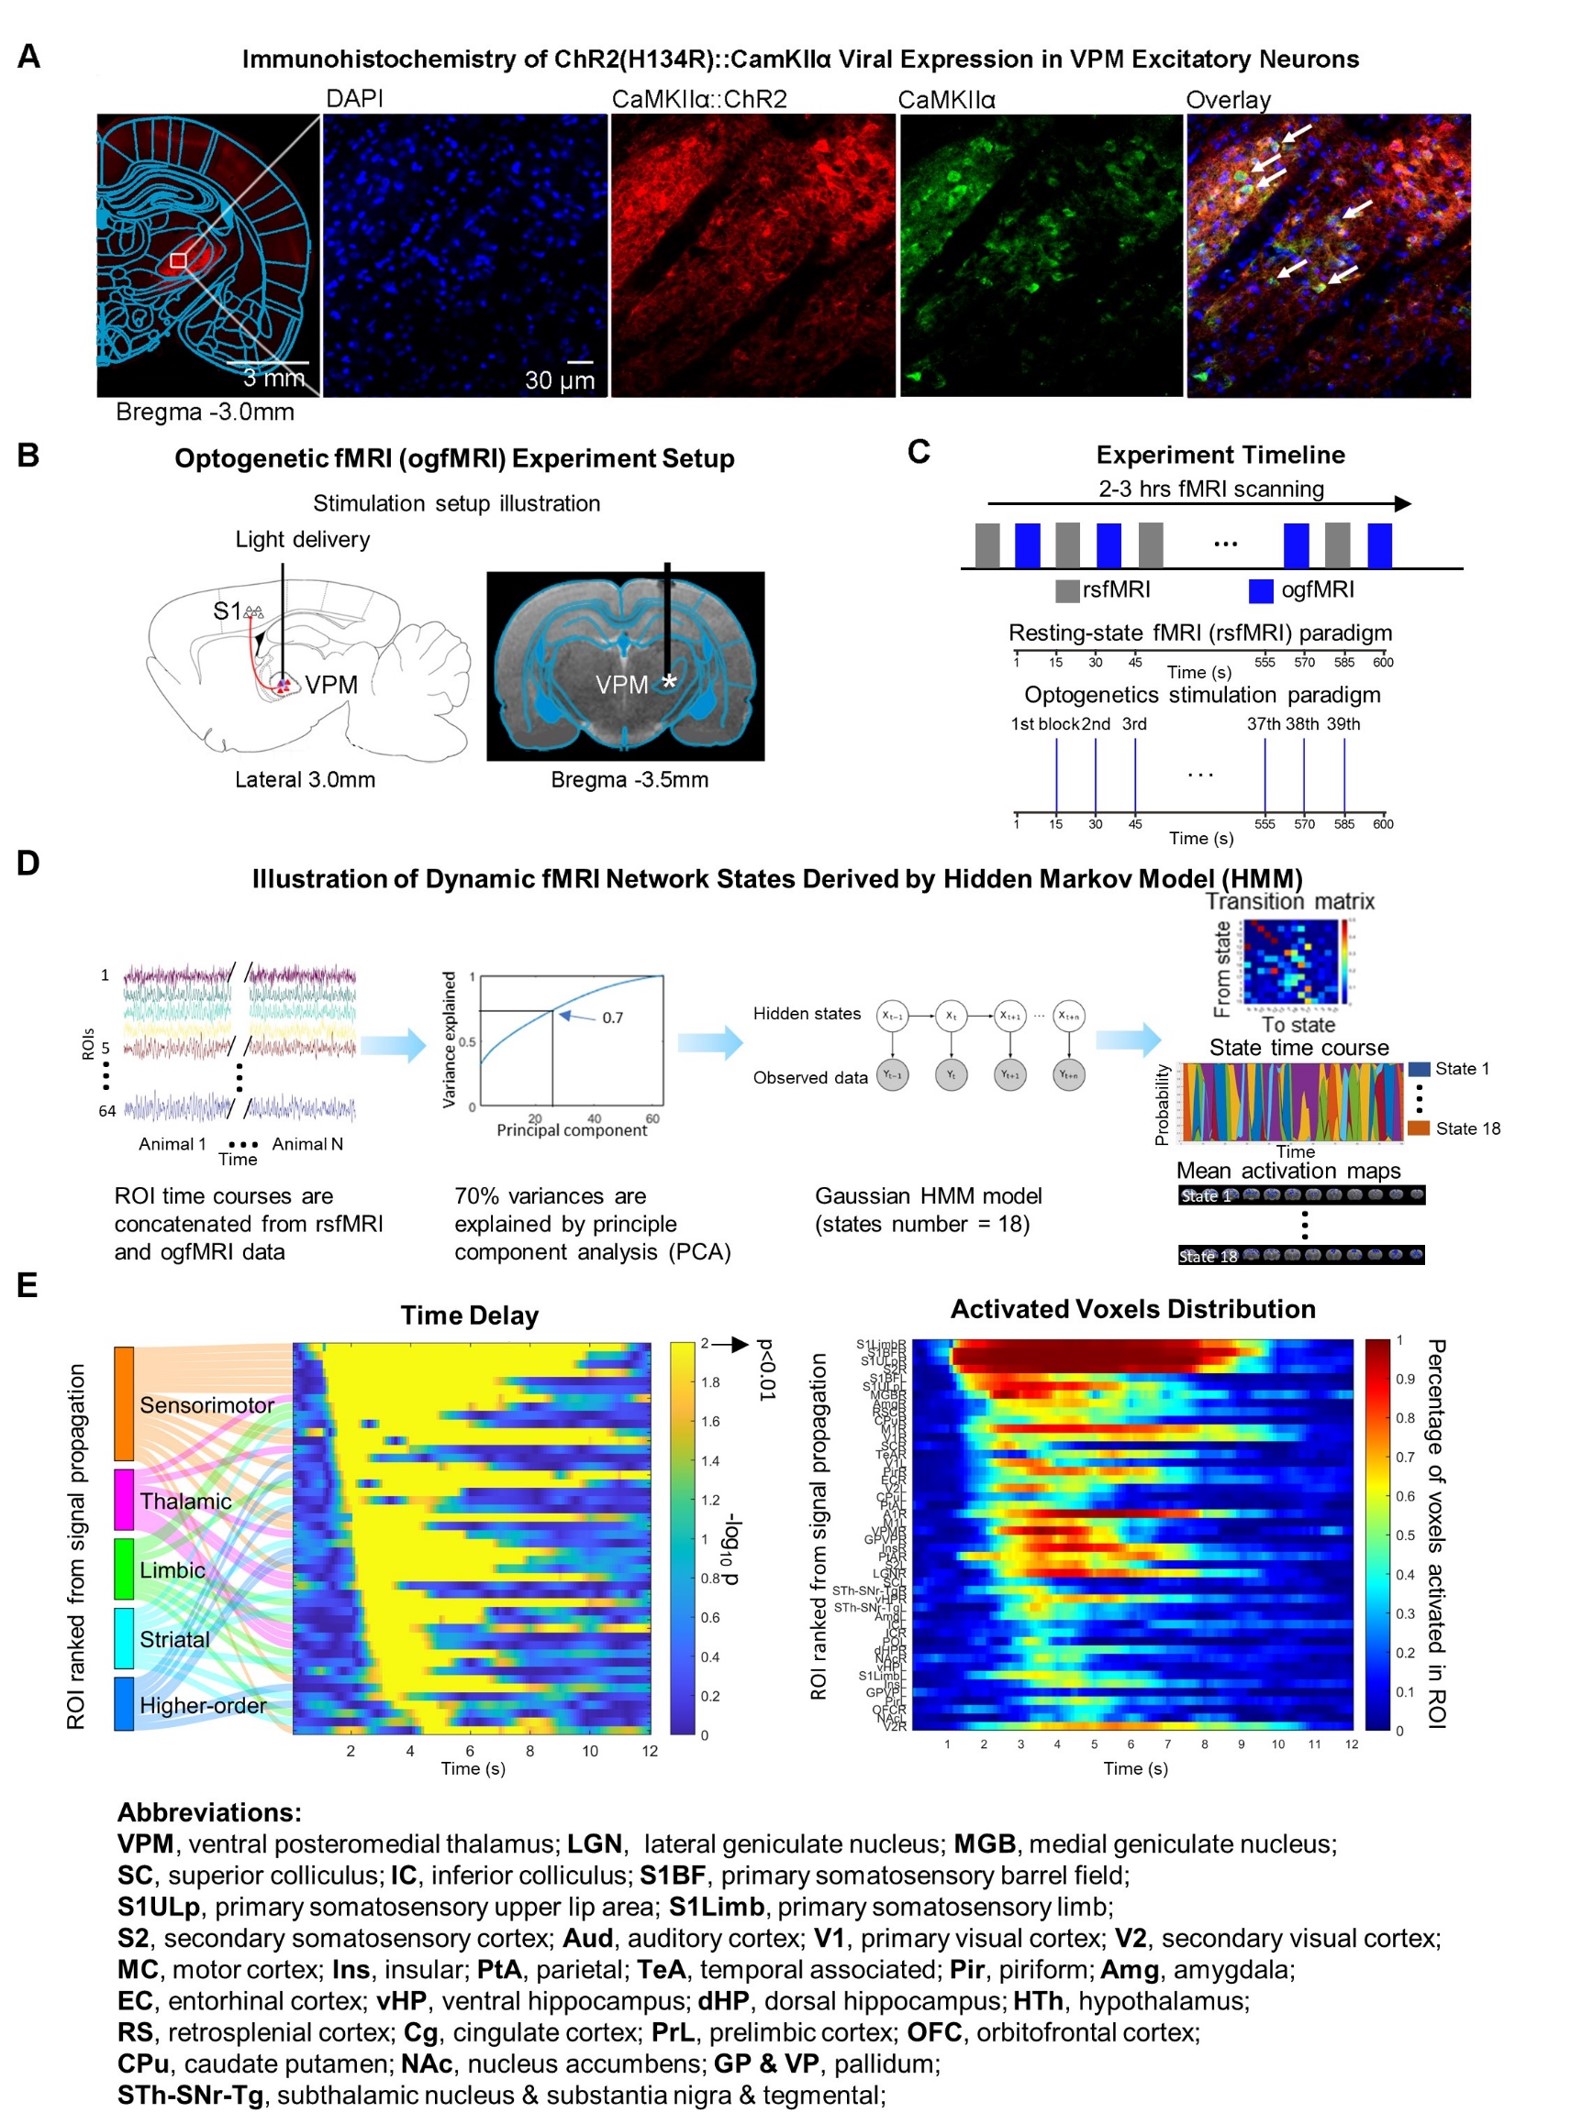
Figure 1 Methodology illustration and activity propagation mapping. (A) histological characterization of viral expression, (B) and (C) optogenetic fMRI experimental set up, (D) analysis workflow, (E) temporary sequence of neural propagation from local S1 to long-ranged regions revealed structural-functional hierarchy. For optogenetic stimulation, blue light (pulse width=10ms, pulse-to-pulse interval=15s) was presented to VPM to initiate an impulse neural activity. Each animal underwent 2-3 hours scans with rsfMRI and ogfMRI interleaved scanning.
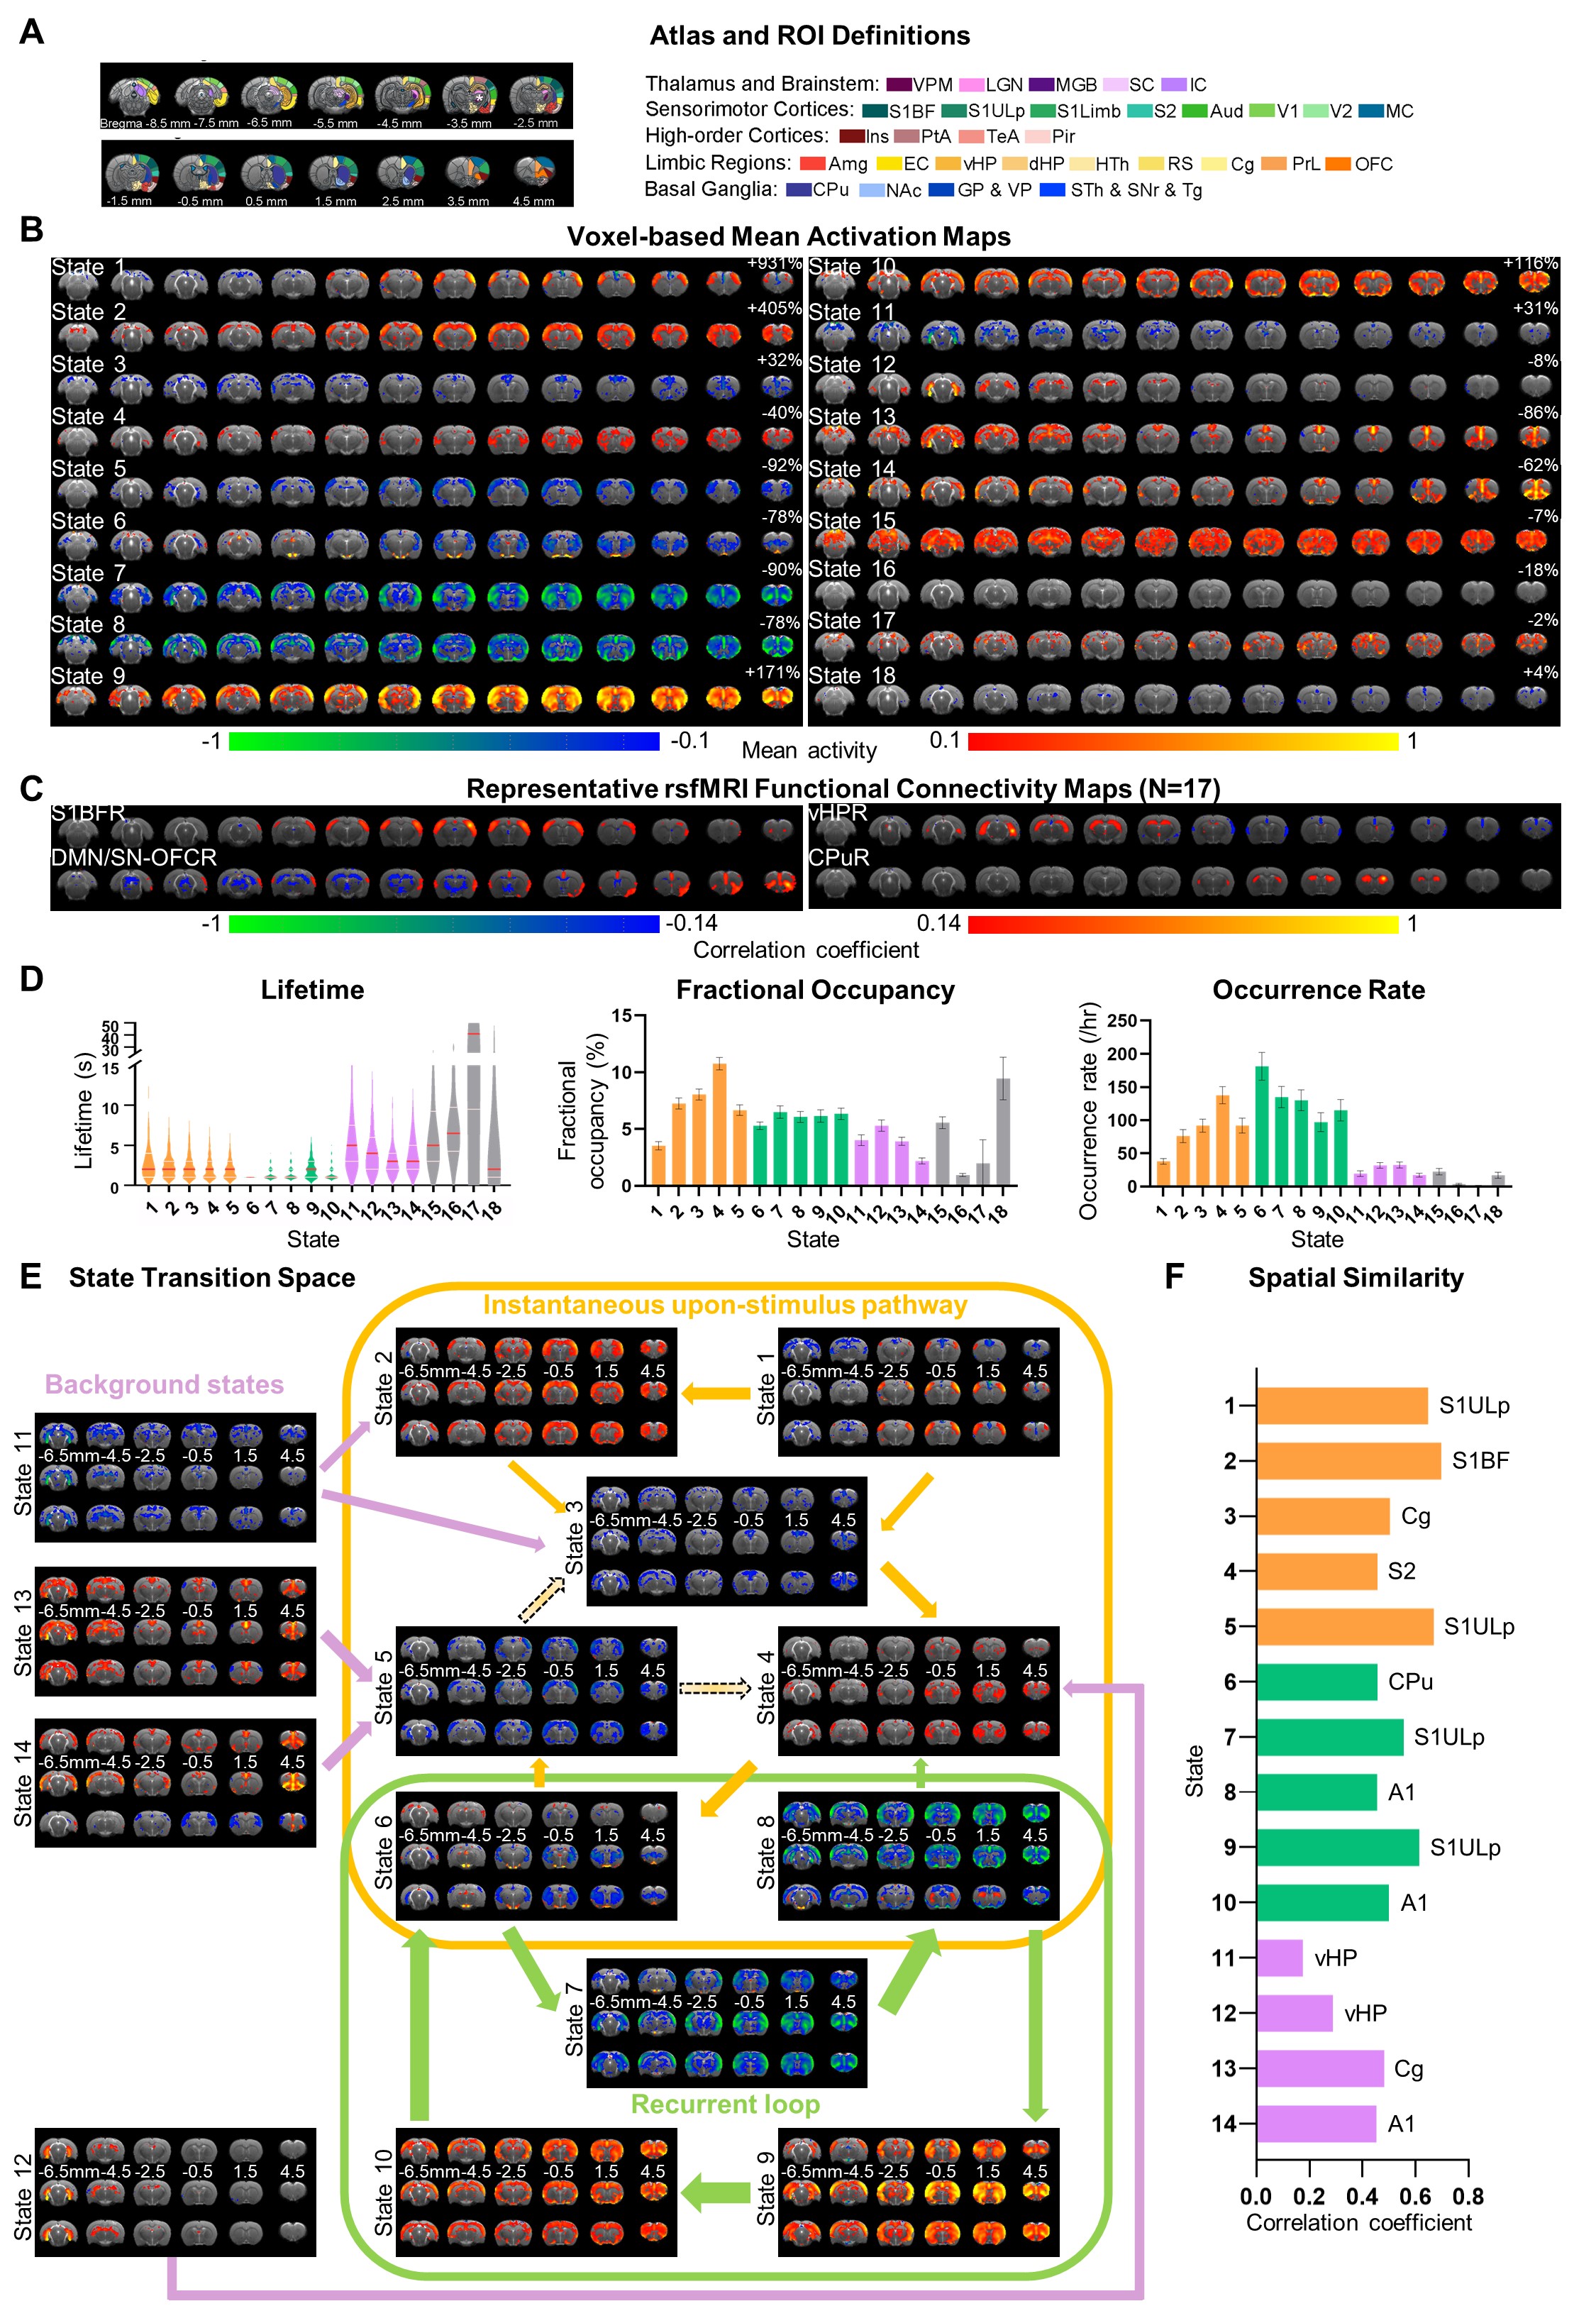
Figure 2 Transient states and transition pathways in rsfMRI networks. (A) Atlas-based ROI definition. (B) Mean activation maps (GRF correction with voxel-level P < 0.05 and cluster-level P < 0.001). (C) Seed-based analysis (SBA) to visualize interhemispheric rsfMRI connectivity. (D) Characteristics of states. (E) State transition space was populated with transitions in the 90th percentile. Each state was divided into rising (upper), during (middle), and decreasing (lower) phase. (F) Spatial correlation coefficients between states and their most similar connectivity maps.
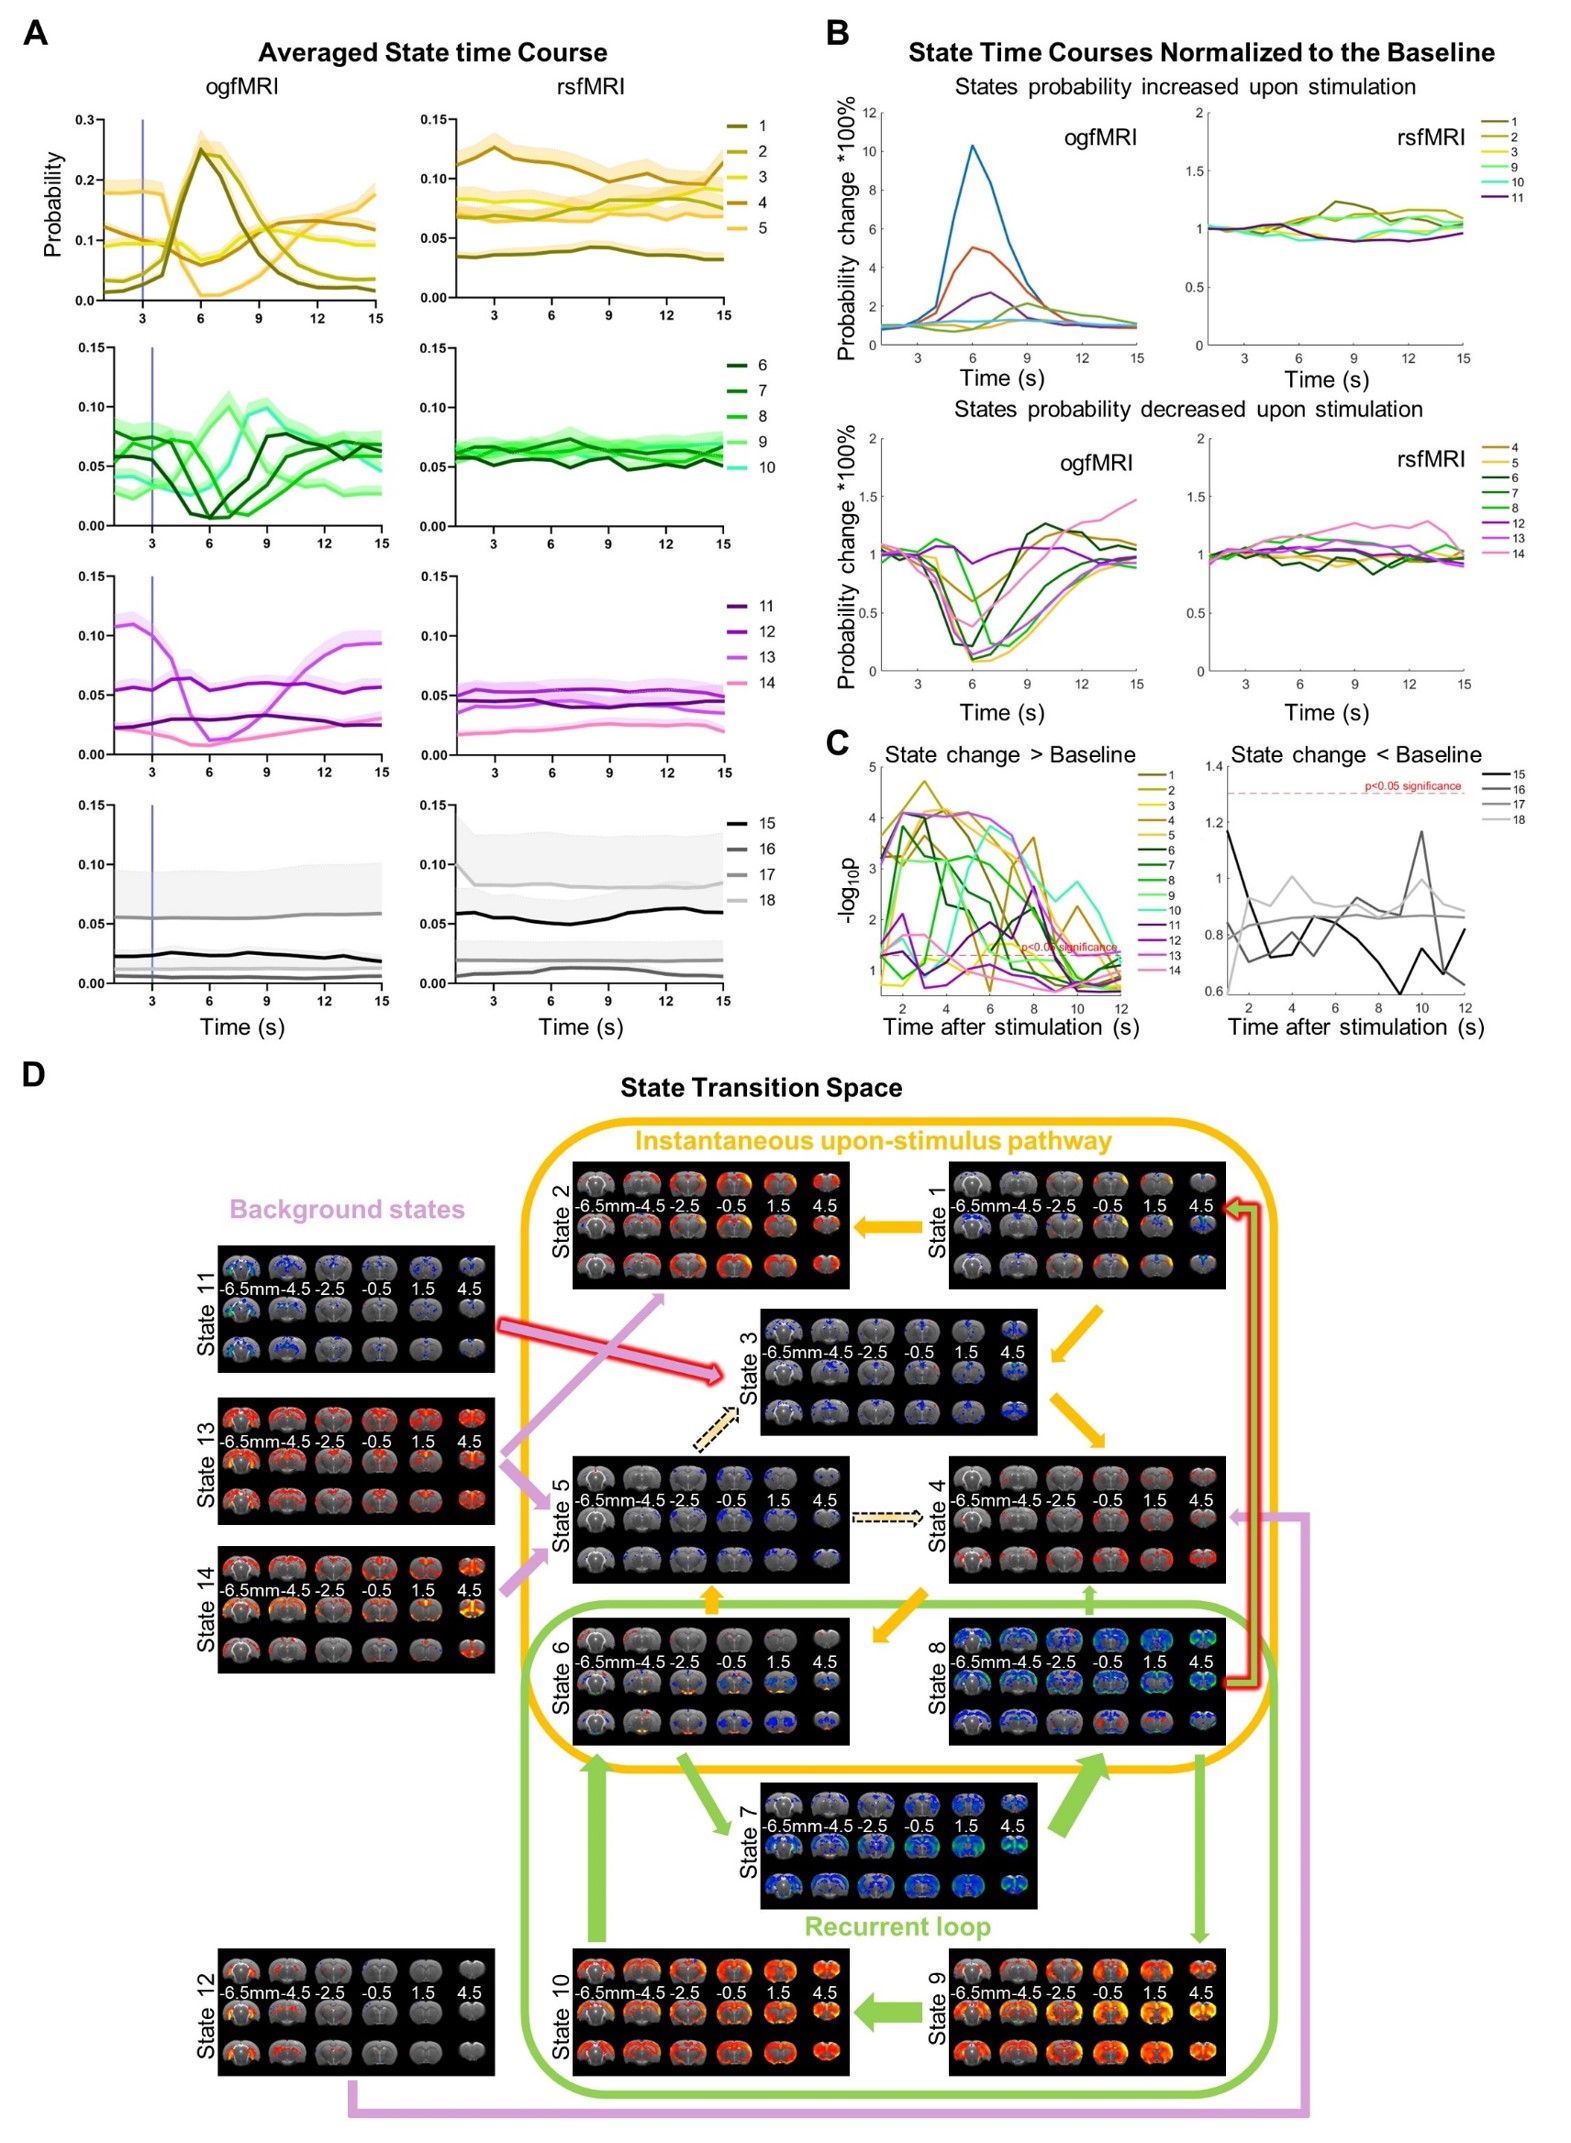
Figure 3 Single-pulse thalamic stimulation alters transient states in rsfMRI networks. (A) Averaged state time course of ogfMRI (OG) and rsfMRI (RS) data, respectively. (B) and (C) State time courses are normalized to the baseline to highlight the significant probability change upon stimulation (group paired-sample t-test against baseline, FDR corrected p<0.05). (D) State transition map for the ogfMRI data, where altered transitions were marked by the red outline of arrows.
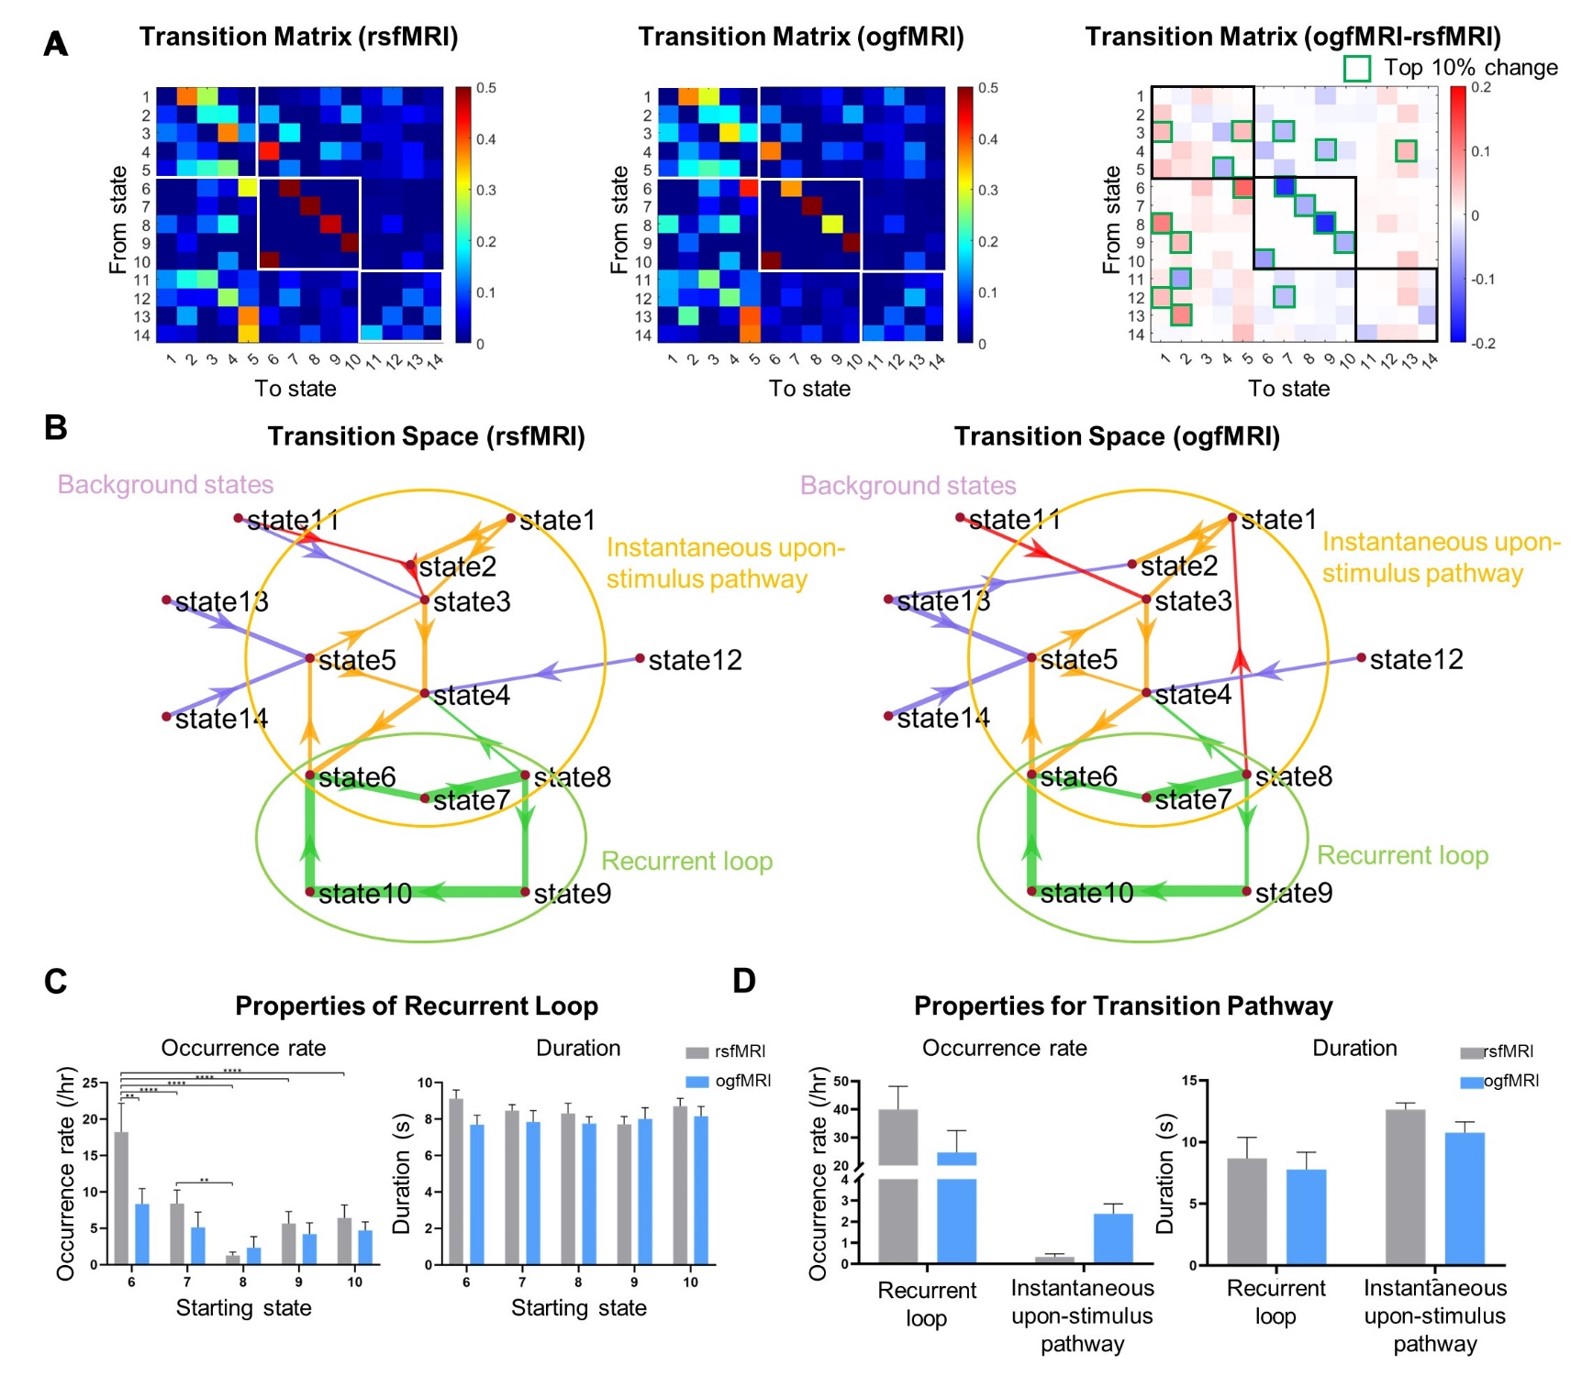
Figure 4 Single-pulse thalamic stimulation reorganizes the state transition pathways. (A) and (B) State transition matrices and spaces. Red arrows indicate the top 10% transitions found in rs/ogfMRI . (C) The bar charts show the properties of recurrent loop (RL) starting from different states (N=17 in rsfMRI and N=11 in ogfMRI, ±SEM). Two-way ANOVA (Sidak’s multiple comparisons test) showed the significant relationship between RL starting states and experimental paradigm. (D) Group average and SEM of occurrence rate and duration of RL and instantaneous upon-stimulus pathway.