0519
The Association of Cartilage Volume with Knee Pain in Osteoarthritis: An Atlas-Based vs Native Approach1NIHR Nottingham Biomedical Research Centre, University of Nottingham, Nottingham, United Kingdom, 2Radiological Sciences, Mental Health and Clinical Neuroscience, School of Medicine, University of Nottingham, Nottingham, United Kingdom
Synopsis
Keywords: Cartilage, Cartilage
Motivation: This research investigates the limited association between cartilage volume and knee pain in osteoarthritis, potentially confounded by anatomical variability.
Goal(s): To enhance the correlation between MRI-derived cartilage volumes and Western Ontario and McMaster Universities Osteoarthritis (WOMAC) pain scores using a knee atlas for image registration.
Approach: Using data from the Osteoarthritis Initiative, MRIs of subjects with OA were registered to an anatomical template. The atlas-based measurements were compared with traditional methods to assess the impact on correlation with WOMAC pain scores.
Results: Atlas registration resulted in more consistent cartilage volume measures, reducing variability, and doubling the correlation with WOMAC pain scores.
Impact: In knee osteoarthritis the registration of MRIs to an anatomical template significantly increases the association between cartilage volumes and osteoarthritis pain scores, enabling more accurate and sensitive detection of pain-related cartilage changes, potentially influencing OA management and therapy development.
Introduction
Pain is the primary symptom and hallmark of osteoarthritis (OA). In patients with symptomatic OA, pain is described as the most disabling symptom which accounts for significant health service use and drives clinical decision making1. MRI is often used in clinical trials to assess knee OA, with established and detailed scoring systems for knee OA2,3. Quantitative cartilage measures have only shown a limited association with knee pain4,5. Even in tightly controlled populations such as a study in post-menopausal females6, only cartilage patella volume was weakly associated with pain severity assessed by Western Ontario and McMaster Universities Osteoarthritis (WOMAC) score (r = -0.21). The size and anatomical variability of the knee is likely to be a significant confounder in standard cartilage analysis, potentially masking the effects of focal cartilage loss. This may lead to an under-reporting of the effect size in volume-based assessments of knee cartilage in OA. Use of a knee atlas, where images are registered to a standard template has shown voxel-based knee pathology-pain driven by Bone marrow lesions7 and tibiofemoral cartilage changes8. In this study, the effect on the correlation of cartilage volumes and WOAMC pain scores is investigated when registering Knee MRIs to an Atlas.Methods
Participants in the progression cohort of the Osteoarthritis Initiative (OAI) study9 with baseline 3D DESS knee MRI were selected for this analysis. MRI images underwent bias field correction using ANTs image intensity normalization. Also, right knees underwent an initial reflection along the median plane to have the same structure as left knees. A study specific knee atlas was created using 10 participants from the incident cohort of the OAI with no knee pain, difficulty squatting or pivoting, a knee valgus alignment of 180⁰, a BMI <30 and age between 50 and 70yrs. Automated cartilage segmentations generated using our recent U-net method10 were generated for all participants. Knee segmentation results were binarized and used to construct the knee atlas. Knee segmentations were iteratively co-registered to an average segmentation using an initial affine transform (FSL-FLIRT) the average segmentation image was updated after each iteration. A total of 10 iterations were used to create the final transformation for the knee atlas (Figure 1). MRIs were registered using the final transformation to generate the knee atlas (Figure 2). For the progression cohort, knee MRIs were registered to the atlas using an initial affine transform (FSL-FLIRT) followed by a non-linear transform (FSL-FNIRT)11. Volume measurements were made for each cartilage segmentation using both original and atlas registered MRIs to determine bias and effect on variability. The correlation strength between cartilage volumes and WOMAC pain scores was compared to examine the effect of registration of MRIs to a knee atlasResults
The effect of atlas-based registration on cartilage volume is shown in Figure 3. MRIs registered to the atlas had on average a 4% reduction in cartilage volume, while the standard deviation in cartilage volume was substantially lower, reduced by an average of -30%. Correlation strength was consistently higher for volumetry derived after atlas registration, on average 2-fold, but remained weak. The correlation between cartilage volume and WOMAC pain is shown in Table 1.Discussion
This study used a novel approach for creating a knee atlas, using segmented cartilage rather than original MRIs. These aligned very quickly, providing a robust knee atlas within only 10 iterations. The effect of registering images to the atlas has a strong effect on the dispersion of cartilage volume measurements, with standard deviation reduced on average by -30%. This was beneficial to the association between cartilage volume and baseline WOMAC pain, leading to an average near doubling in Pearson’s correlation coefficient. All cartilage volumes were found to be significantly but weakly correlated with WOMAC Pain (p<0.05), but femoral and medial tibial cartilage saw a significant increase in their correlation with WOMAC pain (P<0.05) after registration to the knee atlas.Conclusion
Correlation of knee cartilage volumes with WOMAC pain scores in subjects with knee osteoarthritis may be improved be registering images to a standard template. In this study a knee atlas was generated using existing knee cartilage segmentation, an increase the correlation between volume and knee pain by 90%, with significant increase in correlation for femoral and medial tibial cartilage.Acknowledgements
No acknowledgement found.References
1. Hunter DJ, Bierma-Zeinstra S. Osteoarthritis. Vol. 393, The Lancet. Lancet Publishing Group; 2019. p. 1745–59.
2. Hunter, David J., et al. "Evolution of semi-quantitative whole joint assessment of knee OA: MOAKS (MRI Osteoarthritis Knee Score)." Osteoarthritis and cartilage 19.8 (2011): 990-1002.
3. Peterfy, C. G., et al. "Whole-organ magnetic resonance imaging score (WORMS) of the knee in osteoarthritis." Osteoarthritis and cartilage 12.3 (2004): 177-190.
4. Baum, T., et al. "Cartilage and meniscal T2 relaxation time as non-invasive biomarker for knee osteoarthritis and cartilage repair procedures." Osteoarthritis and Cartilage 21.10 (2013): 1474-1484.
5. Bacon, Kathryn, et al. "Does cartilage loss cause pain in osteoarthritis and if so, how much?." Annals of the rheumatic diseases 79.8 (2020): 1105-1110.
6. Hunter, D. J., L. March, and P. N. Sambrook. "The association of cartilage volume with knee pain." Osteoarthritis and Cartilage 11.10 (2003): 725-729.
7. Arthofer C, Zedan Y, Tench C, Kurien T, Scammell B, Kerslake R, et al. Construction of an anatomical template of the knee and voxel-based knee pathology-pain mapping. Osteoarthritis Cartilage. 2021 Apr 1;29:S348–9.
8. Peake, Edward J., Tom D. Turmezei, and Dorothee P. Auer. "Topographical Associations of Knee Cartilage MRI with Osteoarthritis Pain: Data from the Osteoarthritis Initiative."
9. Peterfy, Charles G., Erika Schneider, and M. Nevitt. "The osteoarthritis initiative: report on the design rationale for the magnetic resonance imaging protocol for the knee." Osteoarthritis and cartilage 16.12 (2008): 1433-1441
10. Peake, Edward J., et al. "Ensemble learning for robust knee cartilage segmentation: data from the osteoarthritis initiative." BioRxiv (2020): 2020-09.
11. M.W. Woolrich, S. Jbabdi, B. Patenaude, M. Chappell, S. Makni, T. Behrens, C. Beckmann, M. Jenkinson, S.M. Smith. Bayesian analysis of neuroimaging data in FSL. NeuroImage, 45:S173-86, 2009
Figures
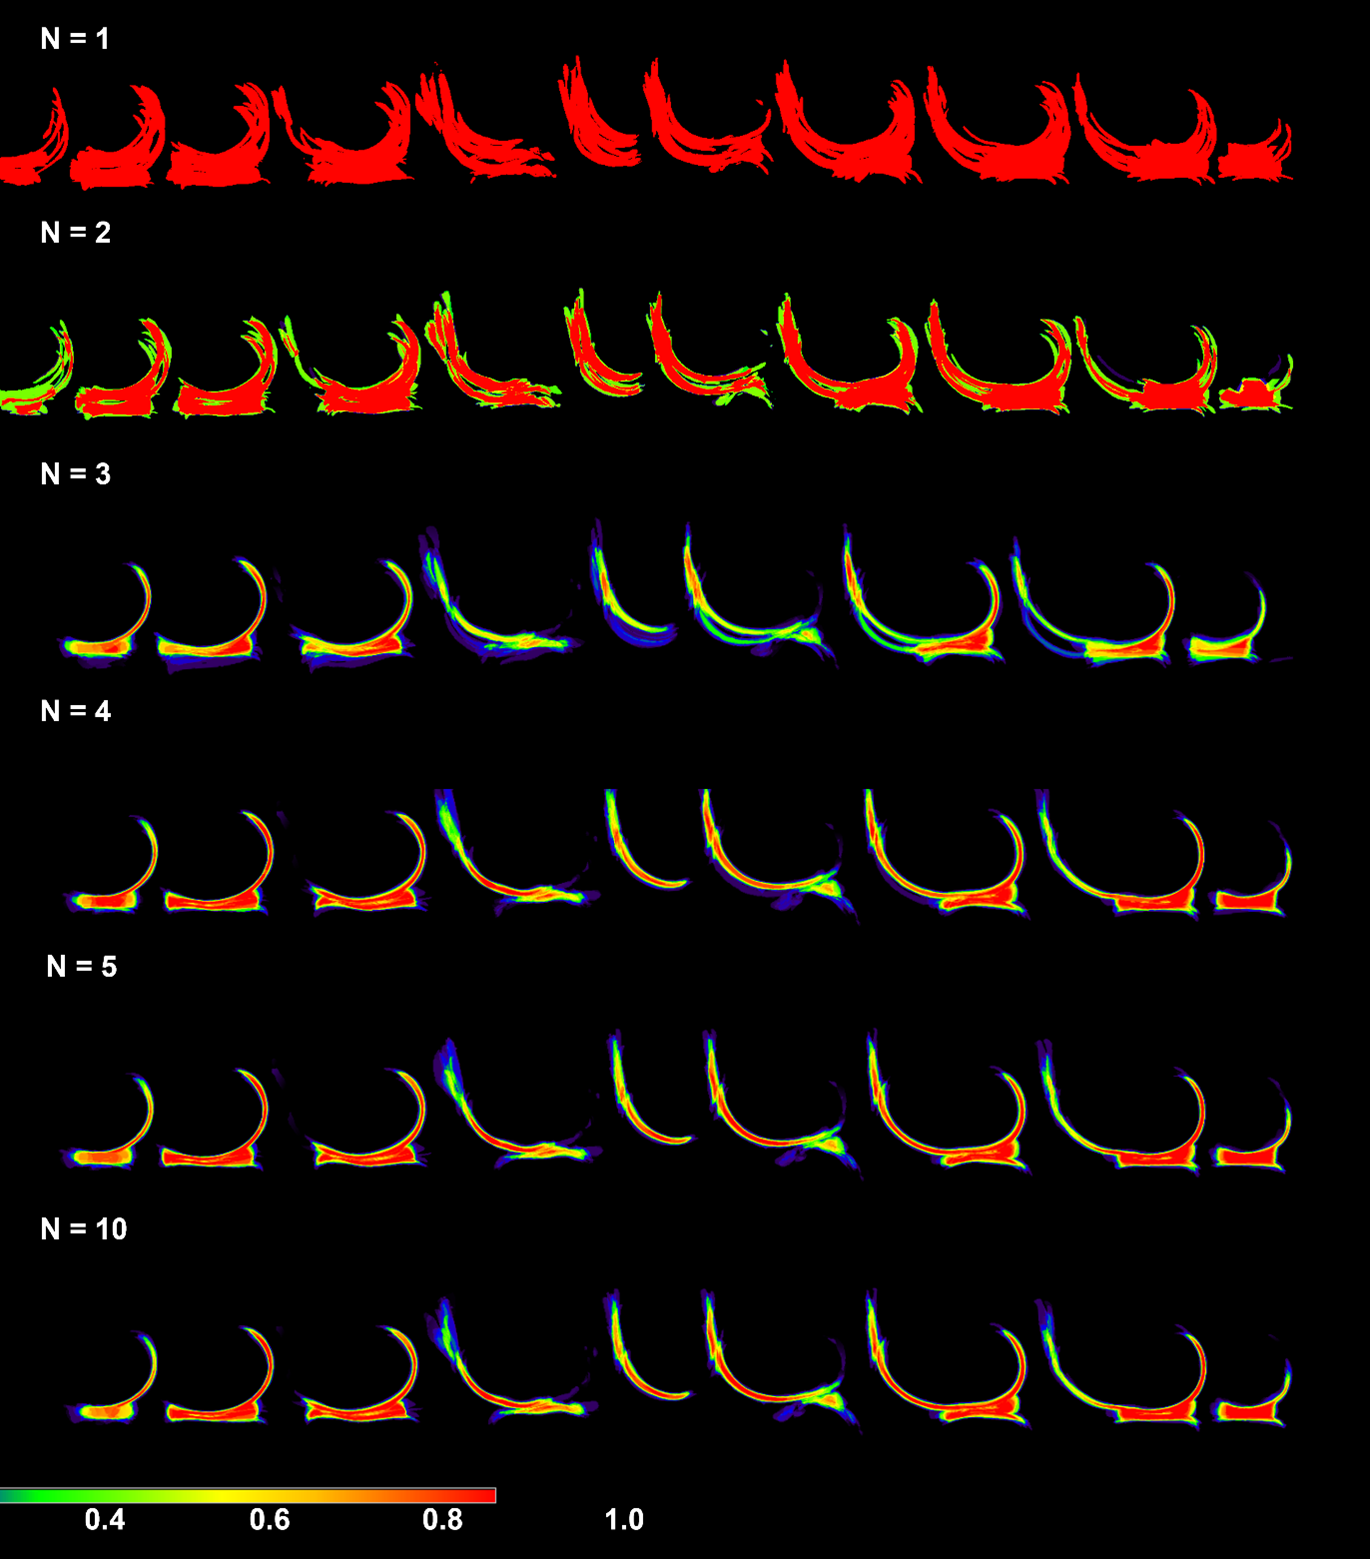
Figure 1: Sagittal view of knee atlas cartilage segmentation
Initially, the different cartilage segmentations cover a larger area, but as the segmentations align the average image resembles healthy knee cartilage. The Patella has the lowest average pixel intensity, suggesting it is the least well aligned target using affine registration.
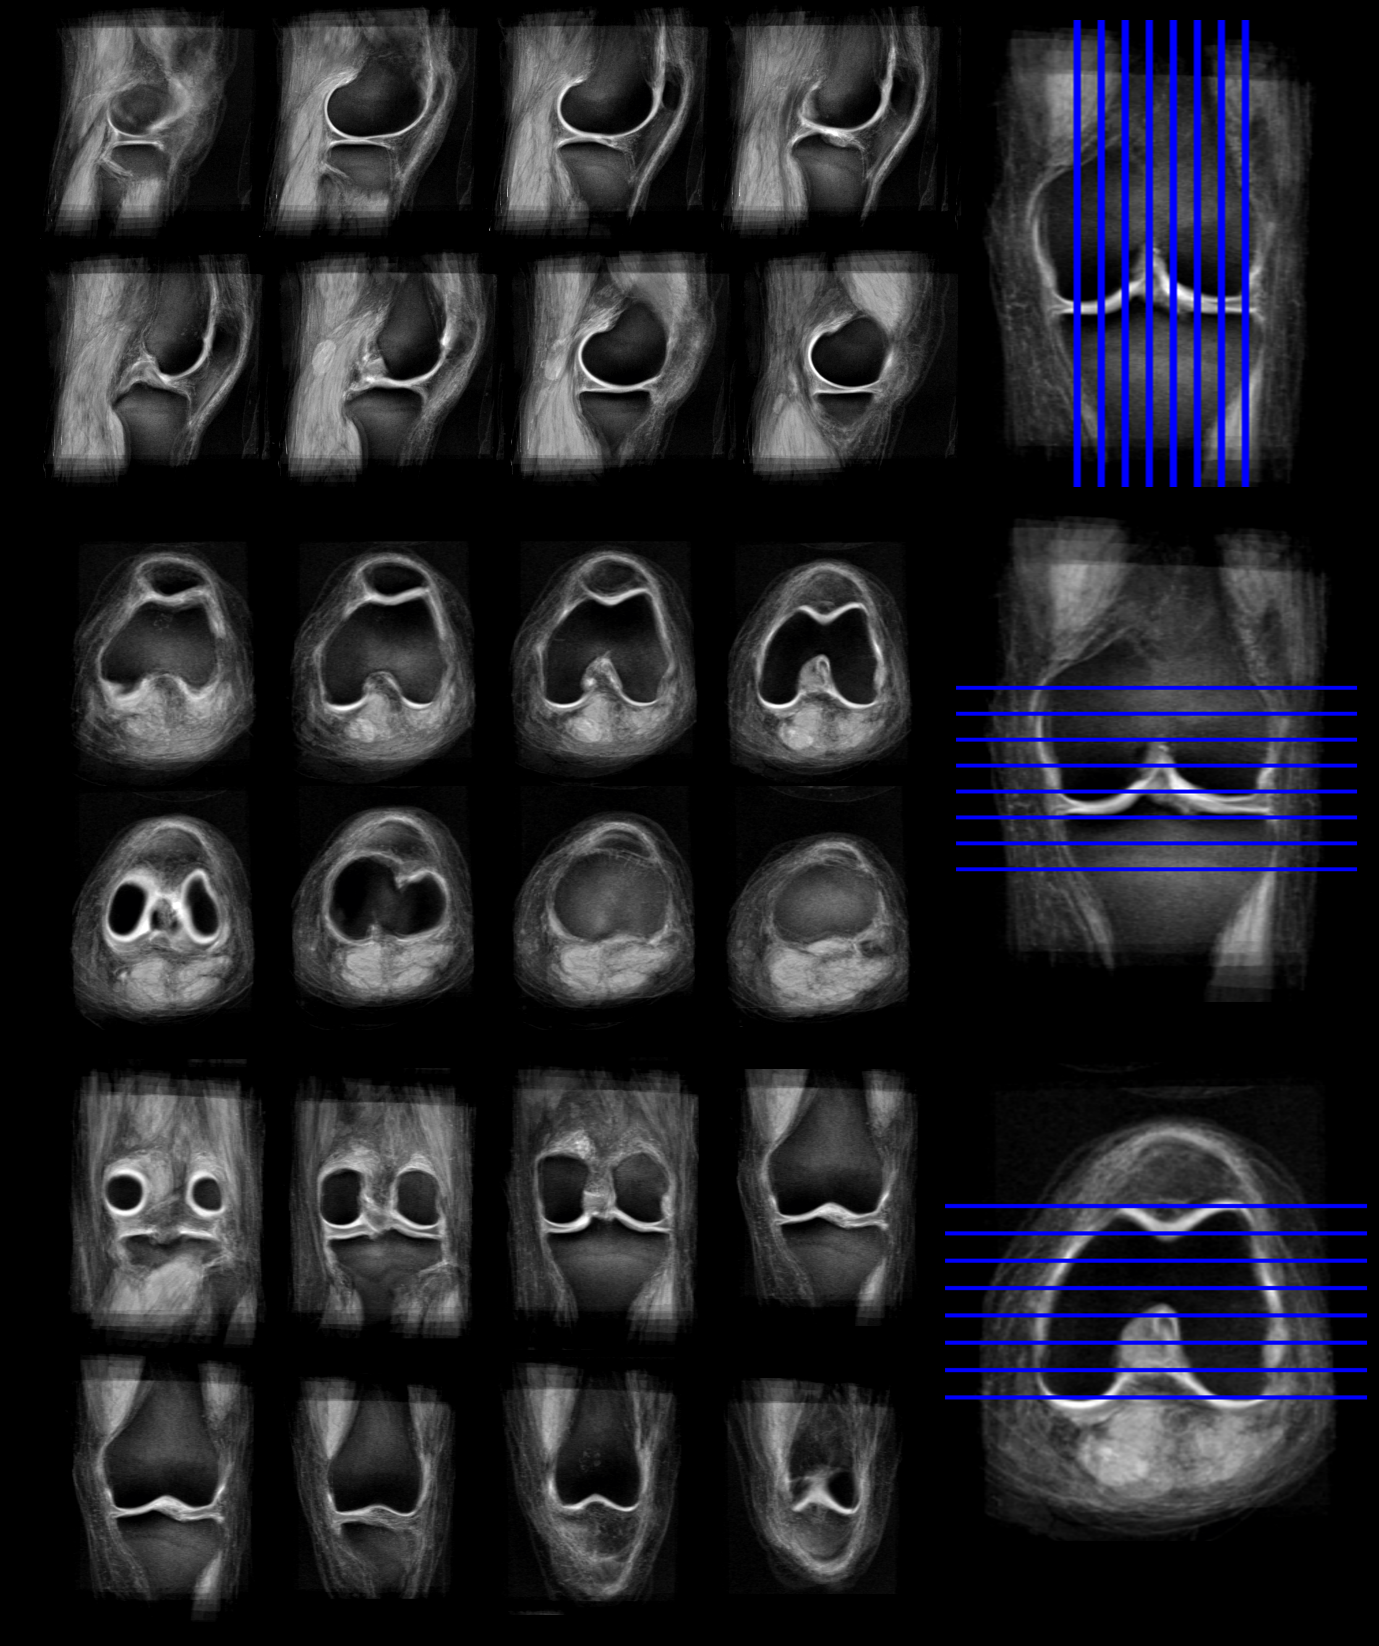
Figure 2: MRI knee atlas
Knee atlas generated using 10 participants from the incident cohort of the OAI. Cartilage segmentations were used to drive the affine registrations, with the images being registered using the final set of affine transforms. Tibiofemoral cartilage appears well defined, while cartilage at the patellofemoral joint is subject to more blurring.
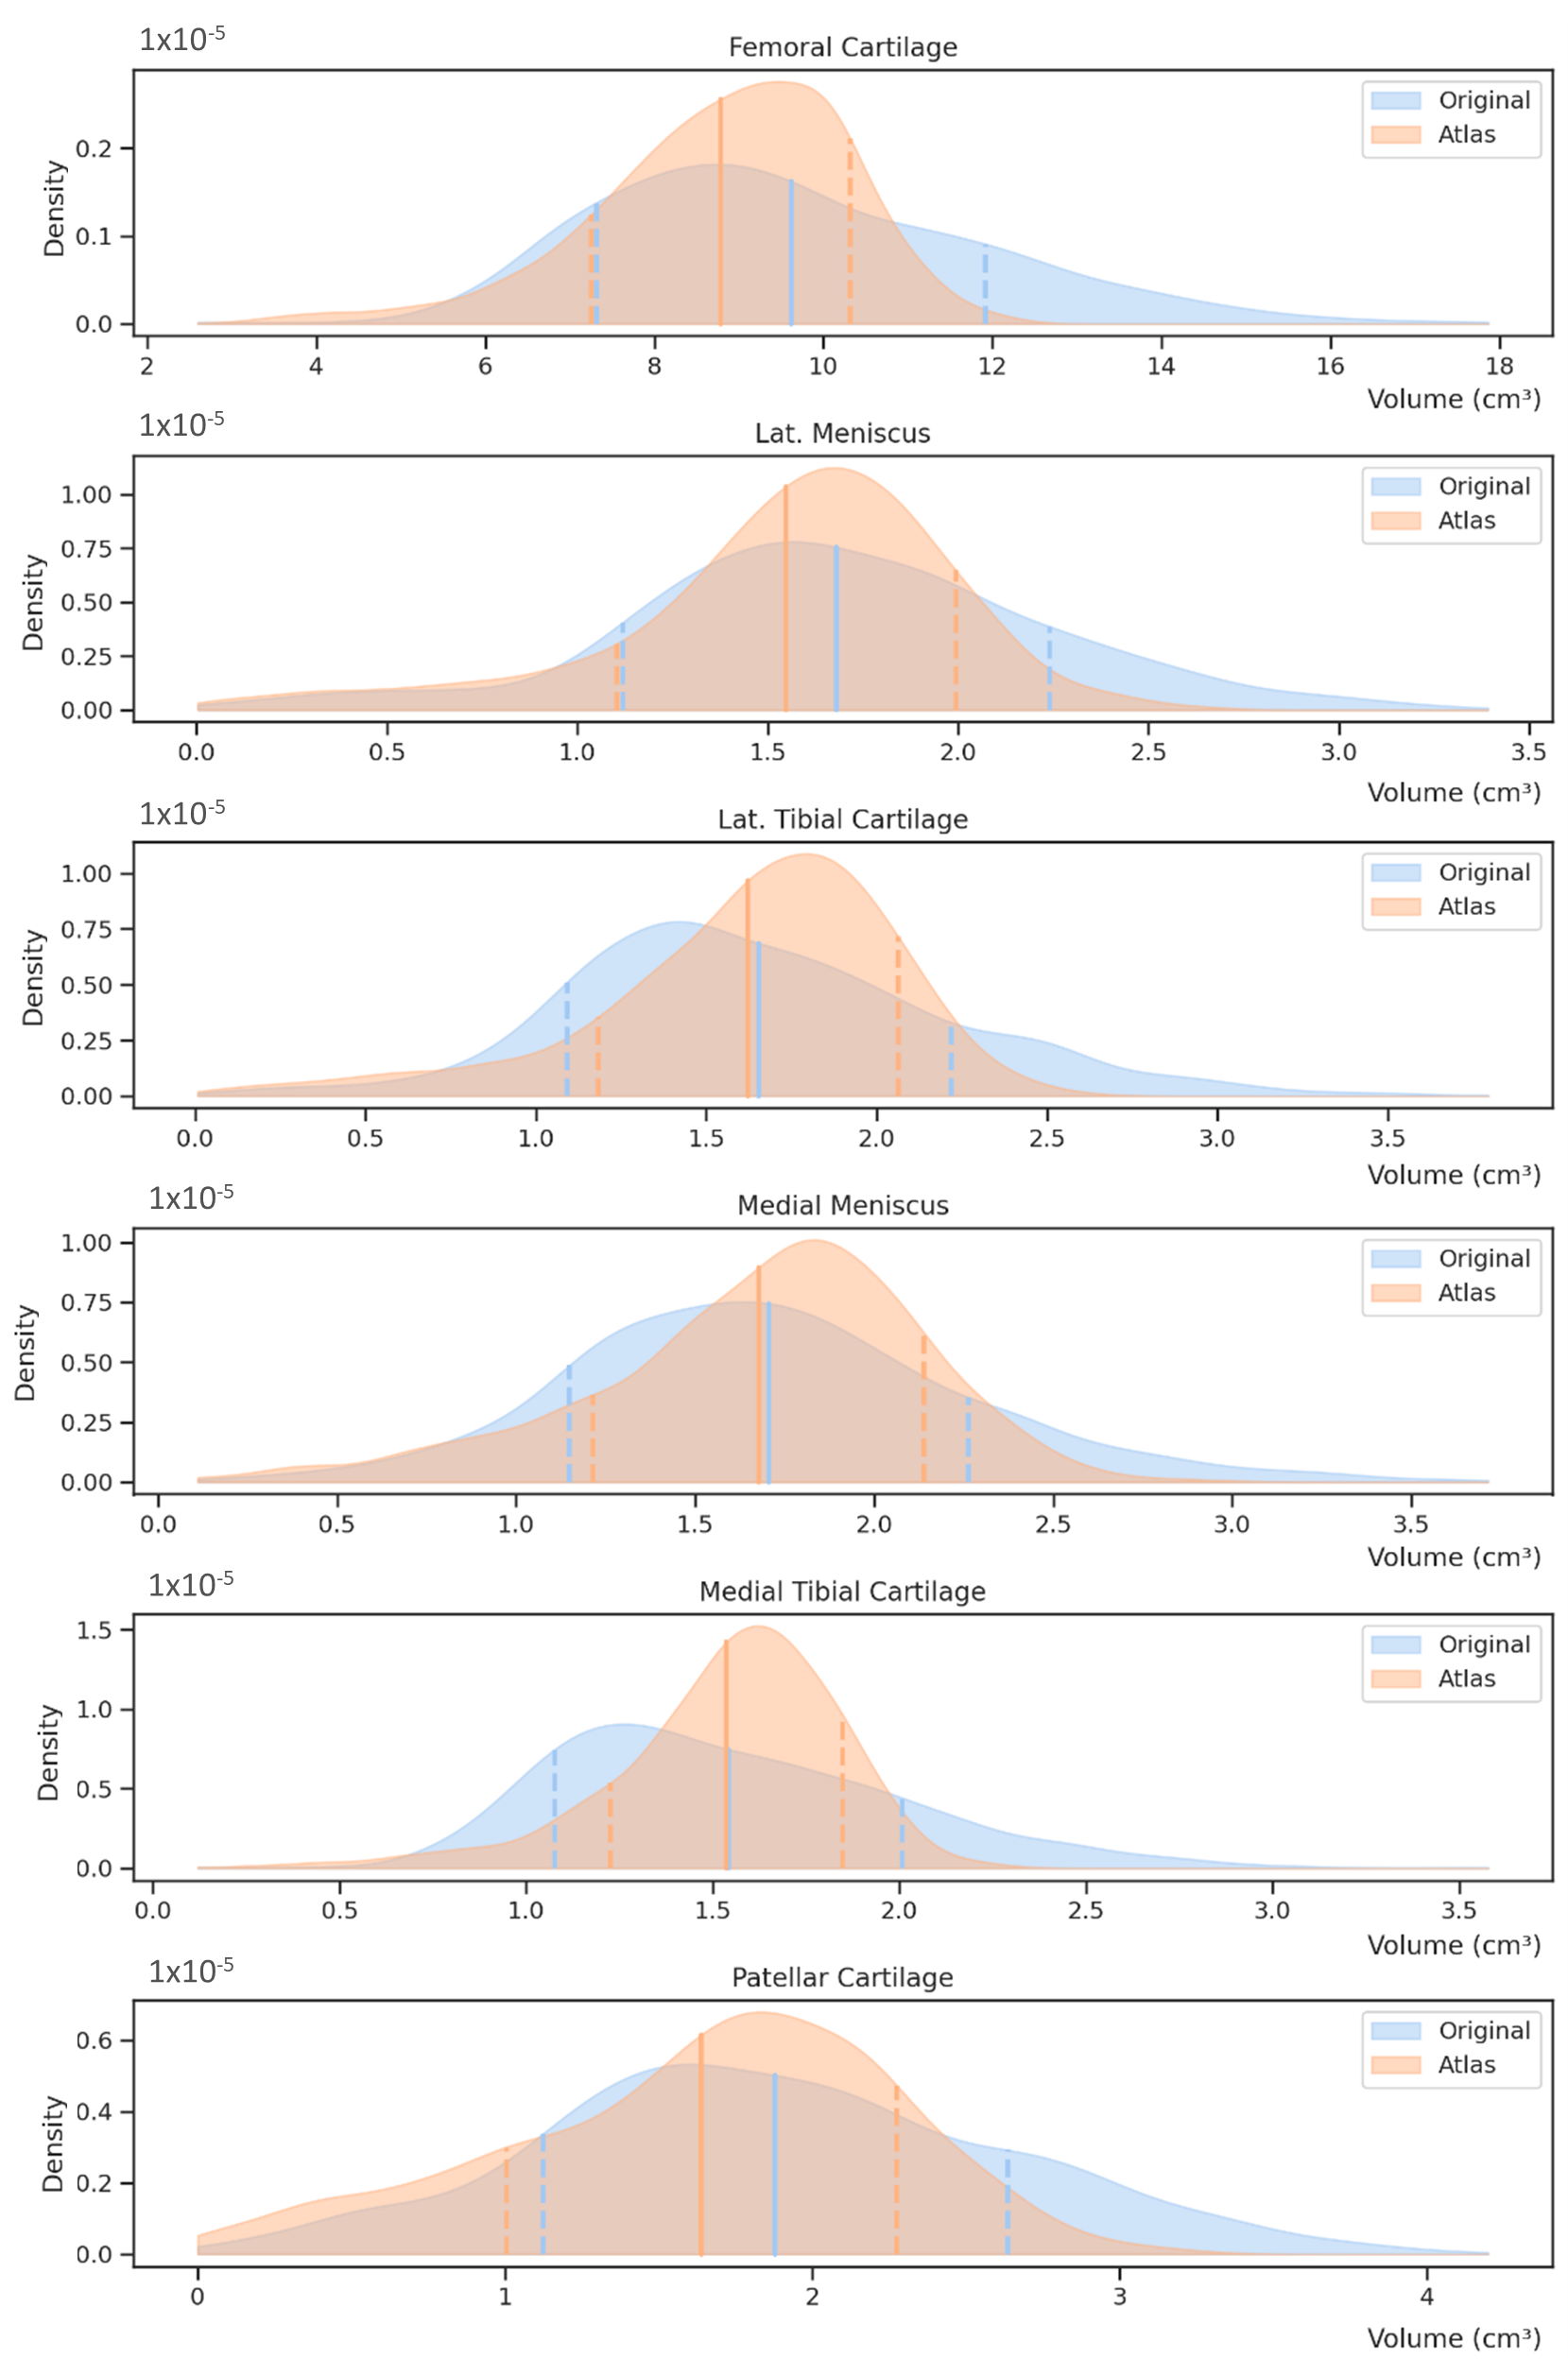
Figure 3: Segmented cartilage volumes
Kernel density estimate plots for cartilage volume for the original and Atlas-registered knee MRIs. Solid lines indicate mean cartilage volume, and dashed lines the 1 standard deviation range.
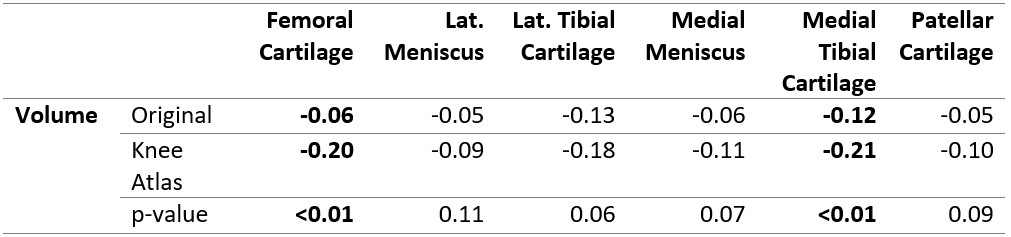
Table 1: Association between cartilage volume and WOMAC knee pain
Pearson’s correlation coefficient for cartilage volumes and 3D run length variance for native images and knee atlas registered images. Fishers z-to-r transform was used to compare the correlation coefficients (1-tailed). Cartilage labels with p<0.05 are shown in bold.