0517
Quantitative MRI of cartilage in ACL reconstructed patients using 3D ultrashort echo time T1 (UTE-T1) and magnetization transfer ratio (UTE-MTR)1University of California, San Diego, San Diego, CA, United States
Synopsis
Keywords: Cartilage, Quantitative Imaging
Motivation: Post traumatic osteoarthritis is a common complication of ACL injury. There is limited research on the early degenerative changes in cartilage of ACL injured knees.
Goal(s): To develop novel biomarkers for identifying early cartilage damage in ACL reconstructed knees.
Approach: We employed ultrashort echo time magnetization transfer ratio (UTE-MTR) and UTE-T1 sequence to study the knee articular cartilage in ACL reconstructed patients.
Results: UTE-T1 and UTE-MTR can be used as quantitative biomarkers for assessing cartilage damage. Reduced MTR and increased T1 values indicate cartilage damage which is otherwise not appreciated on morphological imaging.
Impact: UTE-T1 and UTE-MTR sequences can detect early cartilage damage, which could help us better understand the development of post-traumatic osteoarthritis.
Introduction
Anterior cruciate ligament(ACL) tears are one of the most common knee injuries that require surgical reconstruction.1 The development of post-traumatic osteoarthritis(PTOA) is well documented regardless of treatment, with several studies reporting increased rates of degenerative changes after ACL reconstruction.2,3,4 Magnetic resonance imaging is the ideal modality to assess cartilage degeneration due to its ability to non-invasively quantify the structural and biochemical changes associated with the onset and progression of osteoarthritis5. Articular cartilage of the knee consists of superficial and deep layers6. The cartilage matrix of the deeper layer has higher proteoglycan concentration, collagen fiber thickness, and less water. The deep calcified zone has been shown to be involved in the pathogenesis of OA.8,9 However, due to its short transverse relaxation time (T2), standard MRI sequences cannot quantify the relaxation times of the deep layers accurately. This study uses three-dimensional ultrashort echo time (3D UTE) magnetic resonance imaging (MRI) techniques to quantify and compare T1 and magnetization transfer ratio (MTR) of knee articular cartilage between healthy controls and ACL-reconstructed (ACLR) patients.Methods
26 ACLR patients (32.2 ±10.6 years old, 42 % male) and 23 age and sex-matched healthy controls (35.7 ±9.6 years old, 30% male) were scanned with 3D UTE Cones sequences, including T1 and MTR on a 3T clinical scanner (MR750, GE Healthcare) employing an 8 channel transmit/receive knee coil. UTE-based actual flip angle imaging (AFI: TE=0.032ms, TRs=20,100ms, FA=45°) was used to map B1 followed by variable flip angle (VFA: TE=0.032ms, TR=20ms, FAs=5°, 15°, 30°) to measure T1. MTR was measured using a 3D-UTE-Cones-MT sequence with and without MT preparation (MT power=1500°; frequency offset=2 and 50kHz; FA=7°; 11 spokes per MT preparation, slice thickness=3cm, field of view=15x15 cm, the total scan time = 8 min 12 secs. Regions of interest (ROIs) were placed on the femoral and tibial articular cartilages for the medial and lateral sides of each knee joint, as shown in Figure 1. All the cartilage subsegments were graded using Whole-Organ Magnetic Resonance Imaging Score (WORMS) and MRI Osteoarthritis Knee Score (MOAKS). UTE-T1 and UTE-MTR biomarkers were calculated for the patient and control groups and were compared using the Mann-Whitney-U test. P values <0.05 were considered significant.Results
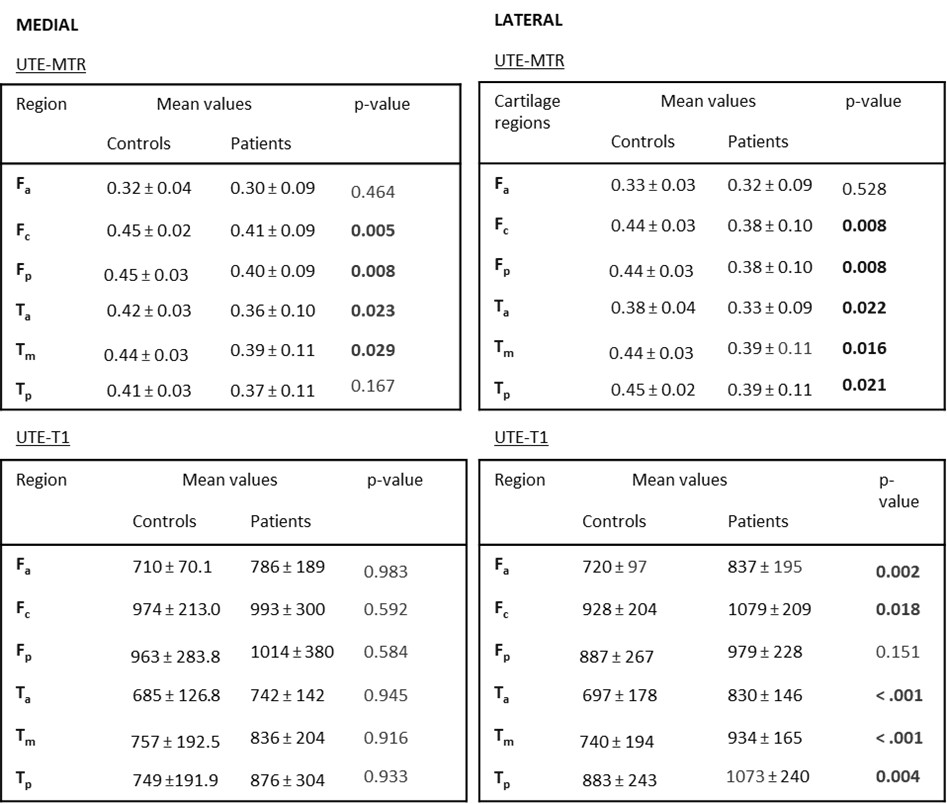
Table 1 summarizes the demographic characteristics of the patient and control knees. The subjects were age-, sex-, and BMI-matched to minimize confounding factors.Table 2 shows the mean and standard deviation of UTE-T1 and UTE-MTR, and their statistical significance. Patients have a lower UTE-MTR compared to healthy controls, and the results are significant for all segments except the anterior femur and posteromedial tibia. UTE-T1 relaxation values are higher in patients, and the differences are significant for the lateral cartilage segments. There were no significant differences between the medial and lateral cartilage segments.
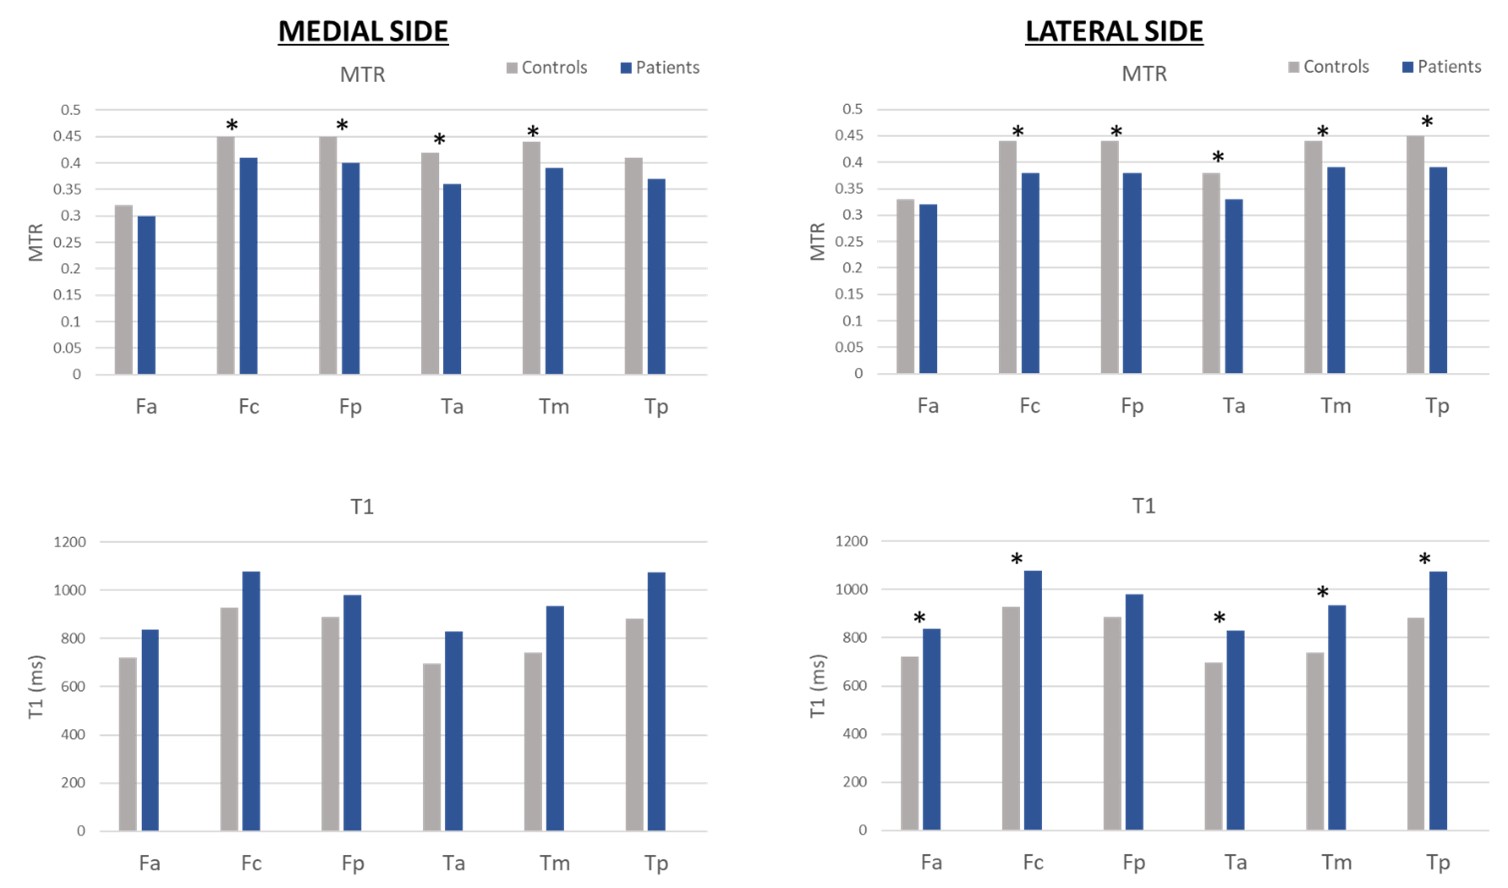
Figure 2 shows a graphical representation of the UTE-T1 and UTE-MTR values of the controls and ACLR patients.
Discussion and Conclusion
Multiple quantitative MRI techniques have been developed to detect changes in the cartilage matrix in early stages of OA. T2*, T1, T1rho and MT are few quantitative biomarkers used to monitor OA progression.8 Quantitative biomarkers like T2* and T1rho exhibit a notable susceptibility to the magic angle effect, which is a potential drawback in imaging curved surfaces like knee joint.8,9,10 MT and T1 are relatively insensitive to the magic angle effect. Combining these sequences with UTE, we are able to estimate the relaxation times of the entire cartilage including the deep layers. Our results are in agreement with other studies showing higher T2 and T1rho values in ACLR group as compared to control group11,12. MTR is a measure of magnetization exchange between macromolecular protons and surrounding free protons, and is indicative of macromolecular content in the tissue. Our results suggest degenerative and inflammatory processes lead to decreased UTE-MTR and increased UTE-T1 relaxation times of articular cartilage in ACLR patients. These biomarkers were able to detect early cartilage changes and could help us better understand the pathology and potentially diagnose patients at increased risk of PTOA.Acknowledgements
The authors acknowledge grant support from the National Institutes of Health (R01AR062581).References
1. Beynnon BD, Johnson RJ, Abate JA, Fleming BC, Nichols CE. Treatment of anterior cruciate ligament injuries, part I. Am J Sports Med. 2005;33(10):1579-1602. doi:10.1177/0363546505279913
2. Kannus P, Järvinen M. Conservatively treated tears of the anterior cruciate ligament. Long-term results. J Bone Joint Surg Am. 1987;69(7):1007-1012.
3. Paschos NK. Anterior cruciate ligament reconstruction and knee osteoarthritis. World J Orthop. 2017;8(3):212-217. Published 2017 Mar 18. doi:10.5312/wjo.v8.i3.212
4. Fithian DC, Paxton EW, Stone ML, et al. Prospective trial of a treatment algorithm for the management of the anterior cruciate ligament-injured knee. Am J Sports Med. 2005;33(3):335-346. doi:10.1177/0363546504269590
5. Kaneko Y, Nozaki T, Yu H, et al. Normal T2 map profile of the entire femoral cartilage using an angle/layer-dependent approach. J Magn Reson Imaging. 2015;42(6):1507-1516. doi:10.1002/jmri.24936 6. Lombardi AF, Guma M, Chung CB, Chang EY, Du J, Ma YJ. Ultrashort echo time magnetic resonance imaging of the osteochondral junction. NMR Biomed. 2023;36(2):e4843. doi:10.1002/nbm.4843 7. Goldring SR, Goldring MB. Changes in the osteochondral unit during osteoarthritis: structure, function and cartilage-bone crosstalk. Nat Rev Rheumatol. 2016;12(11):632-644. doi:10.1038/nrrheum.2016.148
8. Eck BL, Yang M, Elias JJ, et al. Quantitative MRI for Evaluation of Musculoskeletal Disease: Cartilage and Muscle Composition, Joint Inflammation, and Biomechanics in Osteoarthritis. Invest Radiol. 2023;58(1):60-75. doi:10.1097/RLI.0000000000000909
9. Shao H, Pauli C, Li S, et al. Magic angle effect plays a major role in both T1rho and T2 relaxation in articular cartilage. Osteoarthritis Cartilage. 2017;25(12):2022-2030. doi:10.1016/j.joca.2017.01.013
10. Wu M, Ma Y, Wan L, et al. Magic angle effect on adiabatic T1ρ imaging of the Achilles tendon using 3D ultrashort echo time cones trajectory. NMR Biomed. 2020;33(8):e4322. doi:10.1002/nbm.4322
11. Li H, Tao H, Hua Y, Chen J, Li Y, Chen S. Quantitative magnetic resonance imaging assessment of cartilage status: a comparison between young men with and without anterior cruciate ligament reconstruction. Arthroscopy. 2013;29(12):2012-2019. doi:10.1016/j.arthro.2013.09.075
12. Xie D, Murray J, Lartey R, et al. Multi-vendor multi-site quantitative MRI analysis of cartilage degeneration 10 Years after anterior cruciate ligament reconstruction: MOON-MRI protocol and preliminary results. Osteoarthritis Cartilage. 2022;30(12):1647-1657. doi:10.1016/j.joca.2022.08.006
Figures
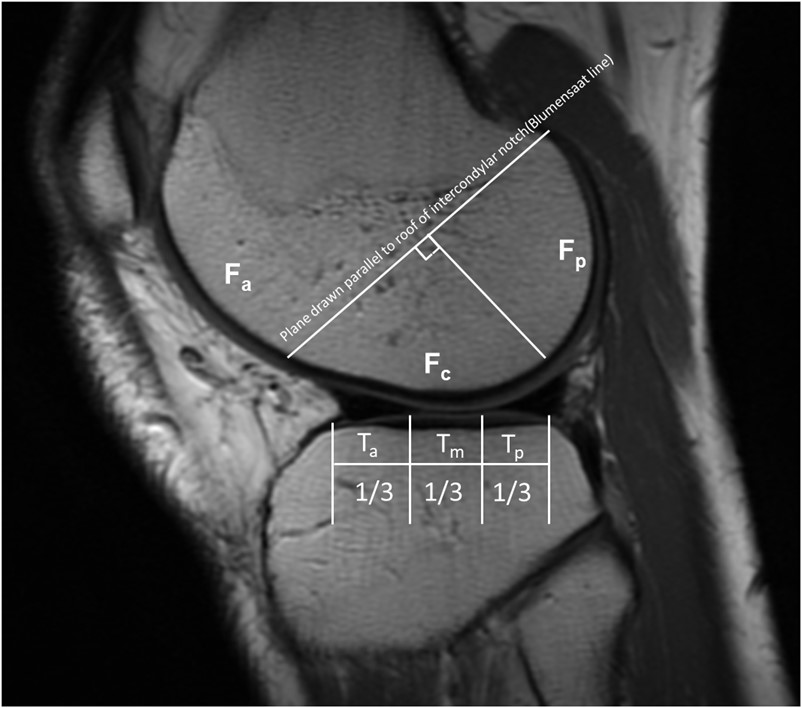
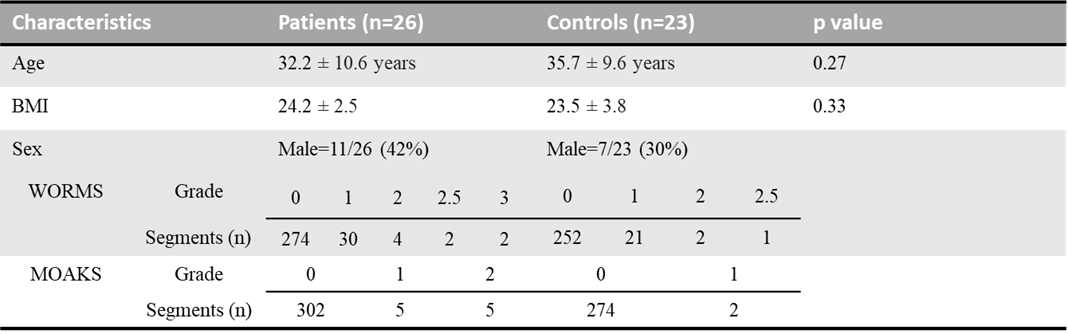
Table 1. Subject characteristics.