0515
Longitudinal assessment of autologous knee chondrocyte implantation using DL T2 Mapping and DOSMA framework
1GE HealthCare, Munich, Germany, 2LAIMBIO, Rey Juan Carlos University, Madrid, Spain, 3GE HealthCare, New York, NY, United States, 4GE HealthCare, San Ramon, CA, United States, 5Department of Radiology and Biomedical Imaging, University of California, San Francisco (UCSF), San Francisco, CA, United States, 6Radiology, Stanford University, Stanford, CA, United States, 7Clinica CEMTRO, Madrid, Spain
Synopsis
Keywords: Cartilage, Quantitative Imaging
Motivation: Clinical adoption of quantitative MRI for cartilage repair monitoring is hindered by a lack of standardization in acquisition and tedious image analysis.
Goal(s): Our goal was to longitudinally assess high-density autologous chondrocyte implantation (HD-ACI) in the knee using a fast and robust DL T2 mapping technique, correlating with clinical outcome.
Approach: 15 HD-ACI patients (treated in femoral/patellar compartments) were longitudinally imaged and processed with a semi-automated pipeline, enabling a standardized regional analysis at a layer level.
Results: DL T2 map reflected longitudinal significant changes in deep layer. Significant T2 decrease in femoral HD-ACI within the first follow-up year, correlated with good clinical progression.
Impact: The demonstrated feasibility of DL T2 mapping coupled with a semi-automatic analysis to monitor changes after HD-ACI repair, allows for further investigation of the underlying biology of quantitative findings; advancing its adoption as cartilage healing biomarker in the clinical setting.
Introduction
Second-look arthroscopy provides limited1 direct visualization of cartilage repaired tissue (RT) with potential morbidities2. T2 mapping, the only commercially-available quantitative magnetic resonance imaging technique, offers non-invasive evaluation of water and collagen content/orientation3, being valuable for assessing morphological changes in RT4,5,6,7.A novel deep learning (DL)-reconstructed T2 mapping technique was proposed to shorten acquisition times while providing robust quantitative information8,9. Automated segmentation and post-processing algorithms may help standardize the time-consuming manual T2 map analysis.
The purpose of this work is to longitudinally evaluate high-density autologous chondrocyte implantation (HD-ACI) using DL T2 mapping and a semi-automatic analysis pipeline, correlating the image findings with clinical outcomes.
Data acquisition methods
Under an IRB-approved study, 15 patients (4 females, 11 males; 35.33±9.41 years; [16-50 years]) who underwent a HD-ACI10 in the knee were enrolled in this study.Patients were imaged on a 3T SIGNA™ Architect (GE HealthCare, Waukesha, WI, USA) scanner with a 18-Ch Tx/Rx knee coil at least in two follow-up timepoints (TPs), grouped in: 3-6months, initial defect filling; 6-12months, early healing; 12-24months, advanced maturation11. Adding to the routine knee clinical protocol: Fat-suppressed 3D FSE CUBE sequence (TE/TR=60/1500ms, FOV=16cm, 0.31x0.31x0.6mm, sagittal view, tacq=5min), input for DL Segmentation tool12, and a multi-echo FSE sequence (CartiGram (GE HealthCare, Waukesha, WI, USA),ARC=3, DL reconstruction8, TE/TR=6.8-54.4(ẟTE=6.8)/1200ms, FOV=16cm, 0.31x0.31x3mm, sagittal/axial view depending on HD-ACI location, tacq=3min(no-phase-wrap factor=1.6)), from which T2 maps were mono-exponentially fitted.
To assess symptoms and function, all the patients completed the International Knee Documentation Committee (IKDC) evaluation form13 at each visit.
Data analysis methods
A recently developed Python-based pipeline using the Deep Open-Source Medical Analysis (DOSMA) framework9,14 was employed for femoral condyles and extended to the patellar compartment. Isotropic 3D CUBE volume and patellar mask12 were reformatted to axial plane before registration. By fusing mask over DL Cartigram, registration parameters were refined. All cases were independently processed at each timepoint, obtaining cropped and unrolled15 T2maps and regional analyses for both medial and lateral sides (deep, superficial, and total layers).To assess RT, region(s) that best covered the HD-ACI were selected, while remaining surrounding region(s) within the same compartment served as control3,16.
A clinically meaningful change of at least 9.8 for IKDC17 between TPs was used as the threshold for categorizing patients into "good progression" or "poor progression”.
Paired t-test was computed between control regions and RT layers within each TP. For the longitudinal assessment, to avoid differences in compartments (femoral condyles vs. patella), paired ratio t-test was used to compare T2 values between TPs at each layer. Spearman correlation coefficients were computed for T2 and IKDC values at each TP (GraphPad Prism version 9).
Results
12 patients received HD-ACI treatment in their femoral condyles and 3 in the patella. Some had more than one lesion that were treated independently (Figure 1), resulting in 24 RT (Table 1). Patellar implantations had a central location involving lateral/medial sides, so we could not separate control from RT regions (Figure 2).Paired t-test between control and femoral RT regions was significant for superficial and total layers at TP1 (p<0.05) (Table 2). Paired ratio t-tests showed T2 values significantly decreased for all layers at TP2-TP1 (p<<0.05), and for deep and total layers between TP3-TP2 (p<0.05). According to accepted progression criteria benchmark3, a measured increase/decrease in T2 ≥14% indicates a minimum detectable change (Figure 3).
There was a moderate correlation between a decrease in T2 and an increase in IKDC at TP2 for deep, superficial, and total femoral layers (r=-0.6696, -0.5690, -0.6241 respectively; p<0.05).
Discussion
Reported T2 values align with previously published values5,19. Among “good progression” cases, there was a consistent decrease in T2 values between all TPs and layers, with significant femoral reductions at TP2-TP1 (>14% decrease). “Poor progression” femoral cases showed some significant increases in T2 between TP3-TP2 (>14% increase), whereas “poor” patellar cases exhibited significant decreases.While more robust and efficient than manual delineation5,18, automatic regional assessment limited patellar assessment dividing into lateral/medial sides and not properly representing the RT region.
Deep layer showed more significant changes for both compartments at all TPs, suggesting it may play a key role in cartilage maturation following HD-ACI.
To better understand the source of observed compositional variation, T2* and T1rho mapping could provide additional information on deep layer and proteoglycans content respectively3,19.
Conclusion
Our findings demonstrate significant T2 decrease in femoral HD-ACI within the first follow-up year, correlated with good clinical progression.Further validation and a more comprehensive assessment of patellar HD-ACI healing require larger study cohorts, longer study durations, and more clinical data.
The proposed semi-automatic workflow advances DL T2 mapping as a cartilage healing biomarker in the clinical setting.
Acknowledgements
No acknowledgement found.References
1. Autologous chondrocyte implantation in knee joint: MR imaging and histologic features at 1-year follow-up.Radiology. 2005; 234: 501-508
2. Peterson L, Minas T, Brittberg M, Nilsson A, Sjogren-Jansson E, Lindahl A. Two-to-9-year outcome after autologous chondrocyte transplantation of the knee. Clin Orthop Relat Res 2000; 374:212–34
3. Chalian M, Li X, Guermazi A et al. The QIBA Profile for MRI-based Compositional Imaging of Knee Cartilage. Radiology. 2021;301(2):423-432.
4. Theologis AA, Schairer WW, Carballido-Gamio J, Majumdar S, Li X, Ma CB. Longitudinal analysis of T1r and T2 quantitative MRI of knee cartilage laminar organization following microfracture surgery. Knee 2012;19(5): 652–657.
5. Welsch GH, Mamisch TC, Domayer SE, et al. Cartilage T2 assessment at 3-T MR imaging: in vivo differentiation of normal hyaline cartilage from reparative tissue after two cartilage repair procedures--initial experience. Radiology 2008;247(1):154–161.
6. Holtzman DJ, Theologis AA, Carballido-Gamio J, Majumdar S, Li X, Benjamin C. T(1r) and T(2) quantitative magnetic resonance imaging analysis of cartilage regeneration following microfracture and mosaicplasty cartilage resurfacing procedures. J Magn Reson Imaging 2010;32(4):914–923.
7. Trattnig S, Ba-Ssalamah A, Pinker K, Plank C, Vecsei V, Marlovits S. Matrix-based autologous chondrocyte implantation for cartilage repair: noninvasive monitoring by high-resolution magnetic resonance imaging. Magn Reson Imaging. 2005 Sep;23(7):779-87.
8. Carretero, L., Fung, M. et al. Quantitative & qualitative evaluation of accelerated T2 mapping technique using Deep Learning reconstruction in knee cartilage. ISMRM 31st Annual Meeting & Exhibition, London, England, May 2022. Abstract 6990.
9. Carretero, L., Fung, M. et al. Evaluation of an accelerated Deep Learning-reconstructed T2 mapping technique through knee cartilage regional analysis using DOSMA framework. ISMRM 32nd Annual Meeting & Exhibition, Toronto, Canada, June 2023. Abstract 627.
10. Guillén-García, P. et al. (2023) ‘Cartilage defect treatment using high-density autologous chondrocyte implantation (HD-ACI)’, Bioengineering, 10(9), p. 1083. doi:10.3390/bioengineering10091083.
11. Trattnig S, Millington SA, Szomolanyi P, Marlovits S. MR imaging of osteochondral grafts and autologous chondrocyte implantation. Eur Radiol 2007;17(1):103–118.
12. Astuto, B., Flament, I., K Namiri, N., Shah, R., Bharadwaj, U., M Link, T., D Bucknor, M., Pedoia, V., & Majumdar, S. Automatic Deep Learning-assisted Detection and Grading of Abnormalities in Knee MRI Studies. Radiology. Artificial intelligence, 2021; 3(3), e200165.
13. Irrgang JJ, Anderson AF, Boland AL, et al. Development and validation of the international knee documentation committee subjective knee form. Am J Sports Med 2001; 29:600–13.
14. Desai Arjun, Barbieri Marco, Mazzoli Valentina, Rubin Elka, Black Marianne, Watkins Lauren, Gold Garry, Hargreaves Brian, Chaudhari Akshay, DOSMA: A deep-learning,open-source framework for musculoskeletal MRI analysis, in: ISMRM 27th Annual Meeting and Exibition, Montreal, Canada, May 2019. Abstract 1135
15. Monu UD, Jordan CD, Samuelson BL, Hargreaves BA, Gold GE, McWalter EJ. Cluster analysis of quantitative MRI T and T ρ re axation times o carti age identi ies di erences between hea thy and AC -injured individuals at 3T." Osteoarthritis and cartilage 2017;25(4):513-520.
16. Kretzschmar M, Nevitt MC, Schwaiger BJ, Joseph GB, McCulloch CE, Link TM. Spatial distribution and temporal progression of T2 relaxation time values in knee cartilage prior to the onset of cartilage lesions - data from the Osteoarthritis Initiative (OAI). Osteoarthritis Cartilage. 2019;27(5):737
17. Ogura T, Ackermann J, Mestriner A, Merkely G, Gomoll A. The minimal clinically important difference and substantial clinical benefit in the patient-reported outcome measures of patients undergoing osteochondral allograft transplantation in the knee. Cartilage. 2021;12(1):42-50.
18. Banitalebi, H. et al. (2021) ‘Is T2 mapping reliable in evaluation of native and repair cartilage tissue of the knee?’, Journal of Experimental Orthopaedics, 8(1).
19. Welsch, G.H. et al. (2009) ‘T2 and T2* mapping in patients after matrix-associated autologous chondrocyte transplantation: Initial results on clinical use with 3.0-tesla MRI’, European Radiology, 20(6), pp. 1515–1523.
Figures
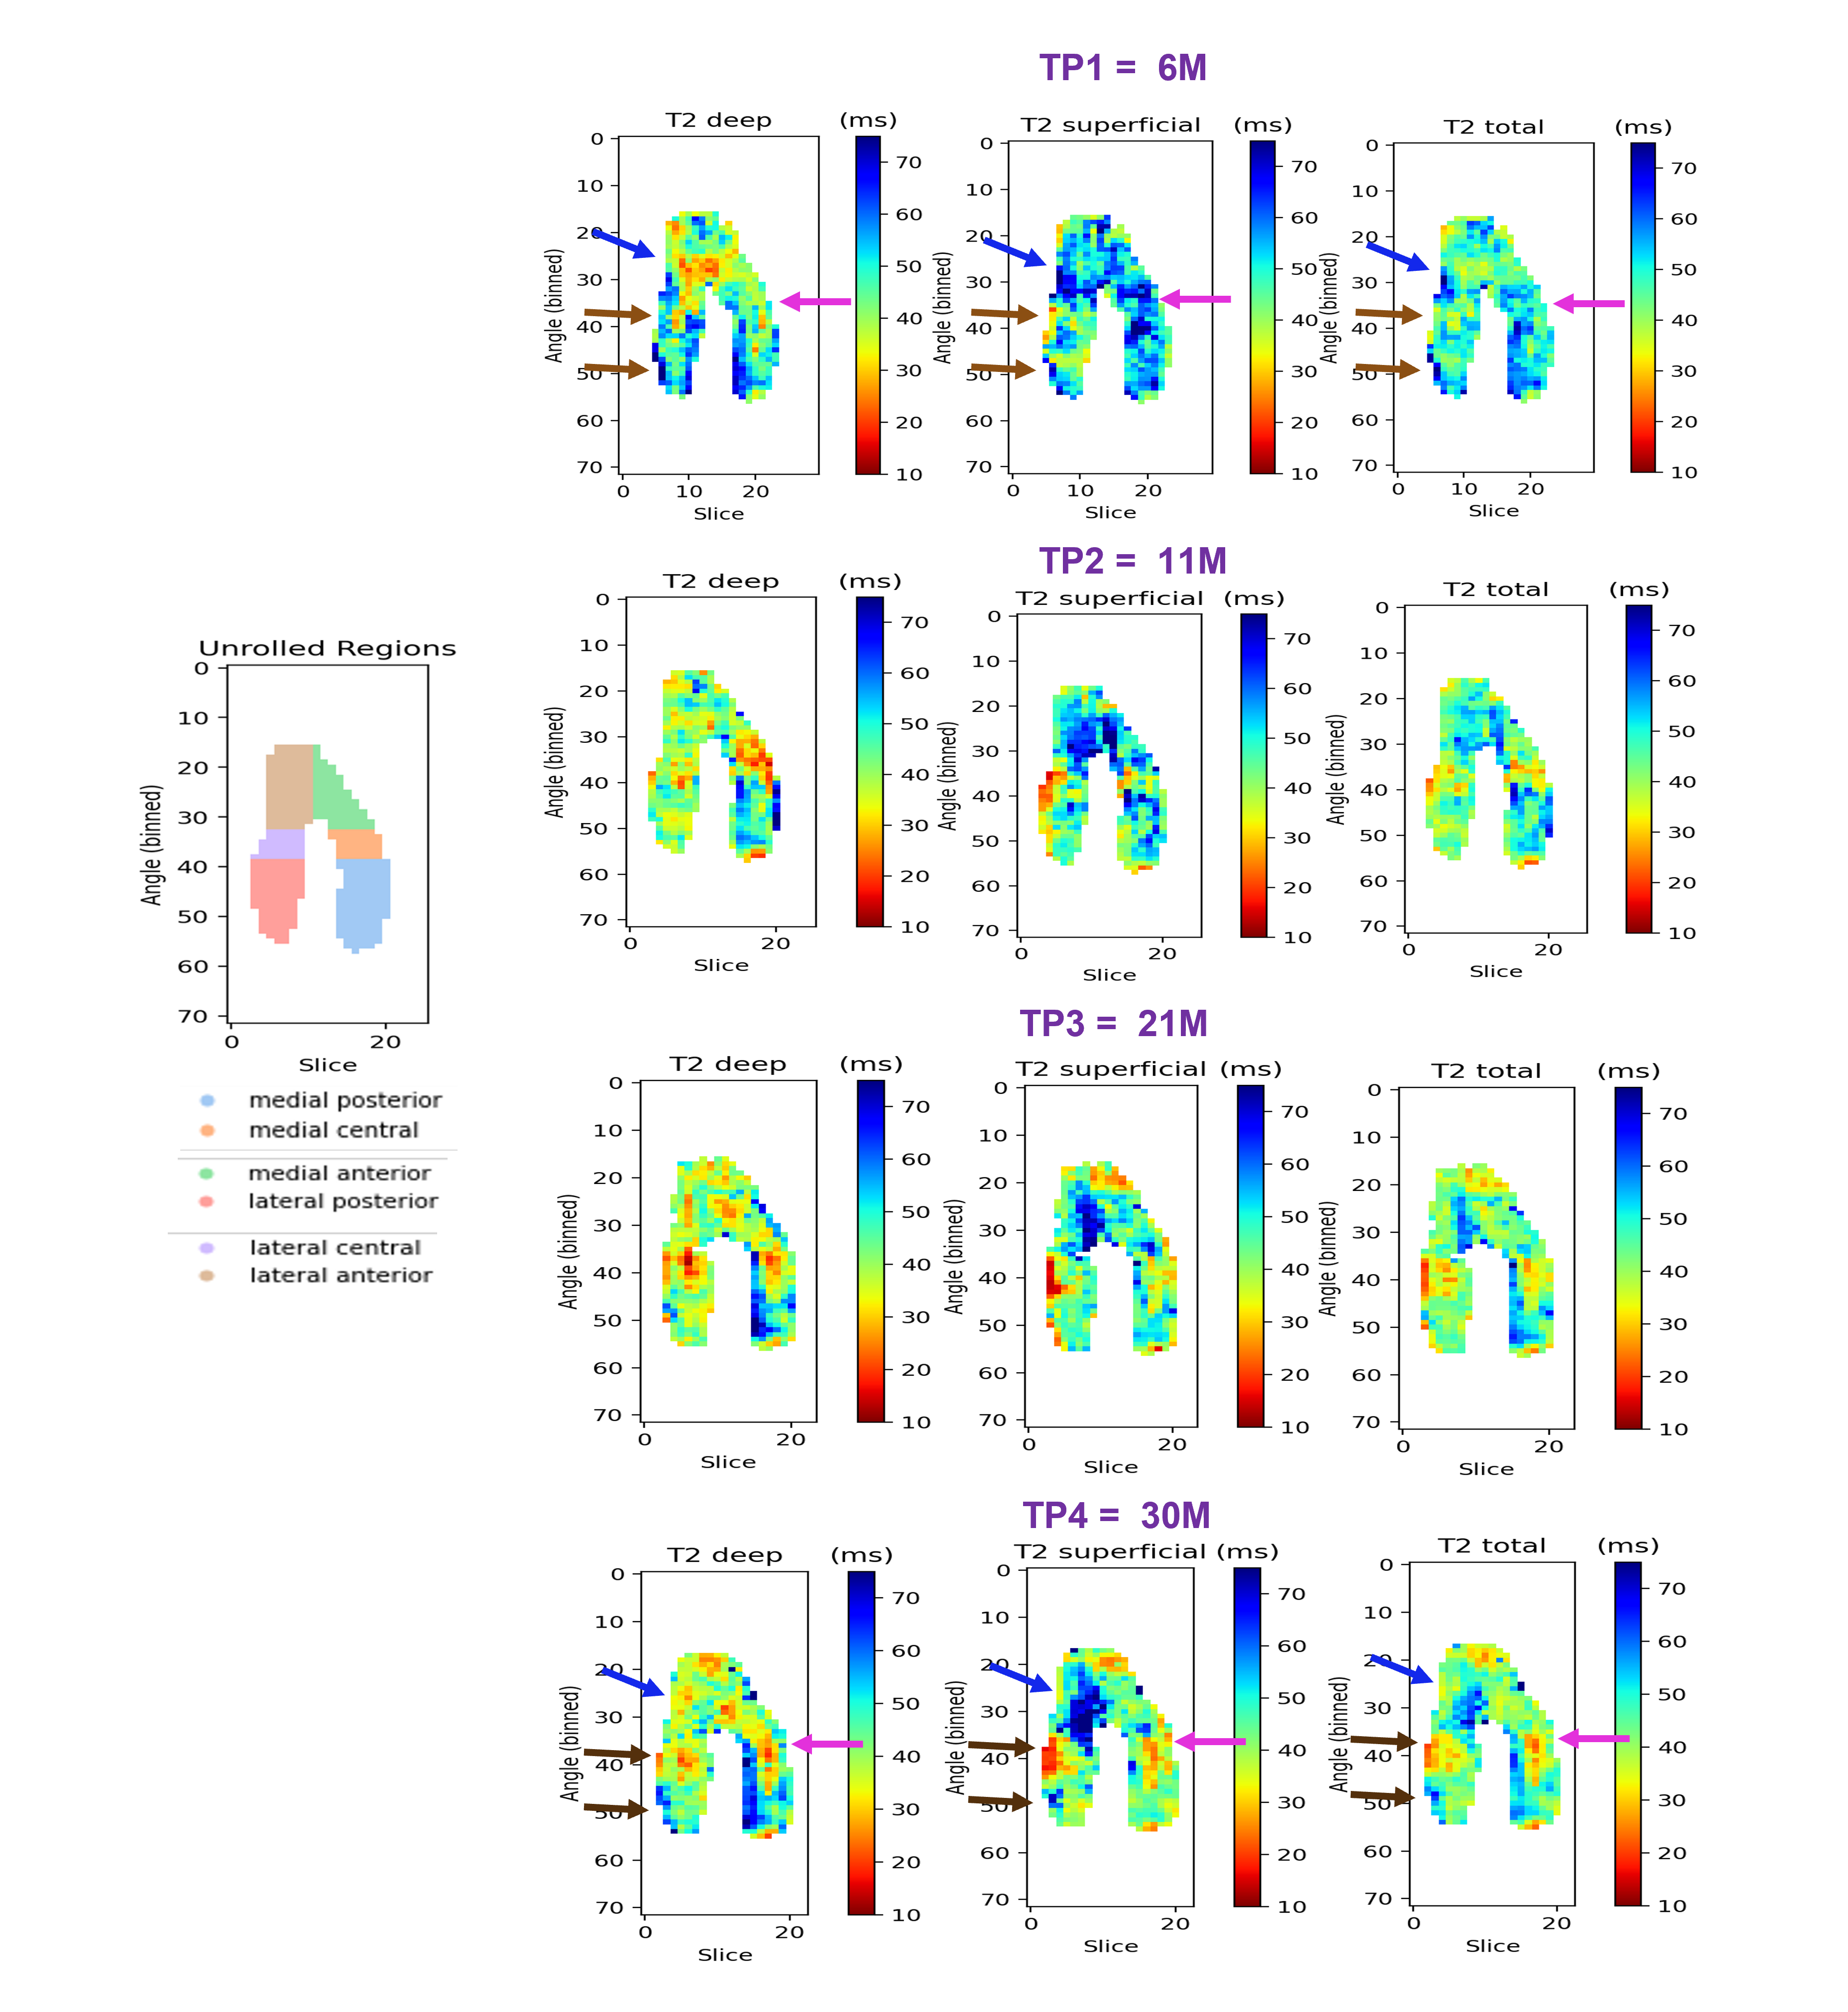
Figure 1. Example of unrolled femoral T2maps obtained with the pipeline for patient 15 at each of their 4 TPs, for each of the layers. As an example, unrolled regions map (left column) shows how the regions are automatically divided and labelled in TP2. This patient was treated with different HD-ACI highlighted with arrows in the first and last rows (TP1, TP4) in MFC (pink), LFC (brown) and trochlea (blue). Thanks to this view we can have a better understanding of the RT progression at each TP, as well as check the “healthy” surrounding cartilage and spot additional lesions that may appear.
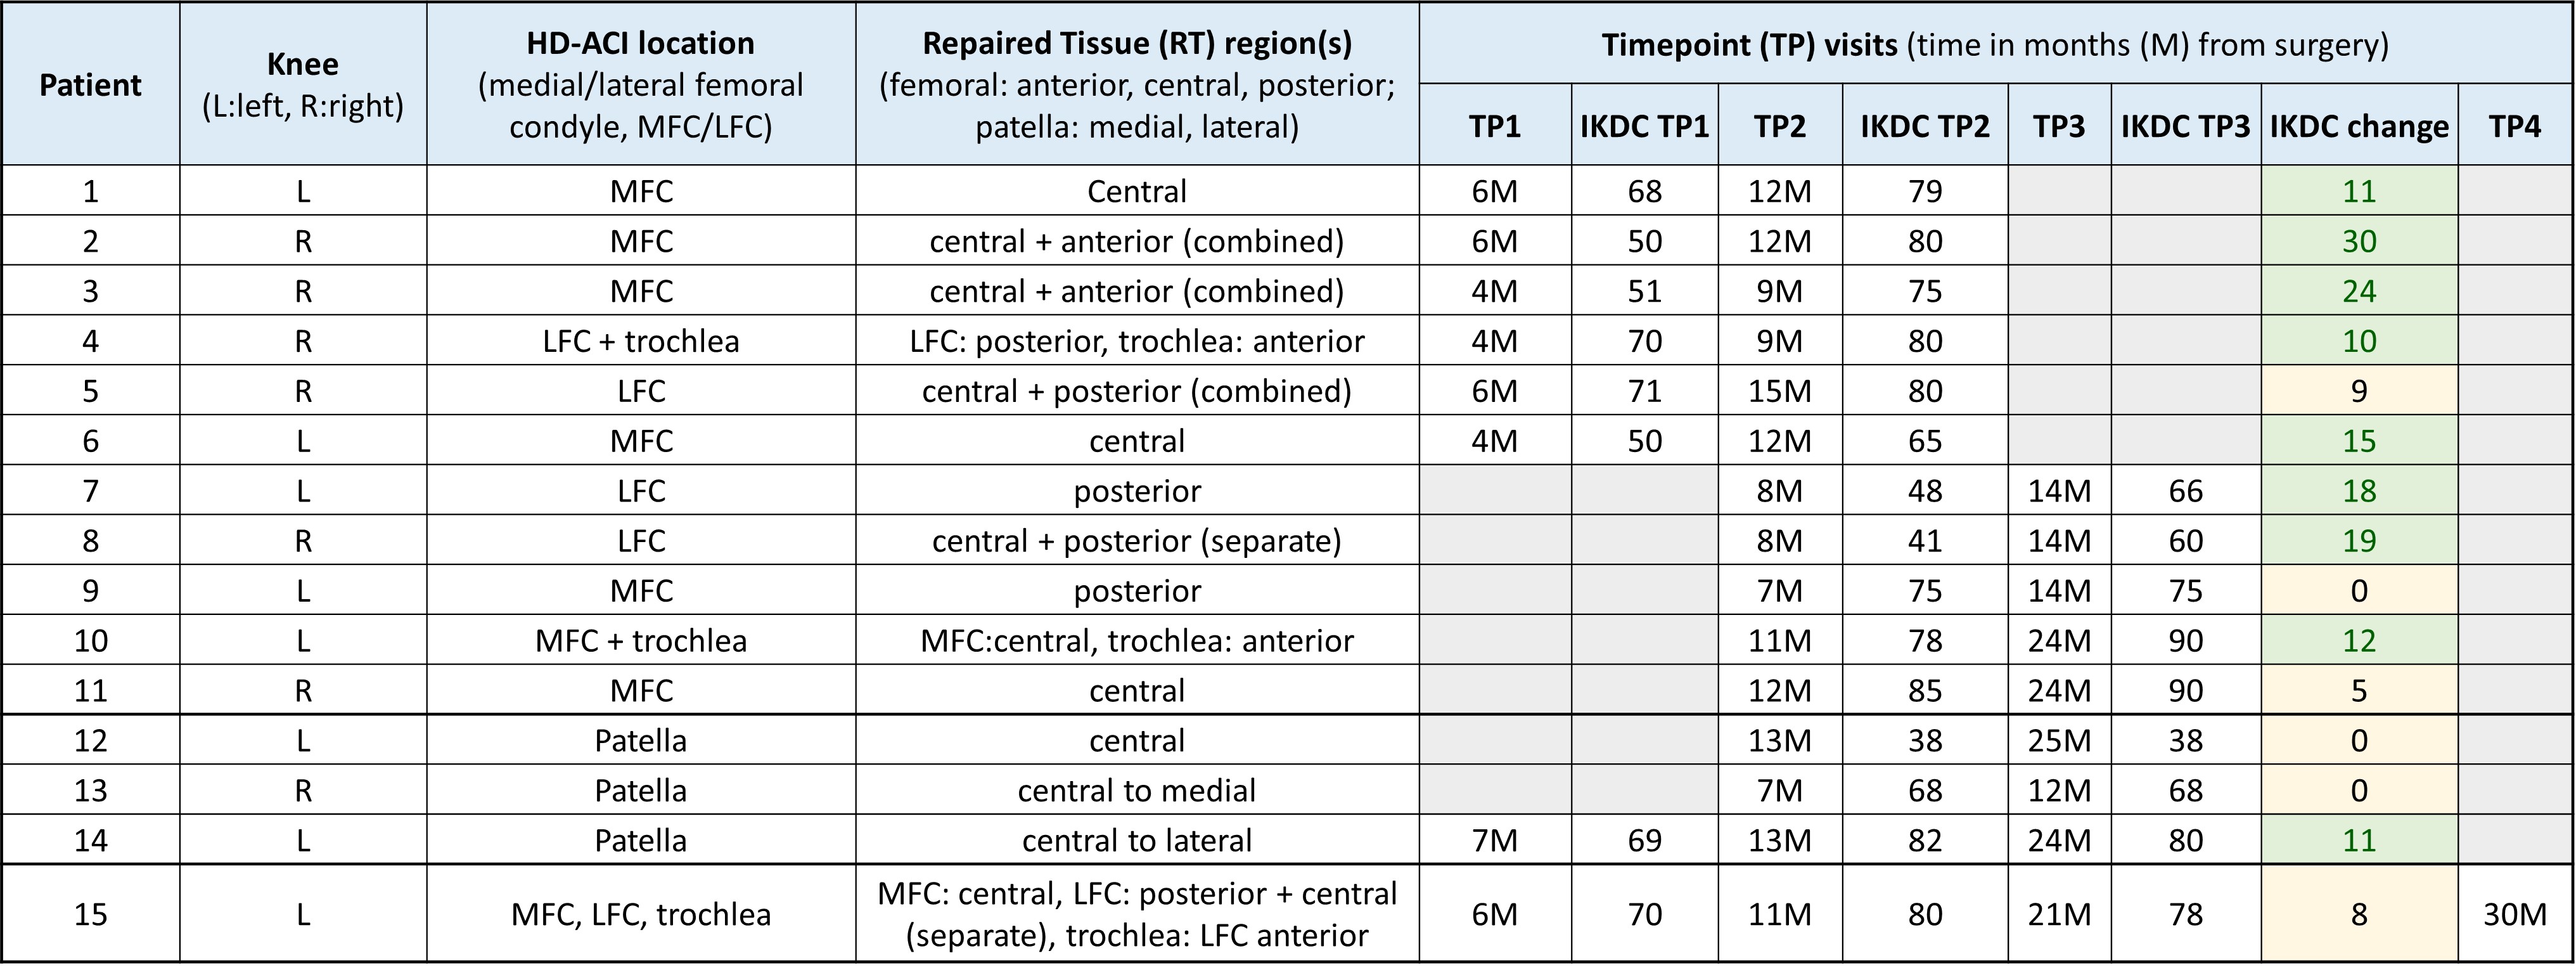
Table 1. Patient data: In RT region, “combined” means selected regions were averaged as both included same RT, “separate” means those regions were covering different HD-ACI so were independently included in the analysis. Maximum IKDC score of 100 means absence of symptoms/limitations in daily activities. IKDC change was calculated between TPs and used for progression classification. For patients 14 and 15, this change was computed from TP3 to TP1. 9 patients showed "good progression" based on IKDC change. Patient 15's TP4 was not included in the analysis as we did not have any other TP4.
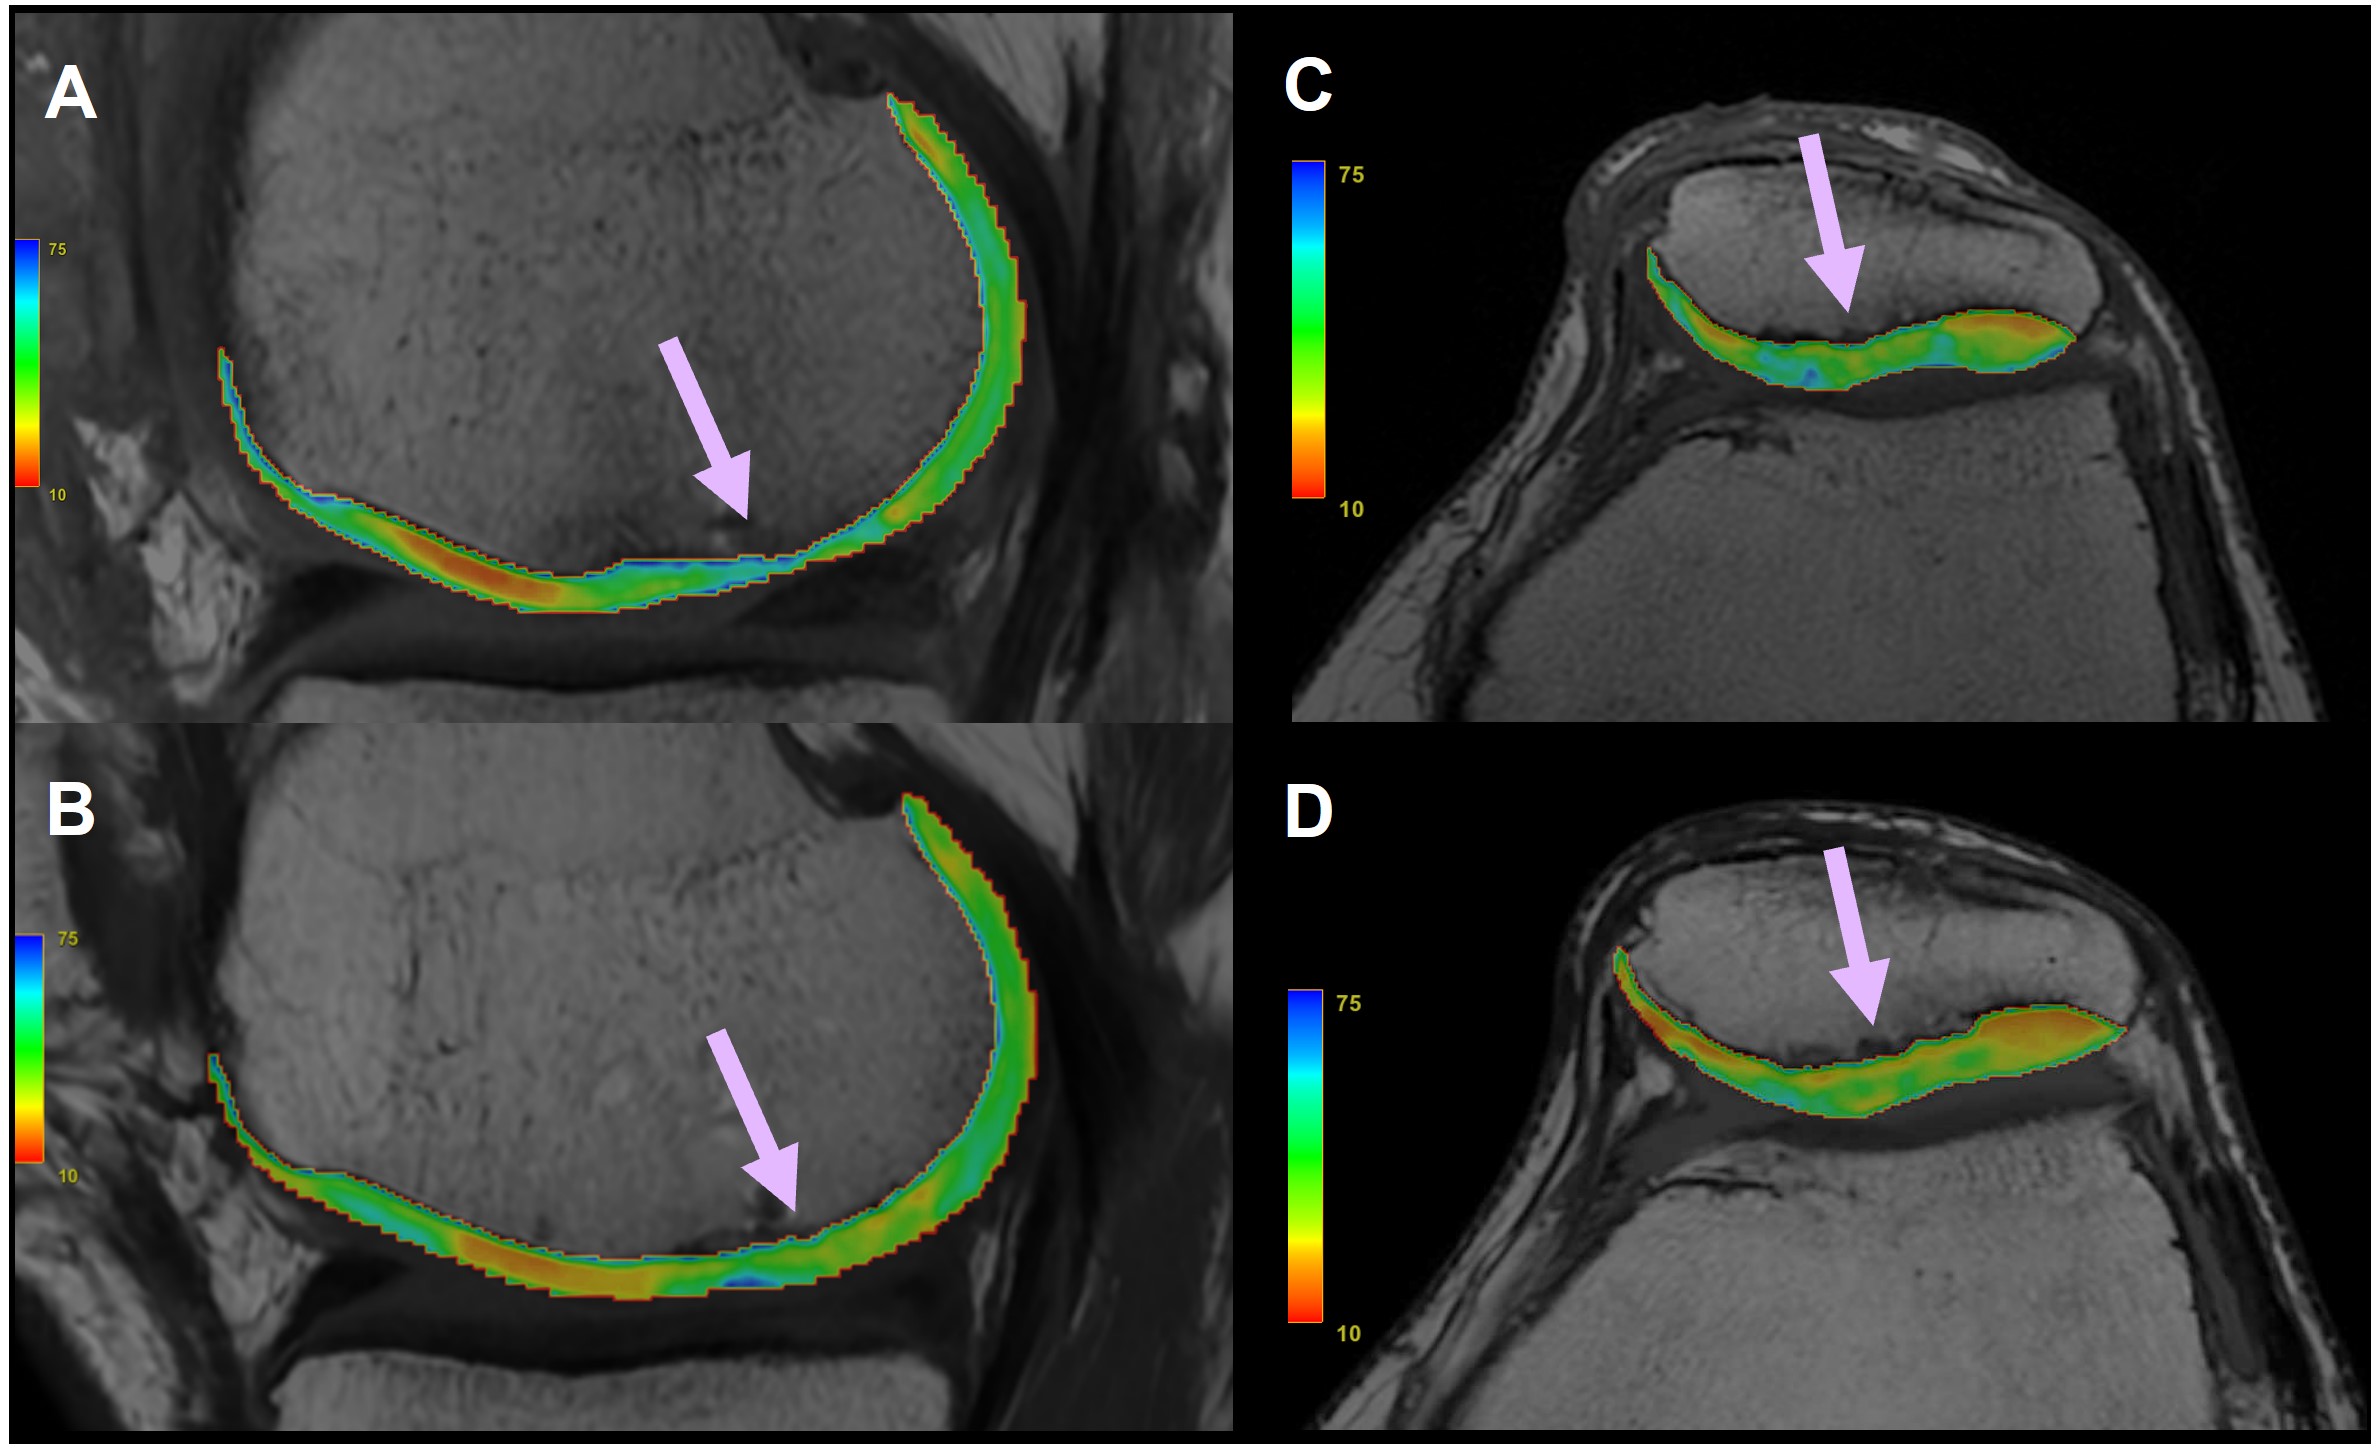
Figure 2. Cropped T2 maps for femoral HD-ACI (A) TP1 =11M, (B) TP2=14M; and patellar HD-ACI (C) TP1=7M, (D) TP3=24M. (B) shows lower T2 values and thicker cartilage compared to (A) in correlation with good clinical progression. For patellar HD-ACI, there is a non-significant decrease in T2 values (D) compared to TP1 (C). Patient did not present expected clinical improvement after 24M post-surgery being classified as “poor progression”.
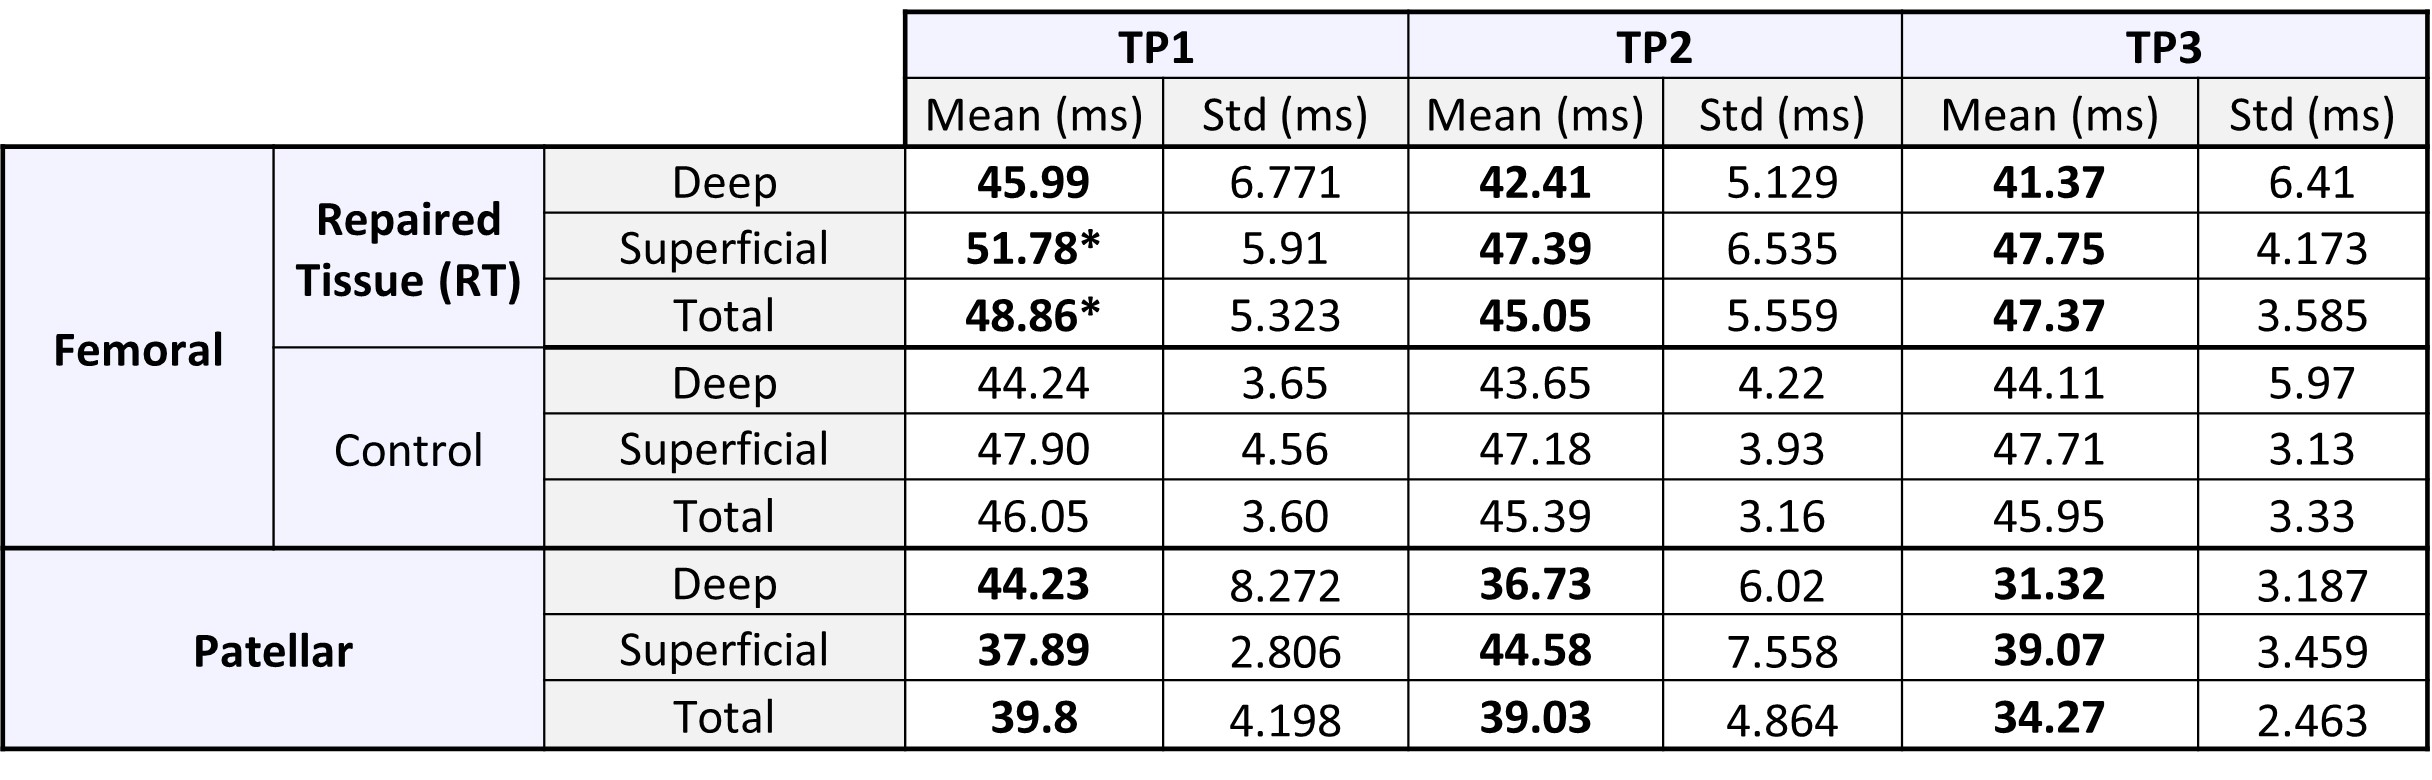
Table 2. Mean and standard deviation (std) of T2 values computed at each layer for both femoral and patellar compartments. Control data was only available for femoral implantation. “*” denotes significant difference between femoral RT and control T2 values according to paired t-test, p<0.05. No significant differences were found in TP2 and TP3. Surprisingly, mean deep patellar T2 value in TP1 was higher than superficial. This difference was reverted in TP2 and TP3 as cartilage healed. This could indicate a decrease in repair tissue water content and an increase in fibrous tissue5.
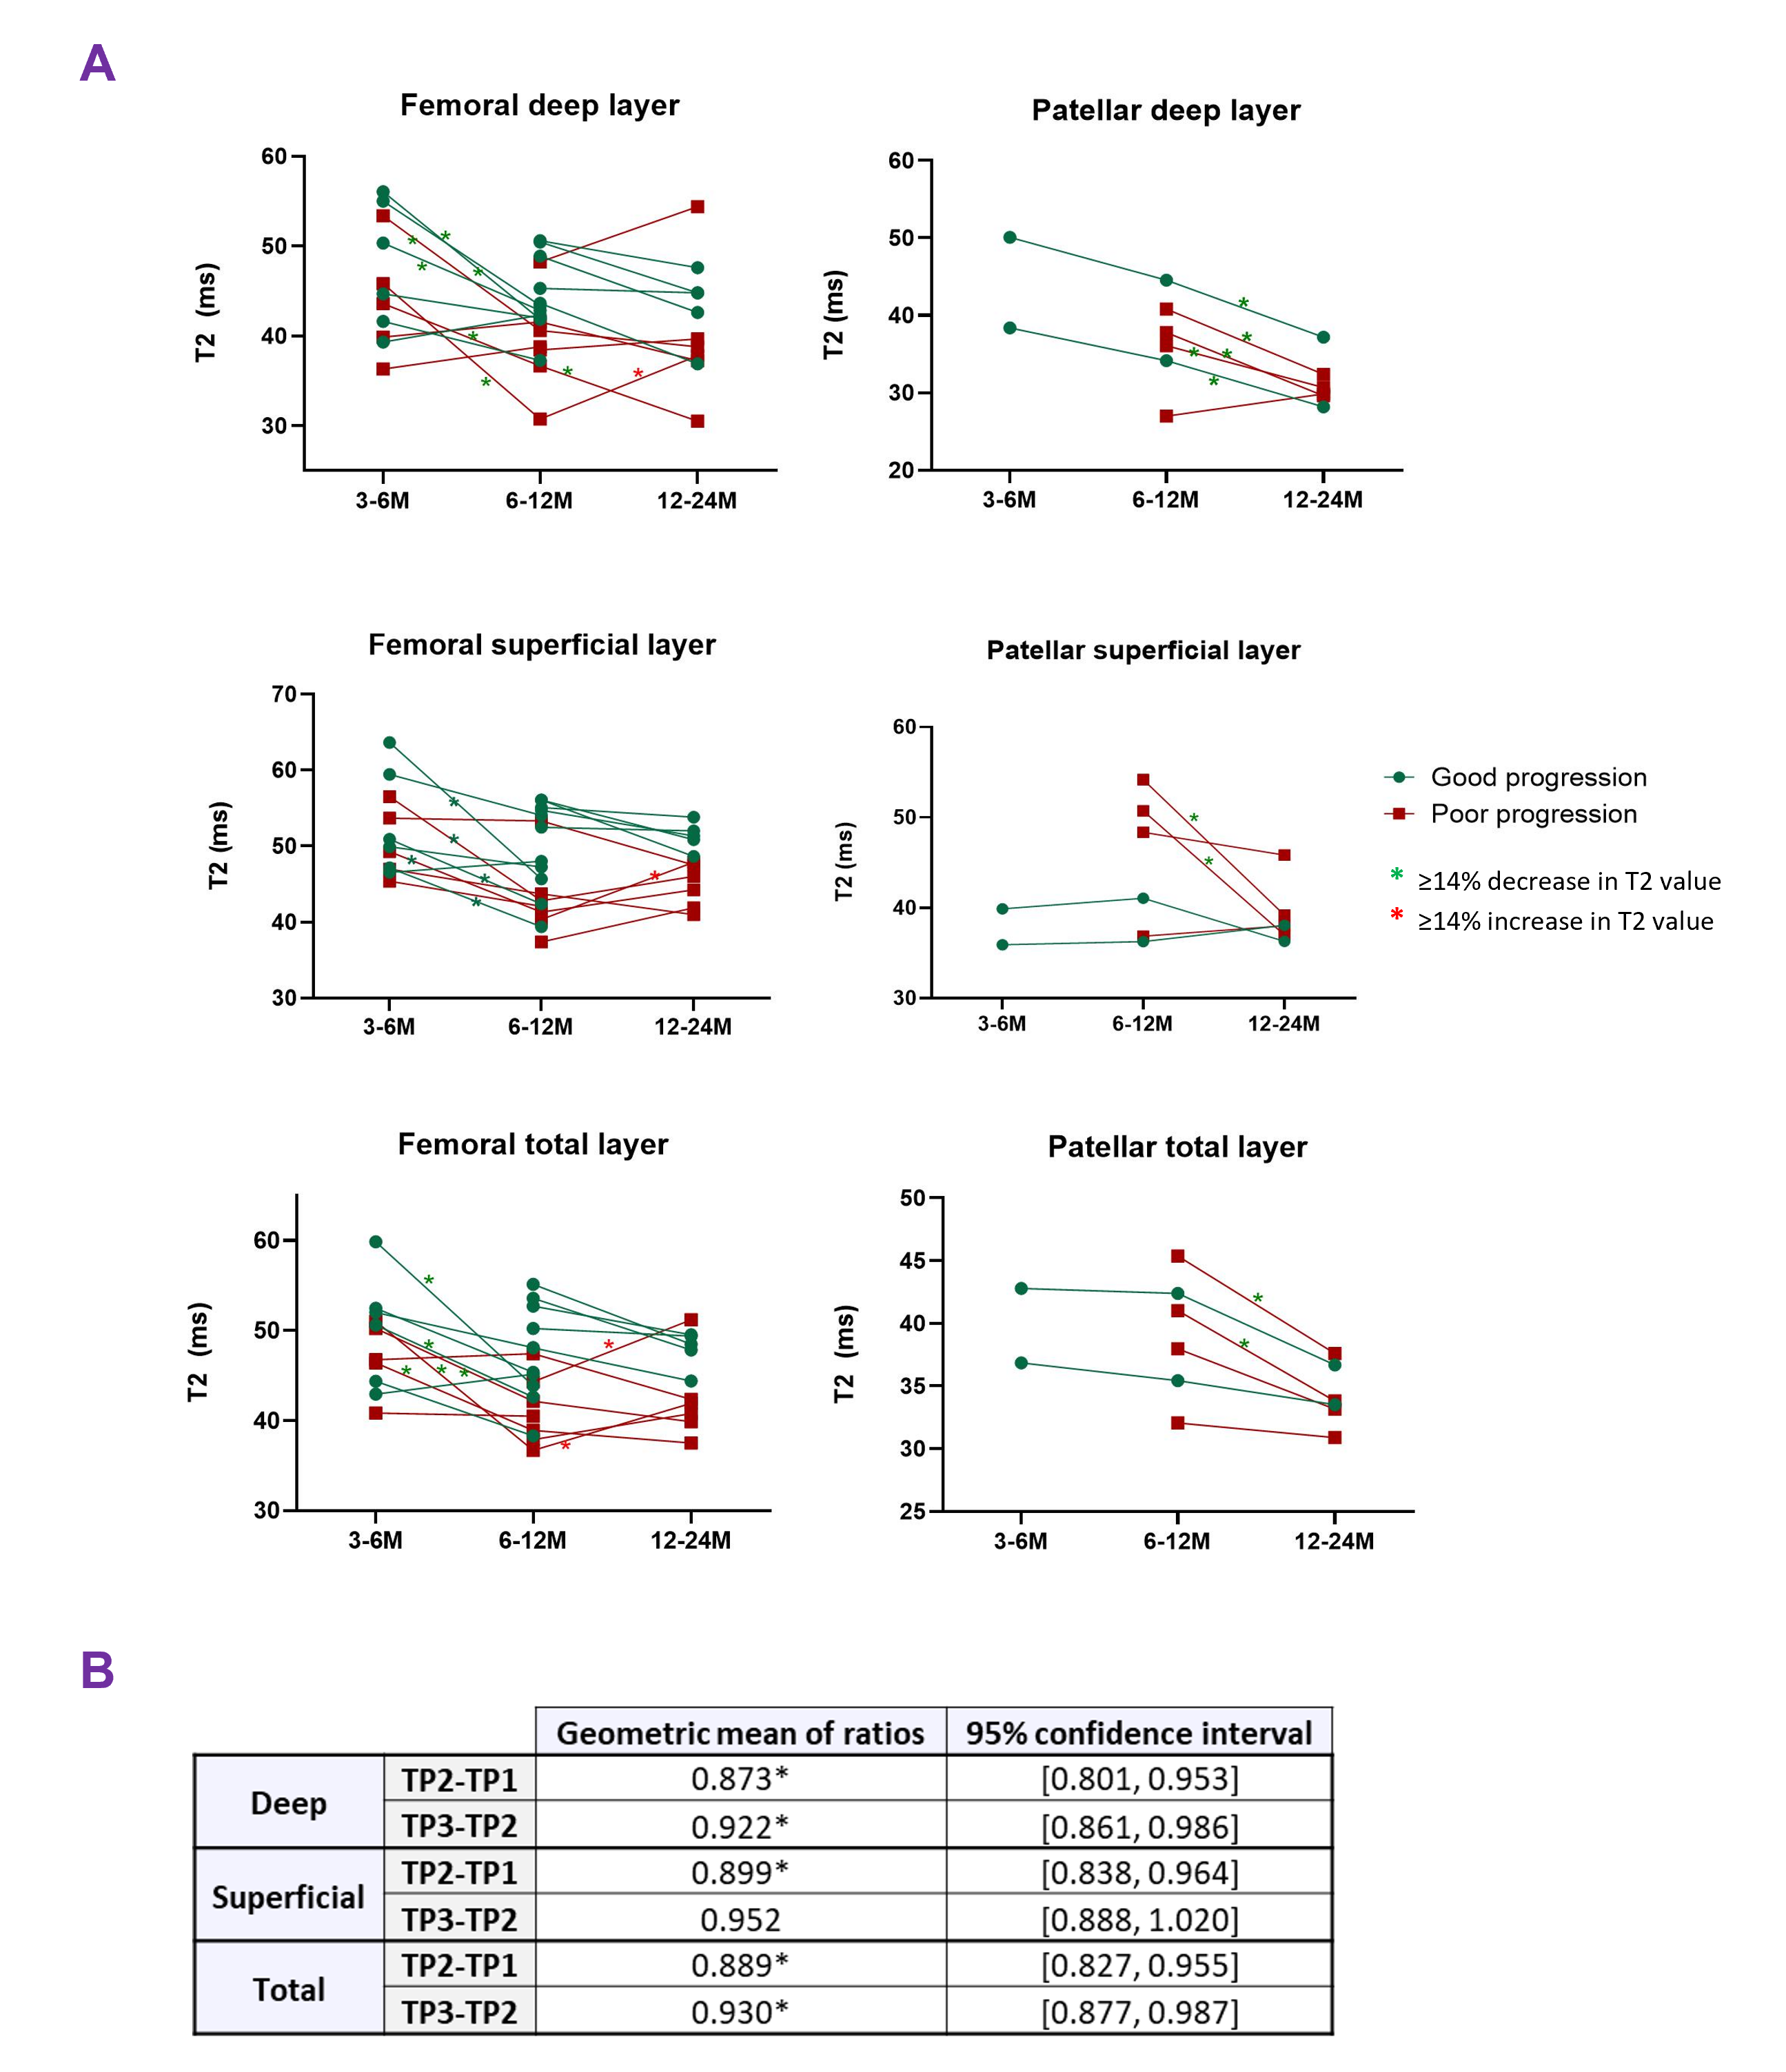
Figure 3. (A) ‘Before-after’ graphs showing paired data for femoral and patellar compartments, grouped by clinical “good/bad” progression. Meaningful T2 variations are color-coded depending on the direction of the change (green/red “*”). (B) Paired ratio t-test results considering all compartments. Geometric means confirm overall decrease of T2 across time (“*” denotes significant difference, p<0.05). This could indicate a decrease in repair tissue water content and an increase in fibrous tissue5.