0514
Longitudinal Assessment of Cartilage Thickness, T1ρ and T2 Changes in Patients with Mild Osteoarthritis using MRI and 3D Surface-Based Analysis1Department of Radiology, University of Cambridge, Cambridge, United Kingdom, 2Norwich Medical School, University of East Anglia, Norwich, United Kingdom, 3Division of Trauma and Orthopaedics, Department of Surgery, University of Cambridge, Cambridge, United Kingdom, 4Department of Radiology, Cambridge University Hospitals NHS Foundation Trust, Addenbrooke’s Hospital, Cambridge, United Kingdom, 5Antaros Medical, Uppsala, Sweden, 6Janssen Research and Development, Spring House, PA, United States, 7Clinical Imaging, GSK, London, United Kingdom, 8Amallis Consulting LTD, London, United Kingdom
Synopsis
Keywords: Osteoarthritis, Osteoarthritis
Motivation: Osteoarthritis (OA) leads to cartilage degradation and pain, impacting patients' lives. MRI allows detailed cartilage assessment; however, limited sensitivity hinders early-phase clinical trials developing disease-modifying treatments.
Goal(s): To apply 3D cartilage surface mapping in a homogeneous patient group over 12 months.
Approach: Combined morphological and compositional cartilage MRI with 3D surface-based analysis to assess longitudinal changes within patients with mild OA.
Results: Bi-directional cartilage thickness, T1ρ, and T2 alterations exceeding measurement errors were observed after 12 months. Medial femorotibial cartilage thinned, while lateral tibial cartilage thickened. Cartilage thickness changes correlated negatively with T1ρ and T2 changes in tibial and patellar cartilage.
Impact: The results and methods presented can improve understanding of early structural and compositional changes in cartilage, monitoring disease progression and assessing the effectiveness of therapeutic interventions in OA.
Introduction
Osteoarthritis (OA) is a degenerative joint disease characterized by cartilage degradation, leading to pain and disability. Quantifying cartilage morphology (thickness) and composition (T1ρ, T2 mapping) with MRI is common in observational and clinical studies aimed at understanding cartilage breakdown during disease progression. However, assessments are hindered by averaged measurements, typically provided over large regions, which lacks sensitivity to subtle change detection1. This limitation becomes particularly evident in early-phase clinical trials with small sample sizes.A novel semi-automated method called 3D cartilage surface mapping (3D-CaSM) has been previously introduced to address these limitations2. This surface-based analysis method allows for a sensitive assessment of the spatially heterogeneous cartilage changes occurring during OA progression.
The aim of the study is to use 3D-CaSM to explore changes within a homogeneous patient population over a 12-month period.
Methods
Nine participants with mild knee OA and five age- and BMI-matched healthy controls were imaged at baseline, 1 month and 12 months. Inclusion criteria for both groups were age 40–65 years and BMI ≤ 35kg/m2. For the OA group, inclusion also required a clinical diagnosis according to the American College of Rheumatology criteria, along with medial compartment predominant OA graded as Kellgren–Lawrence 2 on knee radiographs.All images were acquired on a 3.0T MRI system (MR750 GE Healthcare, Waukesha, WI, USA) using an 8-channel transmit/receive knee coil. The MR protocol consisted of a three-dimensional fat-saturated RF-spoiled gradient recalled-echo sequence (3D-SPGR, TR=26ms, TE=6.8ms, FA=25°, voxel size=0.29x0.29x1mm3), T1ρ mapping using a pseudo-steady-state 3D fast spin echo (PSS 3D-FSE) sequence with a rotary-echo spin-lock preparation cluster (TR=1565ms, TSLs=1, 10, 20, 35ms) and T2 mapping using a PSS 3D-FSE sequence with a composite 90x-180y-90x preparation pulse cluster (TR=1580ms, TEs=6.5, 13.4, 27.0, 40.7ms)3. The following parameters were identical for T1ρ and T2 sequences: voxel size=0.31x0.31x3mm3, number of slices per TSL/TE=72. The T1ρ and T2 maps were calculated by fitting a mono-exponential decay function to the voxel-wise signal intensities using a log-linearised least squares algorithm.
3D surface-based analyses of cartilage thickness and compositional measurements were performed using StradView software v6.11 (https://mi.eng.cam.ac.uk/Main/StradView). The 3D-SPGR datasets were used to perform sparse manual contouring of the femur, tibia and patella including their surrounding cartilage followed by shape-based interpolation to create triangulated surface mesh objects for each bone–cartilage structure. Unique mesh objects of each cartilage surface (femoral, patellar, medial tibial, lateral tibial) and for each participant were extracted and registered to a canonical (average) cartilage surface. All quantitative surface data were co-registered to the canonical surface.
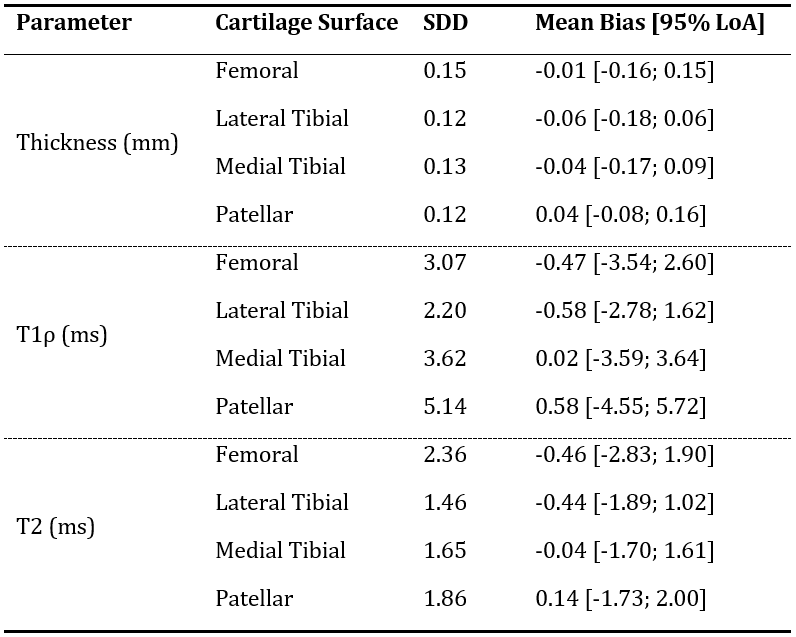
Repeatability was assessed using baseline and 1-month OA and control data. The smallest detectable difference (SDD) was determined from Bland-Altman analysis for all cartilage surfaces. Longitudinal changes were evaluated using baseline and 12-month OA data. Pearson's correlation coefficients were calculated to examine associations between morphological and compositional changes. The ±95% limit of agreement (LoA) intervals of the Bland-Altman repeatability plots were used to establish thresholds. Changes after 12 months exceeding the specified SDD were considered to be true alterations, as opposed to changes resulting from measurement error.
Results
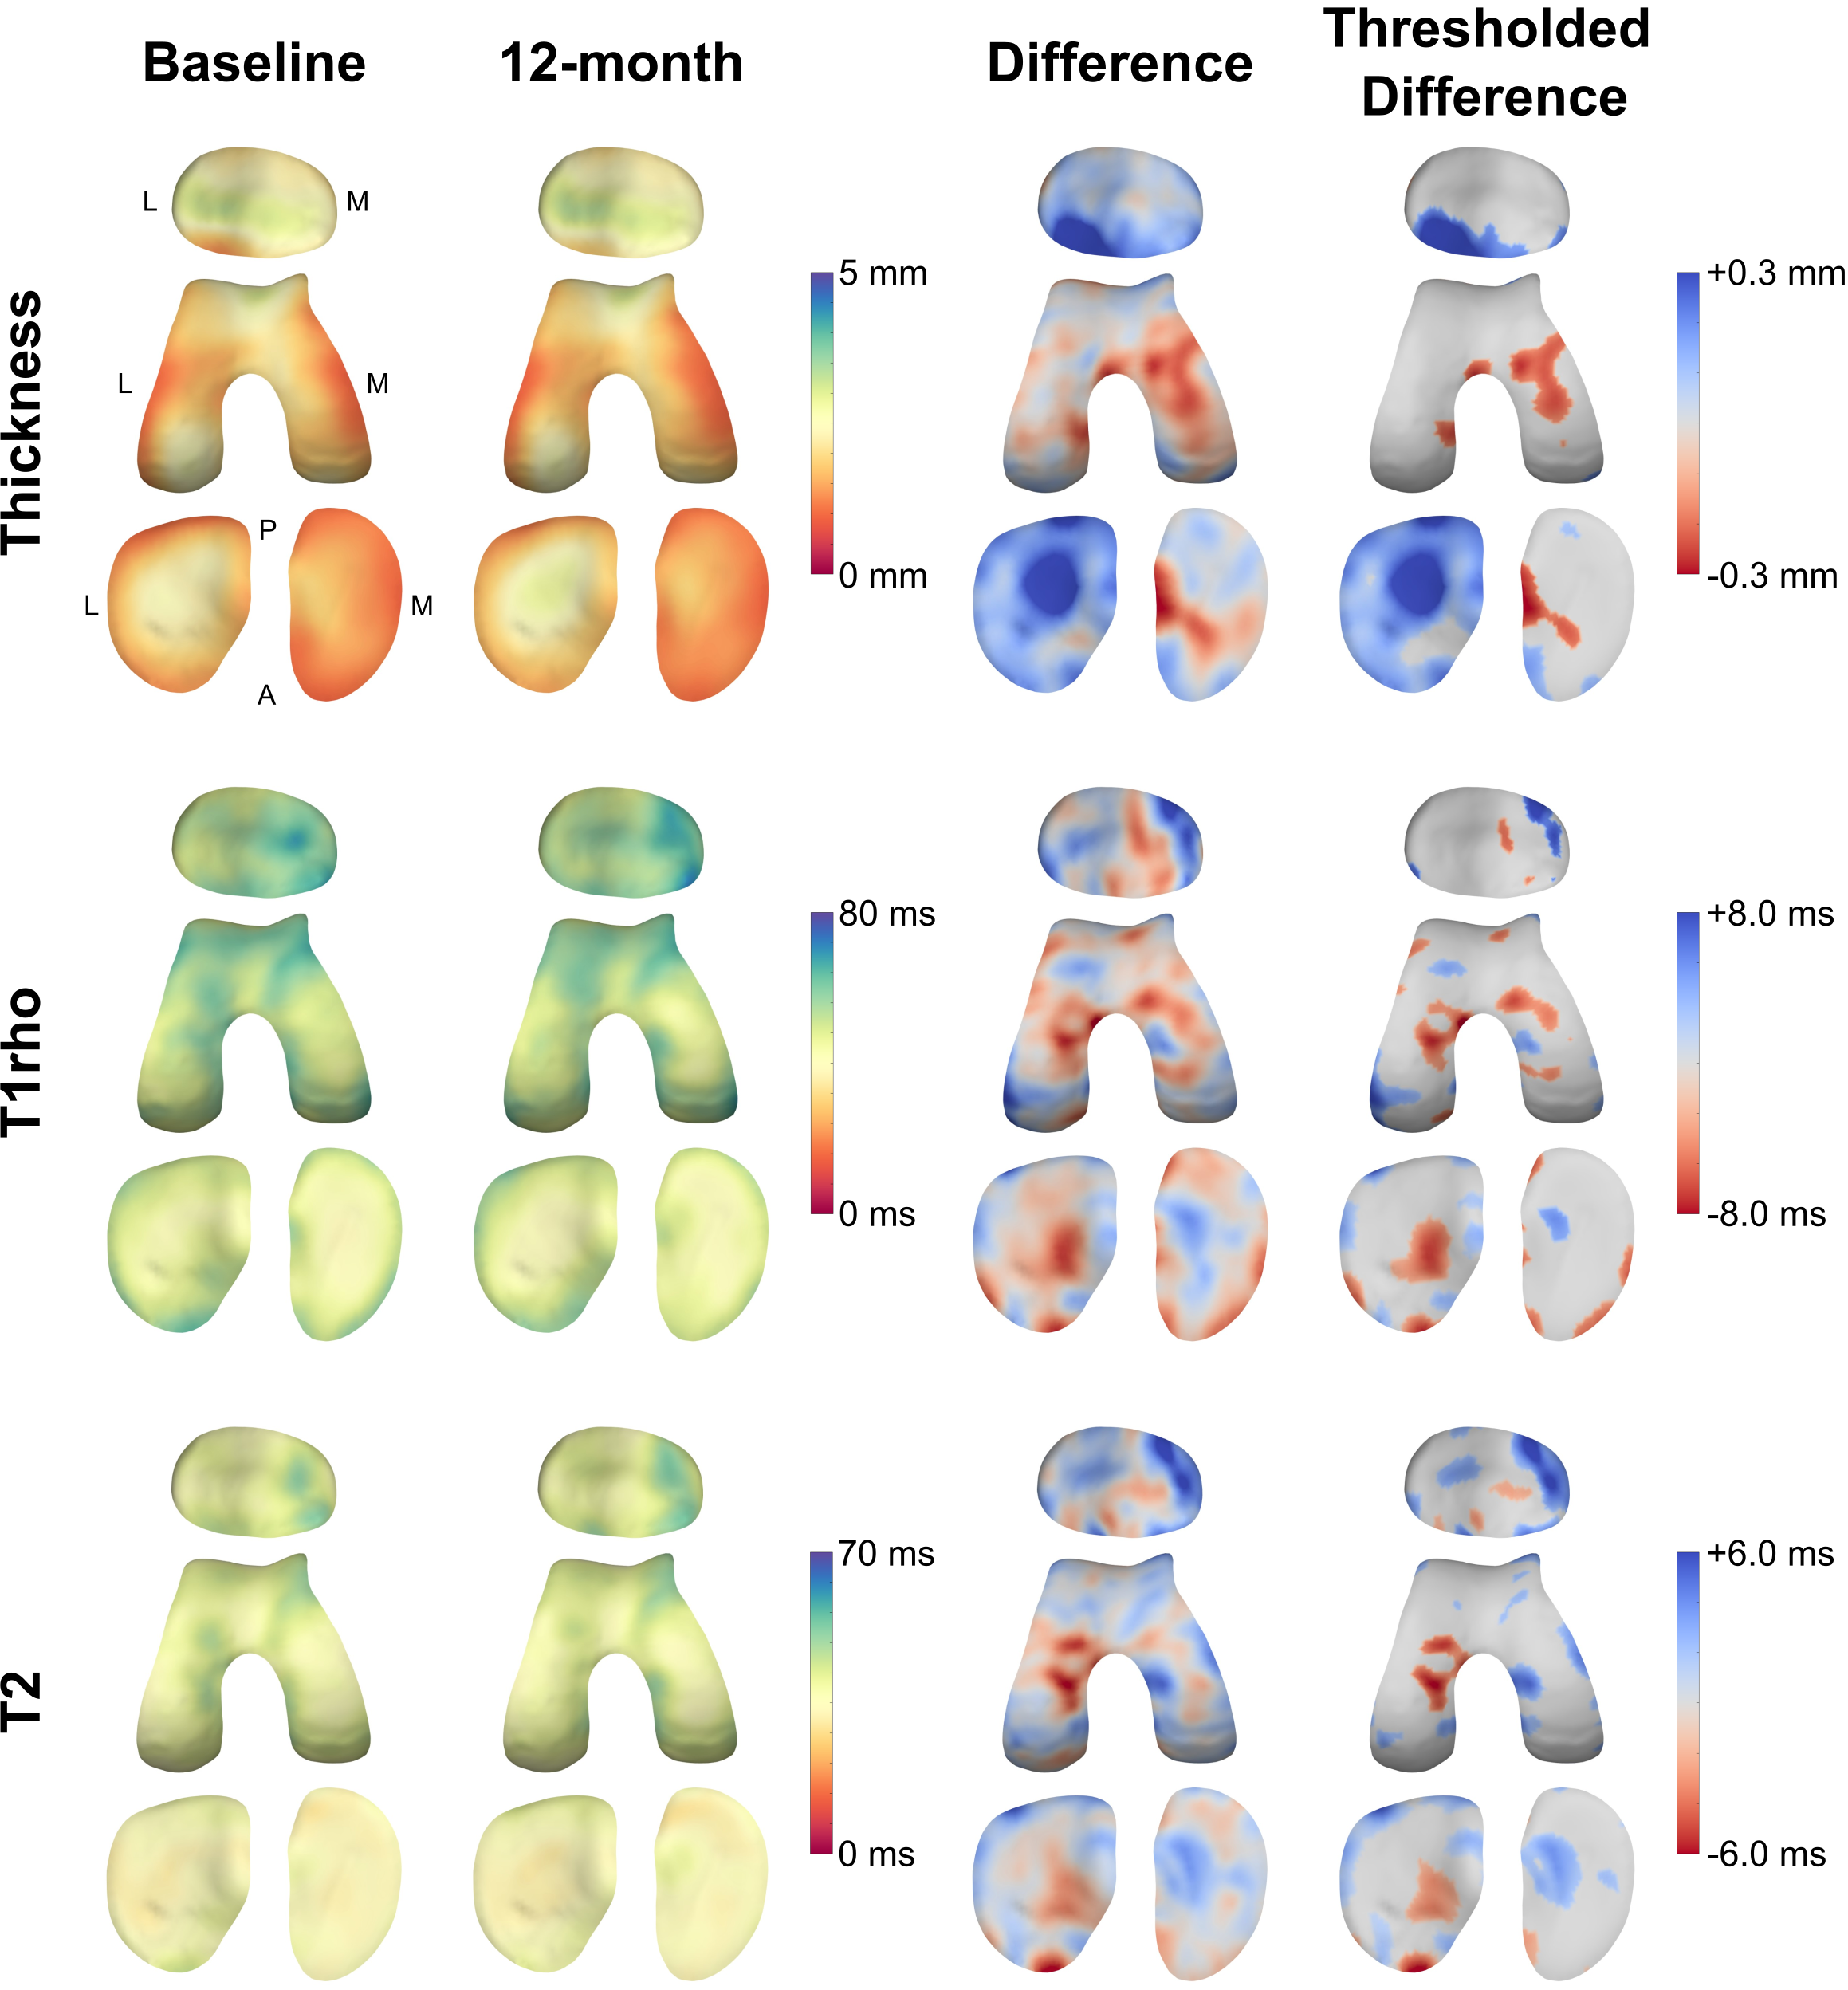
Bland-Altman analyses show good agreement between baseline and 1-month thickness, T1ρ and T2 measurements with determined mean biases, ±95% LoA and SDD for all four cartilage surfaces presented in Table 1.Vertex-wise mean OA thickness, T1ρ and T2 measurements extracted from the baseline and 12-month data displayed on the canonical cartilage surfaces are shown in Figure 1. Difference maps and the thresholded difference maps obtained at baseline and 12 months are also shown.
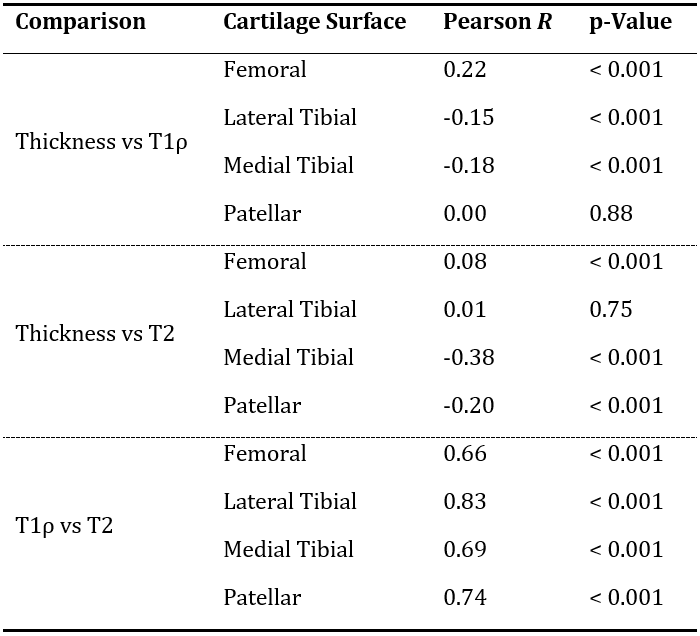
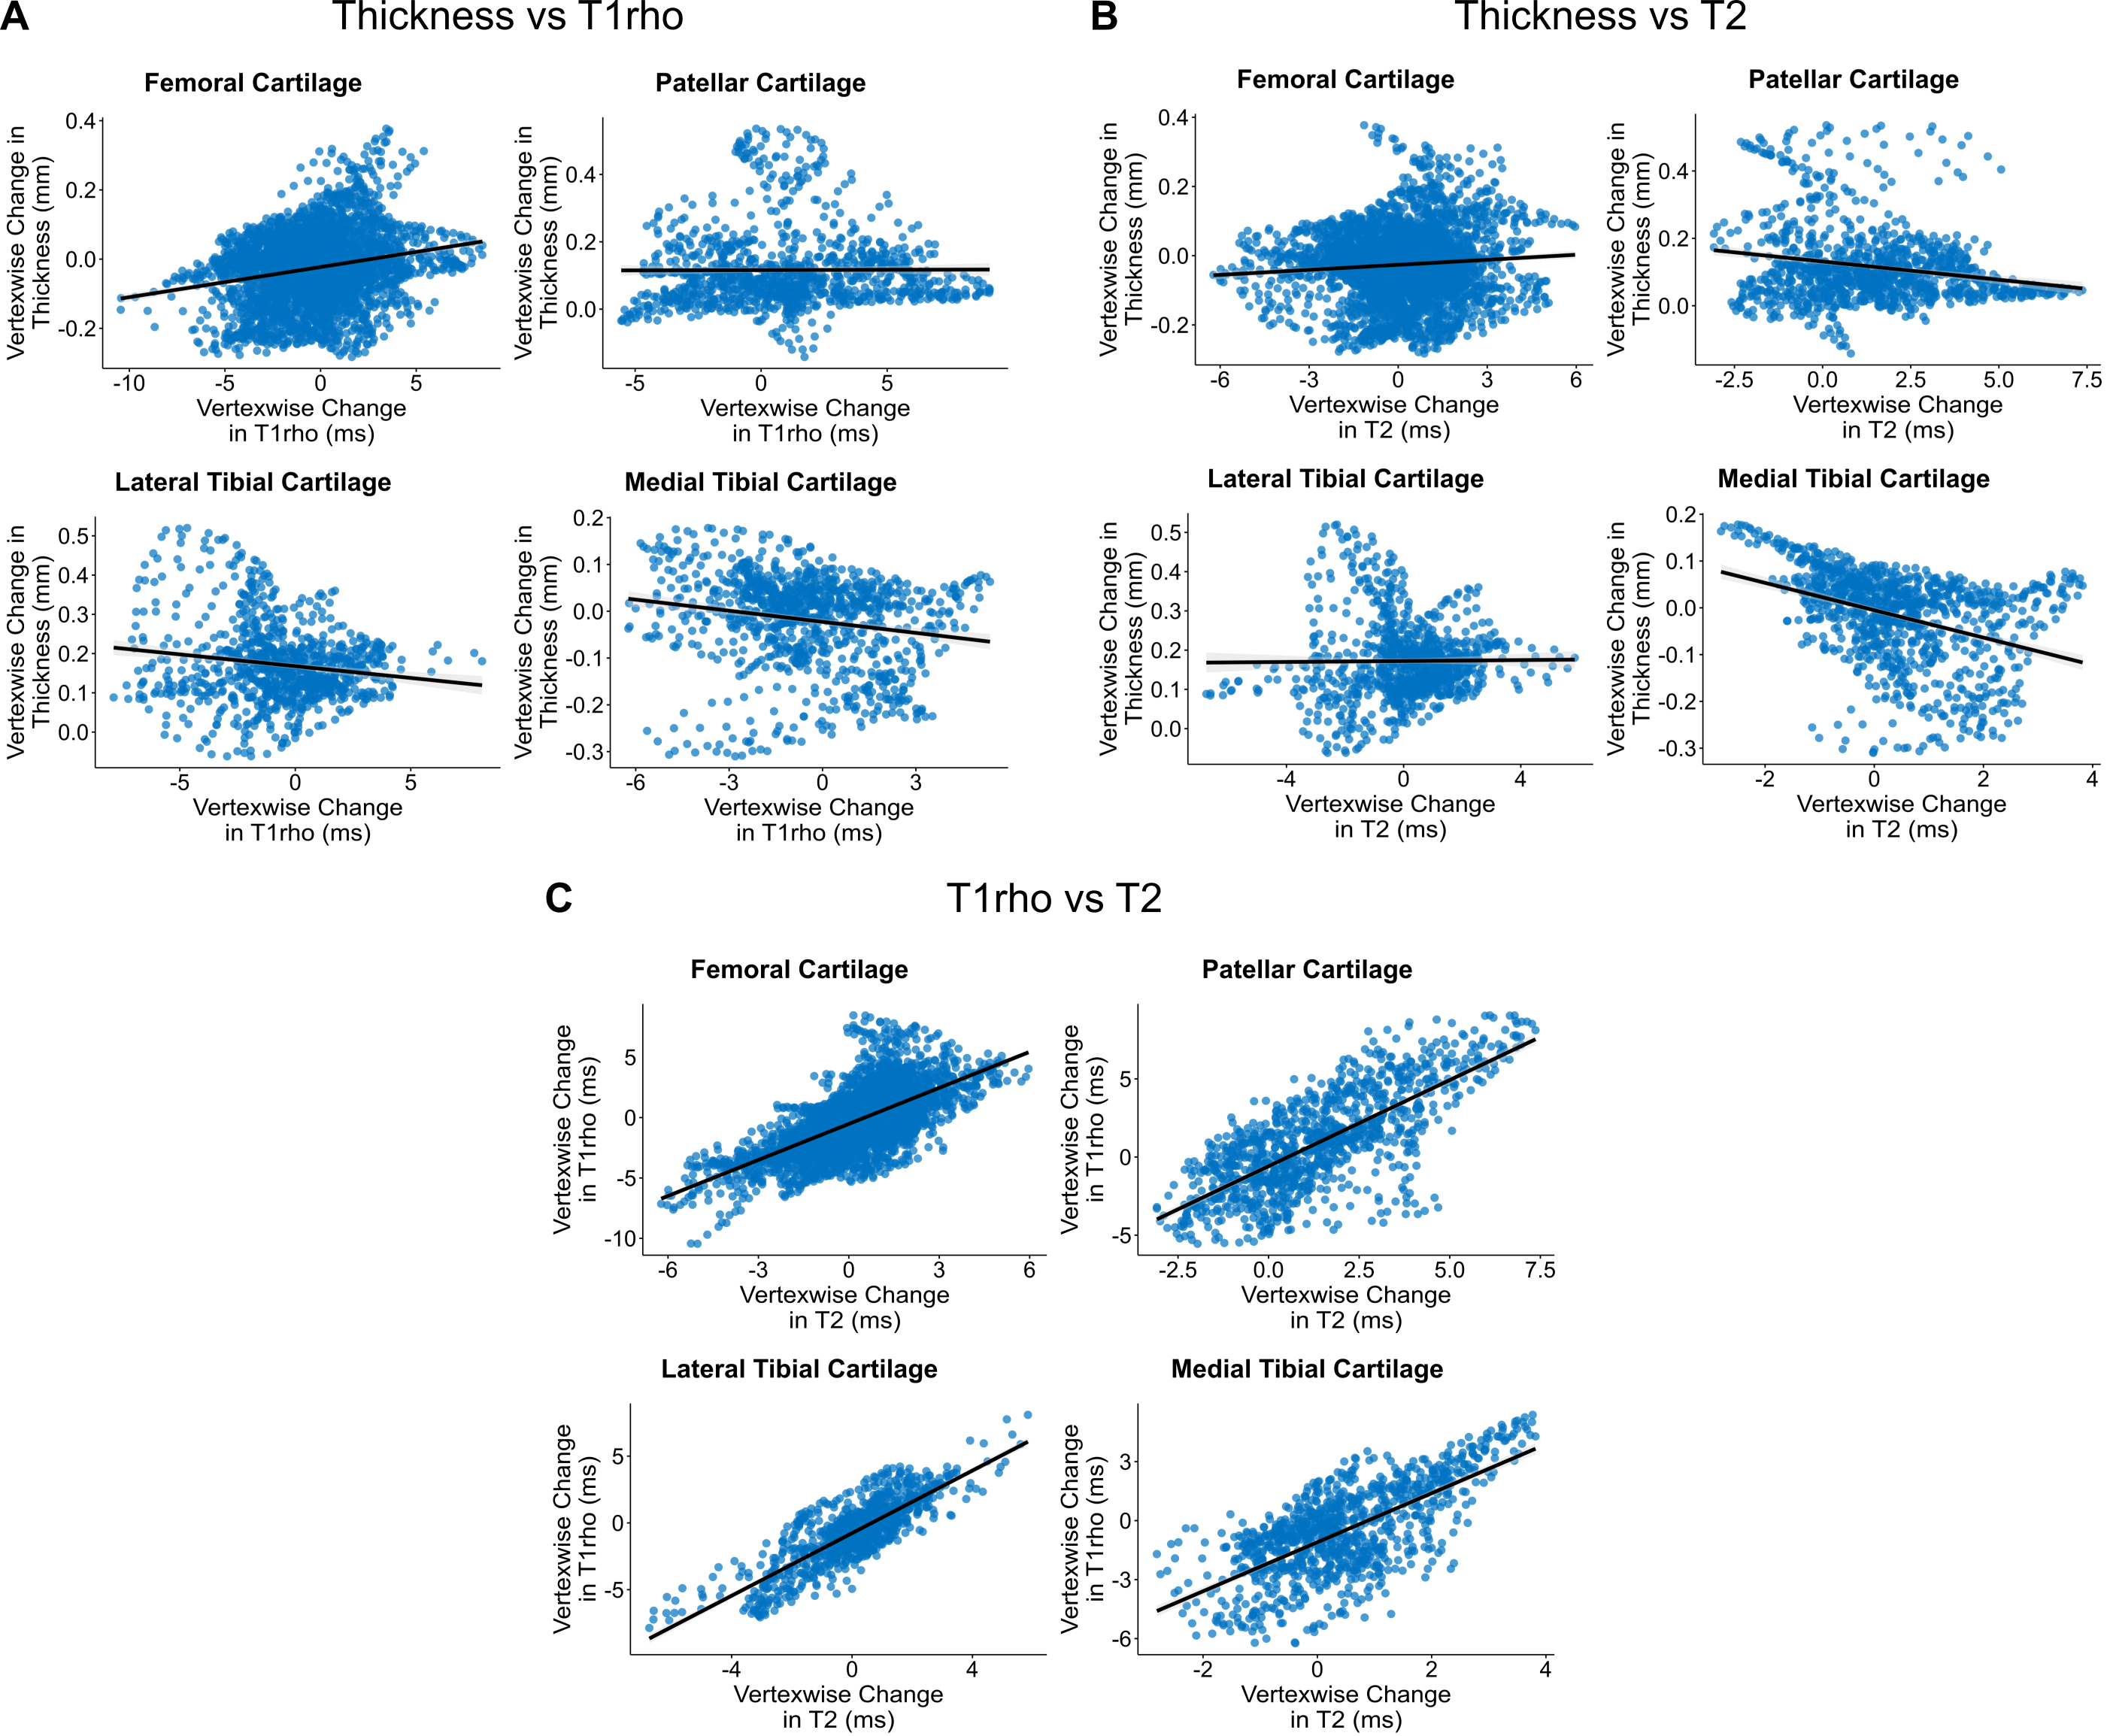
Results of the Pearson correlation analyses are presented in Table 2 and Figure 2.
Discussion
Repeatability analyses showed consistent measurements over one month. Longitudinal assessment revealed significant bi-directional changes in cartilage thickness, T1ρ and T2 over 12 months that were greater than the respective measurement errors. The observed reduction in cartilage thickness in medial femorotibial compartments and possible compensatory increase in thickness in lateral tibial compartment is concordant with previous research4–6.Elevated T1ρ and T2 relaxation times are associated with the loss of proteoglycans and collagen degradation, respectively, explaining the positive correlations observed between changes in T1ρ and T2. Negative correlations were revealed between changes in tibial thickness and T1rho as well as patellar and medial tibial thickness and T2. With a decrease in thickness, proteoglycan, and collagen content decrease, thus increasing T1ρ and T2 within these regions.
Conclusion
By combining MRI and 3D-CaSM, significant alterations in both cartilage morphology and composition over 12 months were detected in an OA cohort representative of a potential clinical trial population.Acknowledgements
This research was supported by GSK, Addenbrooke's Charitable Trust, and the NIHR Cambridge Biomedical Research Centre (BRC-1215-20014). The views expressed are those of the authors and not necessarily those of the NIHR or the Department of Health and Social Care.References
- Jørgensen DR, Lillholm M, Genant HK, et al. On Subregional Analysis of Cartilage Loss from Knee MRI. Cartilage 2013; 4: 121–130.
- MacKay JW, Kaggie JD, Treece GM, et al. Three-Dimensional Surface-Based Analysis of Cartilage MRI Data in Knee Osteoarthritis: Validation and Initial Clinical Application. J Magn Reson Imaging 2020; 52: 1139–1151.
- Chen W, Takahashi A, Han E. 3D Quantitative Imaging of T1rho and T2 (Abstract). Proc Annu Meet ISMRM 2011; 19: 231.
- Agnesi F, Amrami KK, Frigo CA, et al. Comparison of cartilage thickness with radiologic grade of knee osteoarthritis. Skeletal Radiol 2008; 37: 639–643.
- Favre J, Erhart‐Hledik JC, Blazek K, et al. Anatomically Standardized Maps Reveal Distinct Patterns of Cartilage Thickness With Increasing Severity of Medial Compartment Knee Osteoarthritis. J Orthop Res 2017; 35: 2442–2451.
- Deveza LA, Downie A, Tamez-Peña JG, et al. Trajectories of femorotibial cartilage thickness among persons with or at risk of knee osteoarthritis: development of a prediction model to identify progressors. Osteoarthr Cartil 2019; 27: 257–265.
Figures