0513
Positive Effect of Weight Loss on Knee Articular Cartilage – a Three-Year Follow-Up Using T2 Relaxation Time1Research Unit of Health Sciences and Technology, University of Oulu, Oulu, Finland, 2Research Service Unit, Oulu University Hospital, Oulu, Finland, 3Department of Radiology, Oulu University Hospital, Oulu, Finland
Synopsis
Keywords: Cartilage, Osteoarthritis, Relaxometry
Motivation: Weight loss has been shown to be beneficial for knee symptoms and reducing cartilage degeneration.
Goal(s): To examine the impact of weight-loss in obese subjects on articular cartilage in the tibiofemoral joint using T2 relaxation time mapping.
Approach: Knees of 65 obese patients undergoing either bariatric surgery or conservative weight loss regimens were imaged at 3T before and three years after treatment. Changes in T2 were assessed in tibiofemoral cartilage.
Results: A reduction in body mass index (BMI) was associated with shortened T2 values in tibia, indicating that weight loss may result in improved cartilage quality.
Impact: The findings provide supporting evidence for the benefits of weight loss for cartilage health and have relevance in the context of osteoarthritis prevention and treatment.
Introduction
One of the major risk factors for OA is obesity1. This can be attributed to increased mechanical stress2 and biochemical mechanisms, including the impact of adipokines secreted by the adipose tissue, which contributes to the development of OA3. In obese subjects, weight loss has been shown to be beneficial for slowing down the progression of OA4. T2 relaxation time is sensitive to content and arrangement of the collagen, as well as the hydration of articular cartilage5, and can be used to detect biochemical changes in cartilage before the appearance of the symptoms and visual imaging findings of OA6. The aim of this study was to investigate whether weight loss following either gastric bypass surgery or conservative treatment has a beneficial effect on the articular cartilage of the tibiofemoral joint.Methods
The patient cohort consisted of 65 morbidly obese patients (54 females; BMI between 32.2-54.9 kg/m2 at baseline, mean BMI 40.5 (5.61) kg/m2) who underwent either gastric bariatric surgery (Roux-en-Y) or conservative weight loss treatment. Tibiofemoral joints of patients were imaged at a 3.0 T (Skyra, Siemens Healthcare, Erlangen, Germany) at baseline (prior to intervention) and after three years follow-up. A multi-echo spin-echo sequence was used for T2 mapping (TR/TEs= 1680ms / 13.8, 27.6, 41.4, 55.2, 69ms; resolution=0.63x0.63mm2; 18 sagittal slices with slice thickness 3.00mm). The central cartilage areas of the tibia and femur were manually determined and isolated from the three centermost slices within the medial and lateral condyles. The midline dividing the cartilage in two halves was automatically determined for both femur and tibia, and cartilage was further divided into superficial and deep segments. A combination of these two layers was referred to as bulk cartilage. The analysis resulted in six regions of interest (ROIs) in both lateral and medial compartment (Figure 1): dcF, scF, bcF, bcT, scT, dcT. T2 relaxation times were calculated on a pixel-by-pixel basis using a mono-exponential model, and average relaxation time values were obtained for different ROIs5.Data were analyzed using generalized estimating equations (GEE) with T2 change as a target variable, BMI change as a covariate and ROI as a within factor, separately for lateral and medial sides.
Results
The mean age of the study population at baseline was 49.7 (7.1) years. The mean weight at baseline was 111.2 (17.4) kg and at three year follow-up 99.2 (18.8) kg (mean of change -12.0 (16.9) kg). Thirty-one (48%) patients underwent bariatric surgery. Mean of weight change in subjects who underwent bariatric surgery was -22.8 (14.0) kg and in the conservative weight loss intervention group -2.1 ± 12.9 kg. T2 relaxation times for each ROI at baseline and three year follow-up are reported in Figure 2 and Table 1. A change in BMI was significantly associated with a change in T2 in medial tibial cartilage (B=0.23, 95%CI 0.04 to 0.43, P=0.018) and lateral tibia cartilage (B=0.19, 95%CI 0.04 to 0.034, P=0.013). The change in T2 in femoral cartilage was not statistically significant (Table 1).Discussion
Previous research has shown that weight loss may protect against osteoarthrtitis and have a beneficial impact on articular cartilage 6,9,10. In this study, we used T2 relaxation time to examine the state of articular cartilage in the tibiofemoral joint over a 3-year follow-up after weight loss intervention. We found that there is a positive association between changes in BMI and changes in T2, which suggest weight loss is linked to improved cartilage quality. A BMI decrease of 10% or more over 48 months has been linked to reduced T2 increases in the medial compartment, indicating a slower rate of cartilage degeneration6. Similarly, another study demonstrated a reduced growth of T2 values associated with effect of weight loss in medial tibia cartilage11.In our study, we observed that a negative change in BMI on morbidly obese patients may be associated with enhanced cartilage quality, as suggested by the decreased T2 relaxation time values in tibia, in both lateral and medial compartments. Although T2 decreased also in femur after three years, changes were not correlated with weight loss. Taken together, these findings may indicate a positive effect on cartilage due to a reduced mechanical stress in tibia and a more even distribution of loads between the medial and lateral knee compartments as a result of weight loss.
Conclusion
In conclusion, in morbidly obese patients changes in BMI three years after weight loss intervention were associated with changes in T2 relaxation times. This finding may indicate improved cartilage tissue quality following weight loss, supporting the potential benefits of weight loss on knee cartilage.Acknowledgements
No acknowledgement found.References
1. Felson DT. The epidemiology of knee osteoarthritis: Results from the framingham osteoarthritis study. Semin Arthritis Rheum. 1990;20(3 SUPPL. 1):42-50. doi:10.1016/0049-0172(90)90046-I
2. Vincent HK, Heywood K, Connelly J, Hurley RW. Obesity and Weight Loss in the Treatment and Prevention of Osteoarthritis. PM R. 2012;4(5 SUPPL.):59-67. doi:10.1016/j.pmrj.2012.01.005
3. Hui W, Litherland GJ, Elias MS, et al. Leptin produced by joint white adipose tissue induces cartilage degradation via upregulation and activation of matrix metalloproteinases. Ann Rheum Dis. 2012;71(3):455-462. doi:10.1136/annrheumdis-2011-200372
4. Serebrakian AT, Poulos T, Liebl H, et al. Weight loss over 48 months is associated with reduced progression of cartilage T2 relaxation time values: Data from the osteoarthritis initiative. J Magn Reson Imaging. 2015;41(5):1272-1280. doi:10.1002/jmri.24630
5. Nissi MJ, Rieppo J, Töyräs J, et al. T2 relaxation time mapping reveals age- and species-related diversity of collagen network architecture in articular cartilage. Osteoarthr Cartil. 2006;14(12):1265-1271. doi:10.1016/j.joca.2006.06.002
6. Eckstein F, Burstein D, Link TM. Quantitative MRI of cartilage and bone: degenerative changes in osteoarthritis. NMR Biomed. 2006;19(7):822-854. doi:10.1002/nbm.1063
7. Gersing AS, Schwaiger BJ, Nevitt MC, et al. Weight loss regimen in obese and overweight individuals is associated with reduced cartilage degeneration: 96-month data from the Osteoarthritis Initiative. Osteoarthr Cartil. 2019;27(6):863-870. doi:10.1016/j.joca.2019.01.018
8. Joseph GB, McCulloch CE, Nevitt MC, Lynch J, Lane NE, Link TM. Effects of Weight Change on Knee and Hip Radiographic Measurements and Pain Over Four Years: Data From the Osteoarthritis Initiative. Arthritis Care Res. 2023;75(4):860-868. doi:10.1002/acr.24875
9. Gersing AS, Solka M, Joseph GB, et al. Progression of cartilage degeneration and clinical symptoms in obese and overweight individuals is dependent on the amount of weight loss: 48-month data from the Osteoarthritis Initiative. Osteoarthr Cartil. 2016;24(7):1126-1134. doi:10.1016/j.joca.2016.01.984
Figures
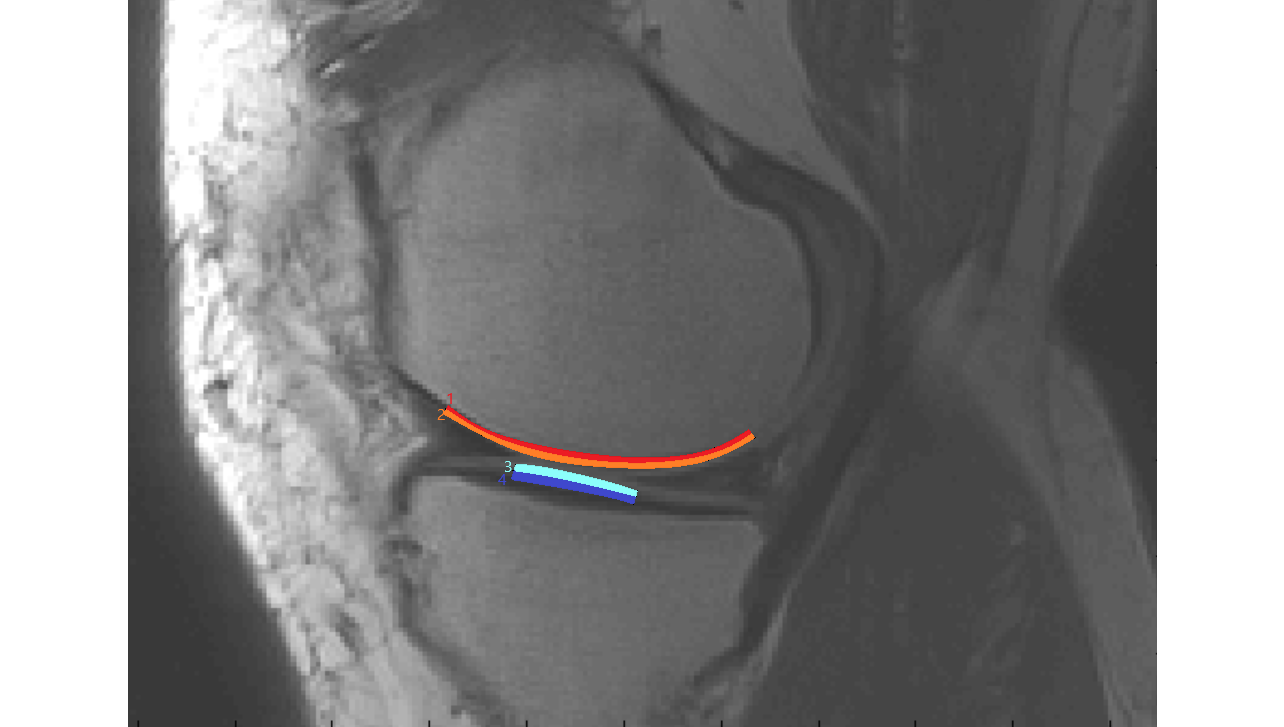
Figure 1: ROIs of the tibiofemoral joint used in this study: 1. dcF (deep layer of central femur), 2. scF (superficial layer of central femur), 3. scT (superfcial layer of central tibia), 4. dcT (deep layer of central tibia). Additionally, combination of 1 and 2 (dcF+scF) was referred to as bcF (bulk central femur); combination of 1 and 2 (dcT+scT) was referred to as bcT (bulk central tibia).
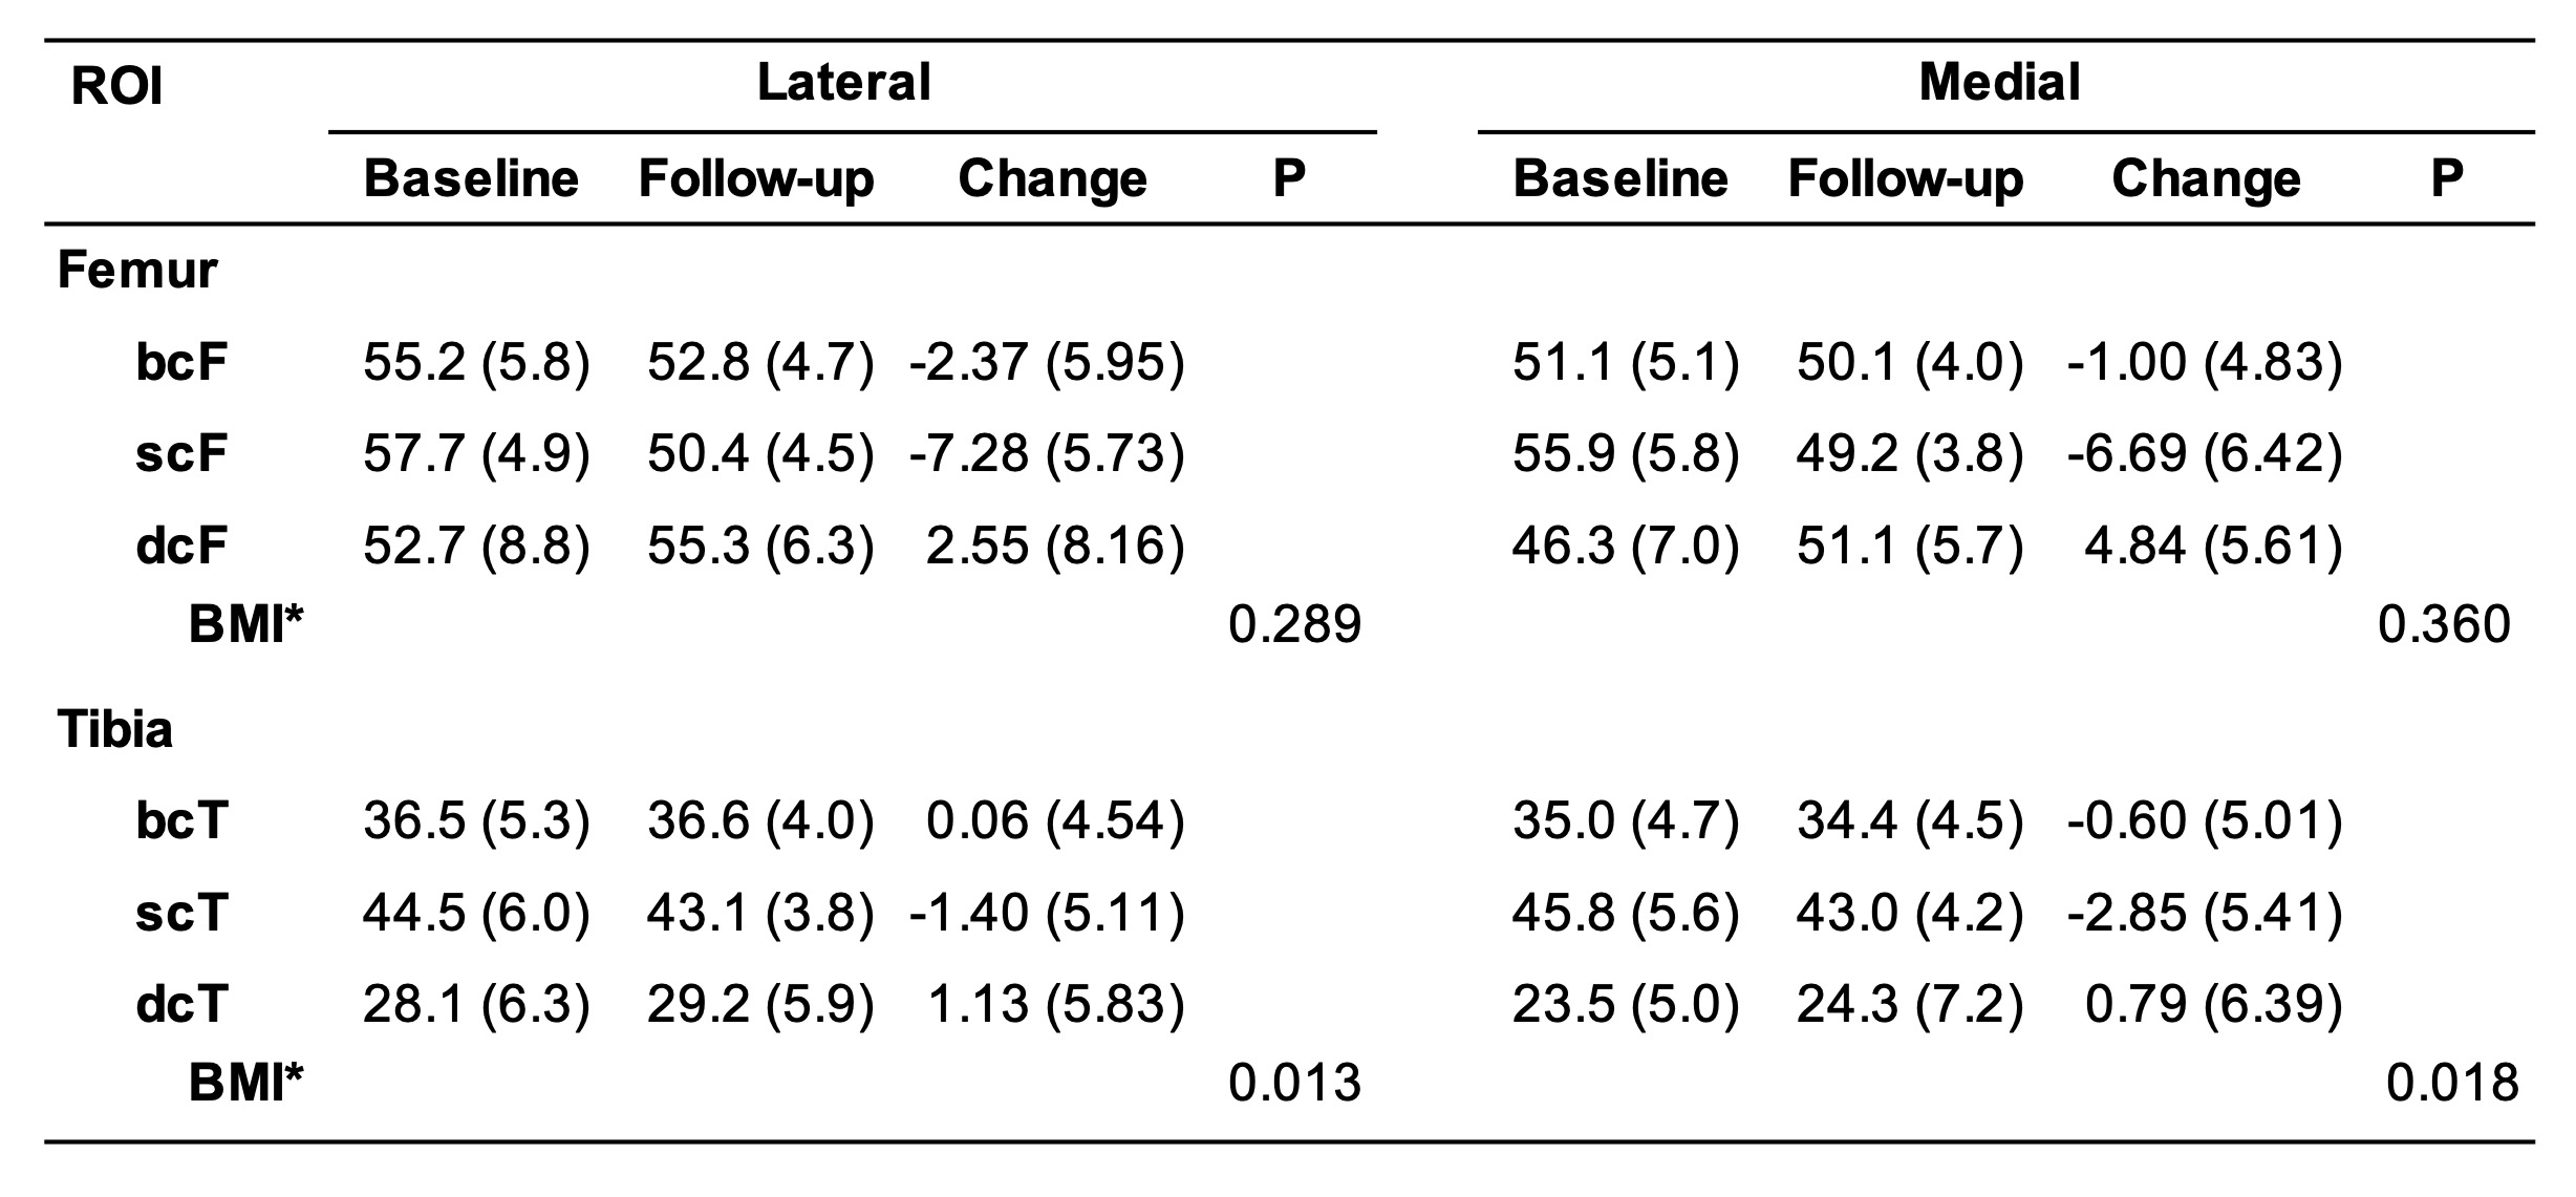
Table 1: Mean T2 relaxation times with standard deviation (SD) at baseline and follow-up in each region of interest. P-value for the association between BMI change and T2 change in lateral and medial femur and tibia. * BMI at baseline 40.5 (5.6) kg/m2, at the follow-up 36.1 (6.2) kg/m2, BMI change 4.3 (6.1) kg/m2.
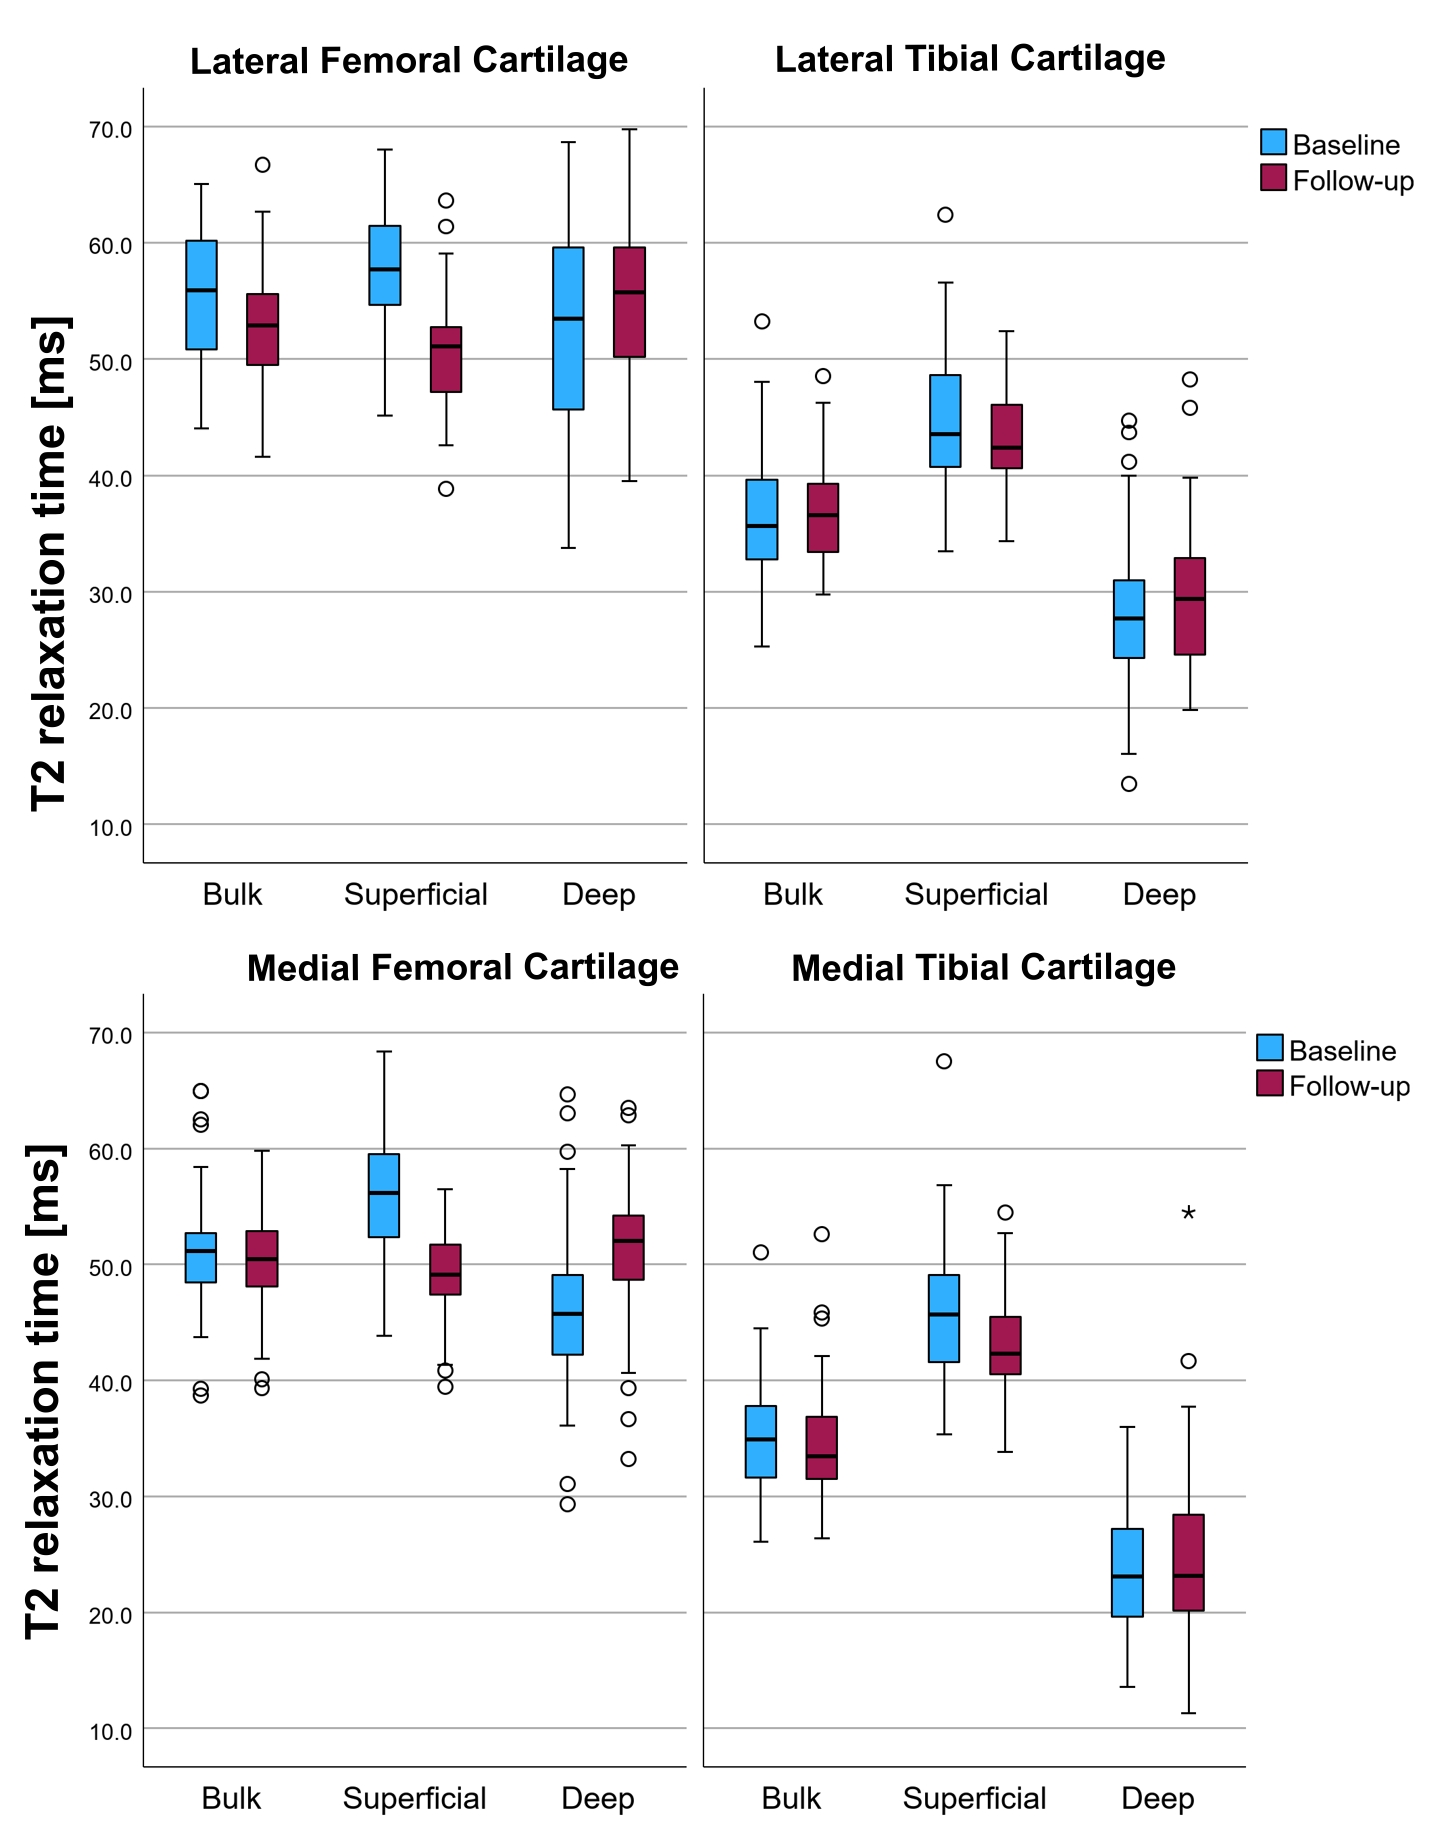
Figure 2: T2 relaxation times presented as boxplots for each ROI. Baseline and follow-up values are represented by blue and red color.
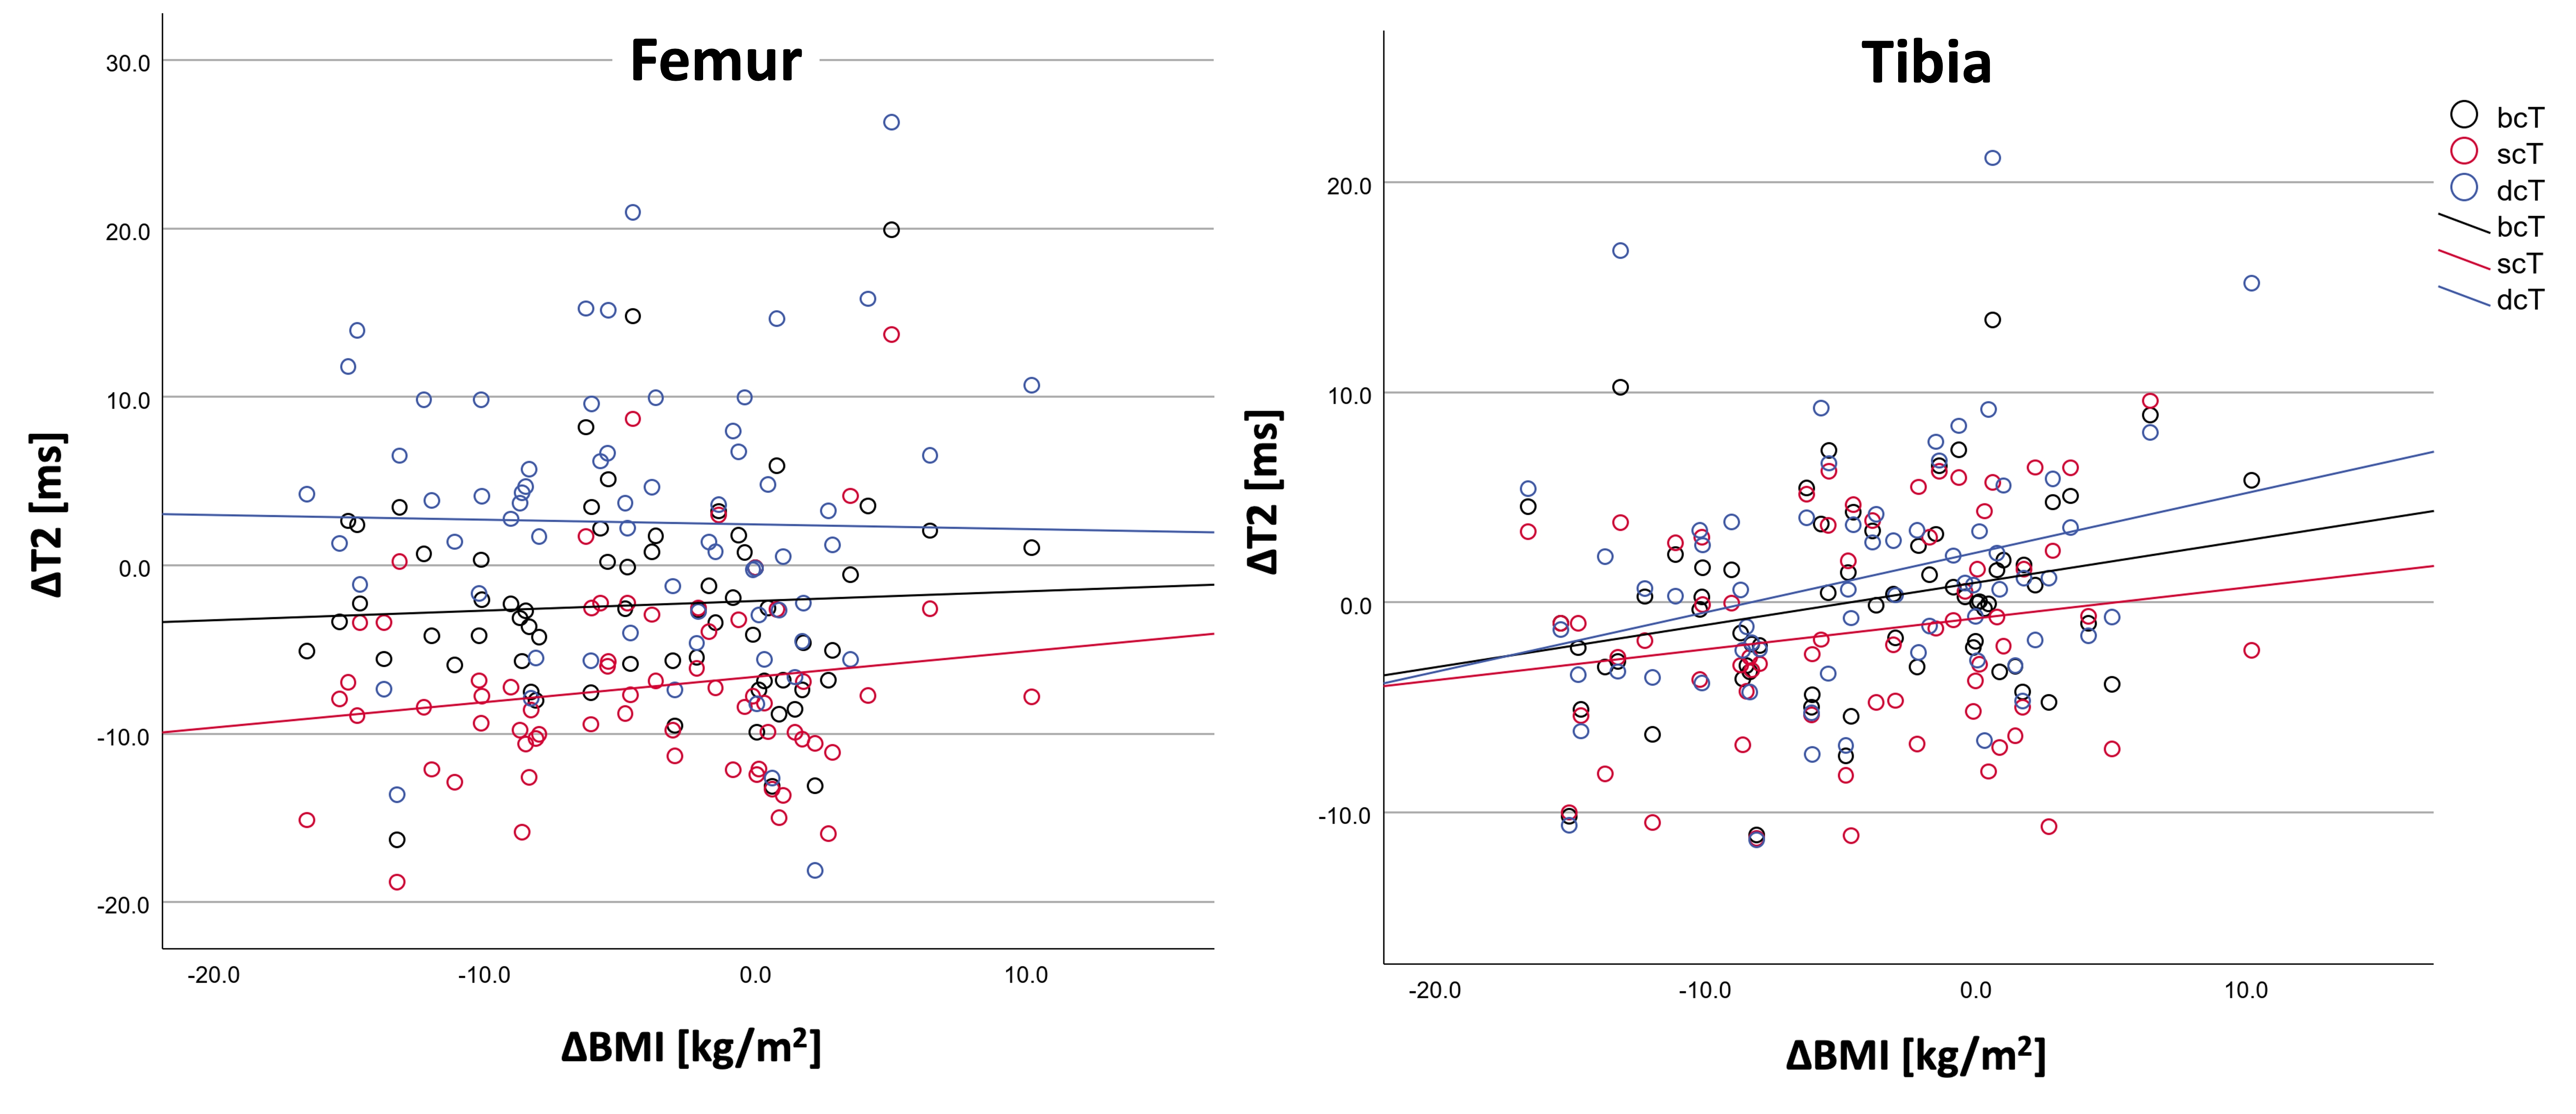
Figure 3: Scatterplots of the relatioship between T2 change [ms] and BMI change [kg/m2] for different ROIs of femur and tibia in the lateral compartment.
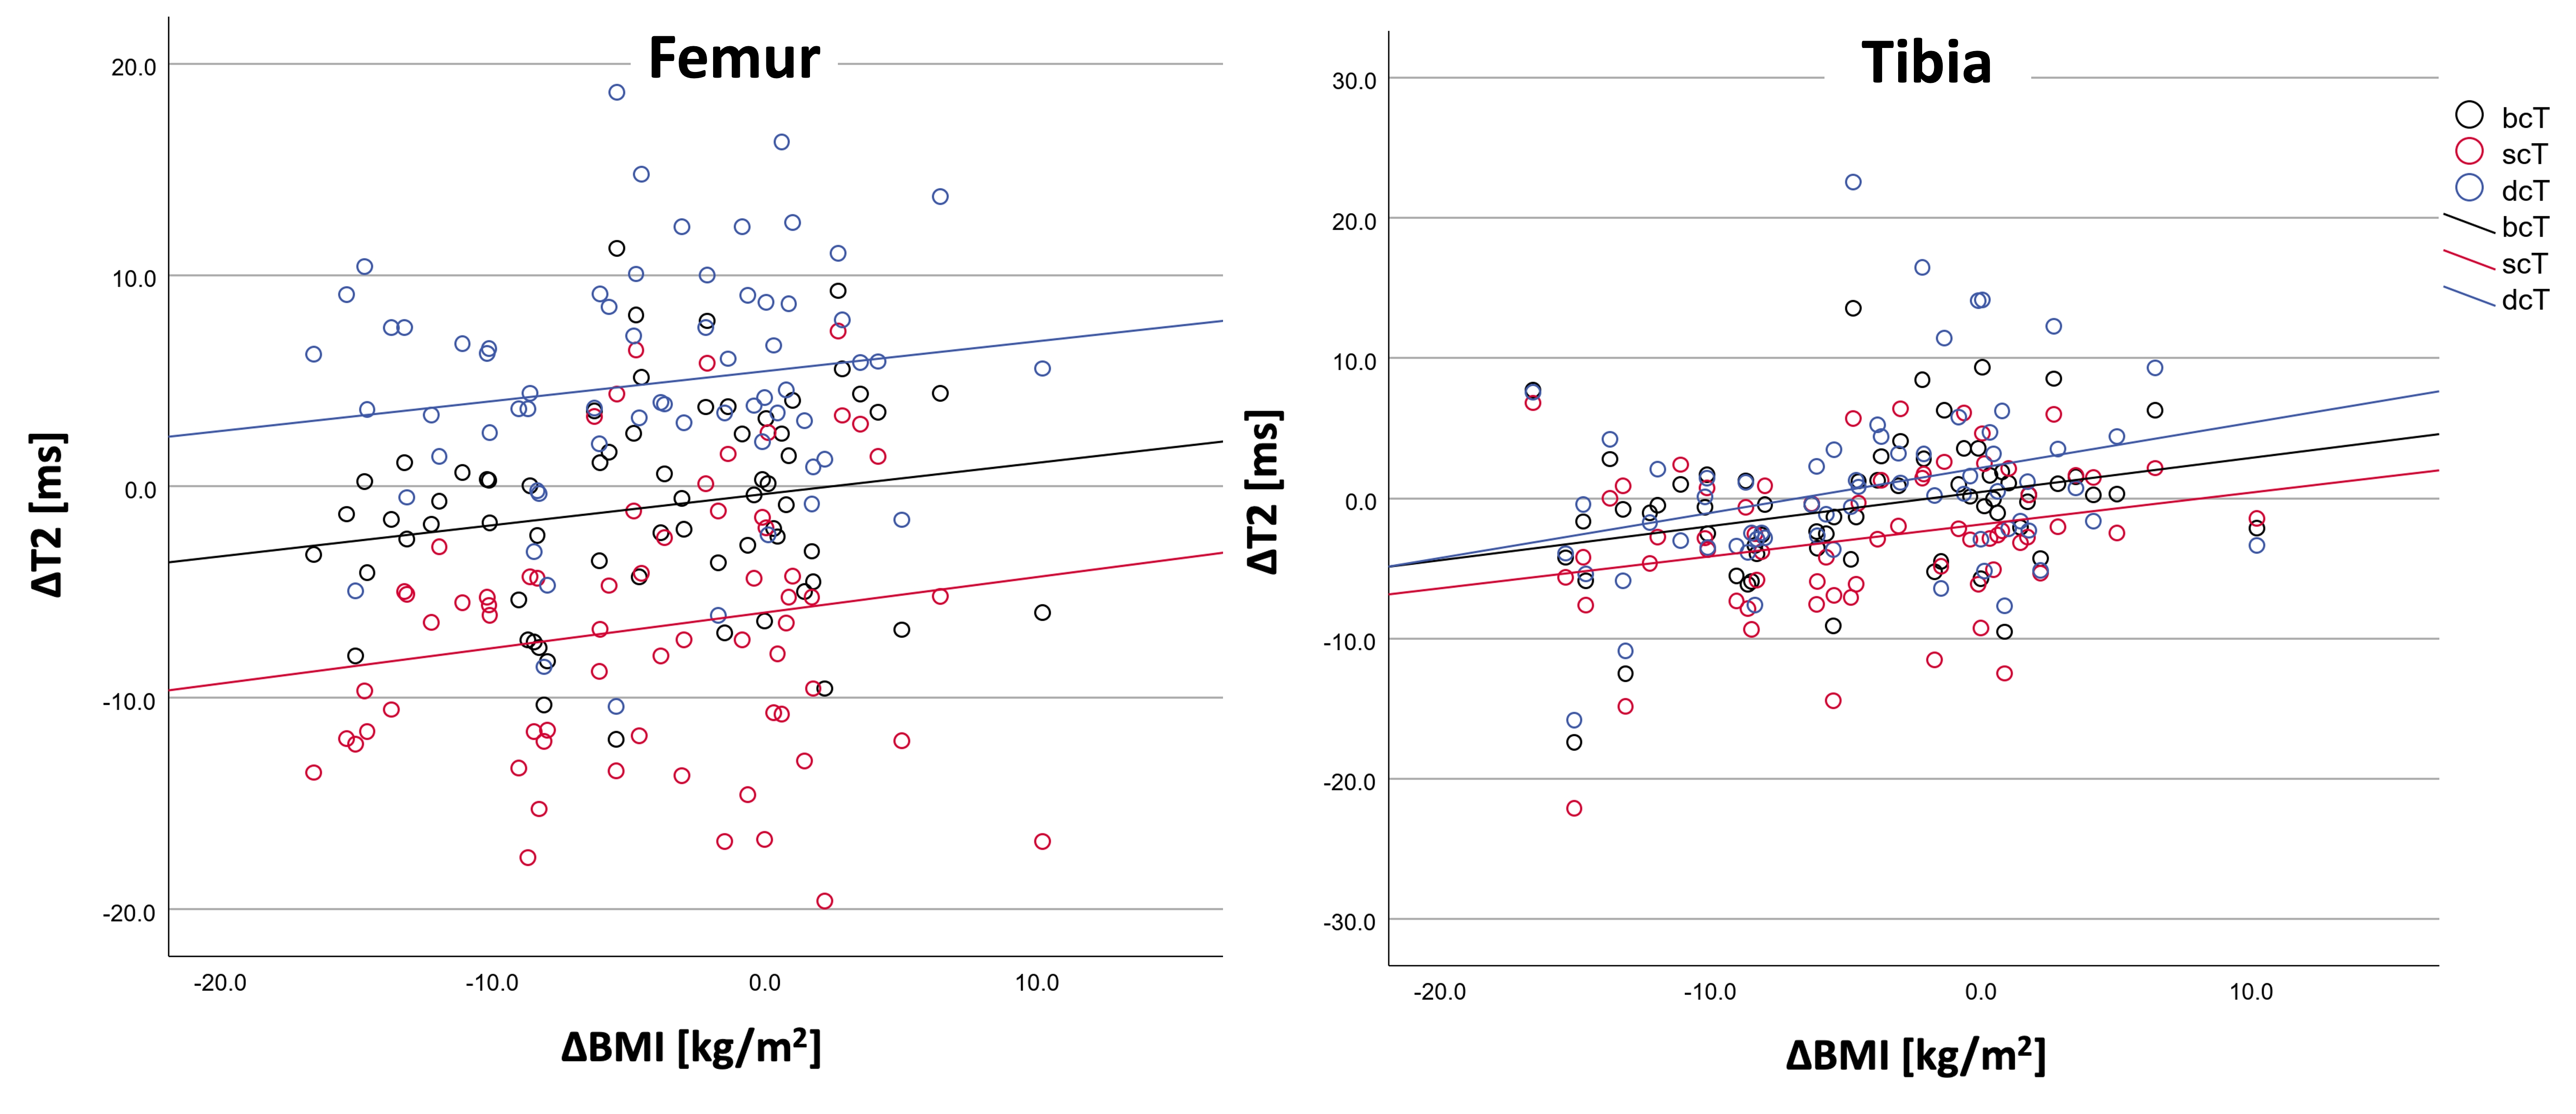
Figure 4: Scatterplots of the relatioship between T2 change [ms] and BMI change [kg/m2] in different ROIs of femur and tibia in the medial compartment.