0505
MRI-derived Vascular Permeability and Cell Density Habitats for Prediction of Isocitrate Dehydrogenase Mutation in Gliomas1Department of Medical Imaging,, Guangdong Second Provincial General Hospital, Guangzhou, China
Synopsis
Keywords: Tumors (Pre-Treatment), Brain, Glioma, Habitat imaging
Motivation: Accurate preoperative identification of isocitrate dehydrogenase (IDH) mutation is crucial for improving patients’ management in clinical practice. Intratumor heterogeneity in gliomas limits the accurate determination of IDH mutation to some extent.
Goal(s): T1-CE-derived BBB permeability and DWI-derived cell density habitat imaging may enable more precise prediction of IDH mutation by parcellating similar voxels using a clustering method.
Approach: We developed and validated imaging habitats based on T1-CE and DWI to predict IDH mutation by localized mapping of tumor heterogeneity.
Results: The damaged vascular and hypocellular imaging habitat performed best and robust to predict the IDH mutation, and was considered as the sensitive habitat.
Impact: Fully recognizing and exploiting this heterogeneity can contribute to improving the prediction accuracy of IDH mutation status, providing more precise treatment and management strategies, and ultimately improving survival and quality of life.
Introduction
Gliomas are the most common malignant primary brain tumors [1]. Molecular subtypes, such as isocitrate dehydrogenase (IDH), play vital roles in the biological behaviors, treatment response, and clinical outcomes of gliomas [2]. Thus, accurate preoperative prediction of IDH mutation status is extremely valuable for the precise treatment of gliomas. Molecular-level IDH-mutant can reduce blood-brain barrier (BBB) permeability and tumor cell density via multiple mechanisms [3–5]. The IDH status within gliomas is heterogeneous, resulting in non-homogeneous vascular permeability, cell density, and volume ratios in subregions within the tumor, namely, intratumor heterogeneity [6–7], which influences the accurate determination of IDH mutation status in gliomas. As such, a noninvasive, comprehensive, and generalizable heterogeneity assessment method remains urgently warranted in clinical practice to improve the accuracy of IDH mutation prediction. Habitat imaging have been developed to ameliorate the confirmation of IDH mutation by characterizing and quantifying the intratumoral heterogeneity of gliomas, for introducing the ecological habitats in tumors to reflect subregions within tumors with similar biological characteristics, based on the theory that the genomic and phenotypic of tumor heterogeneity can be revealed by medical images [8].T1-weighted contrast-enhanced imaging (T1-CE) and diffusion-weighted imaging (DWI) can be applied to demonstrate BBB permeability and cell density, respectively[9].Materials and Methods
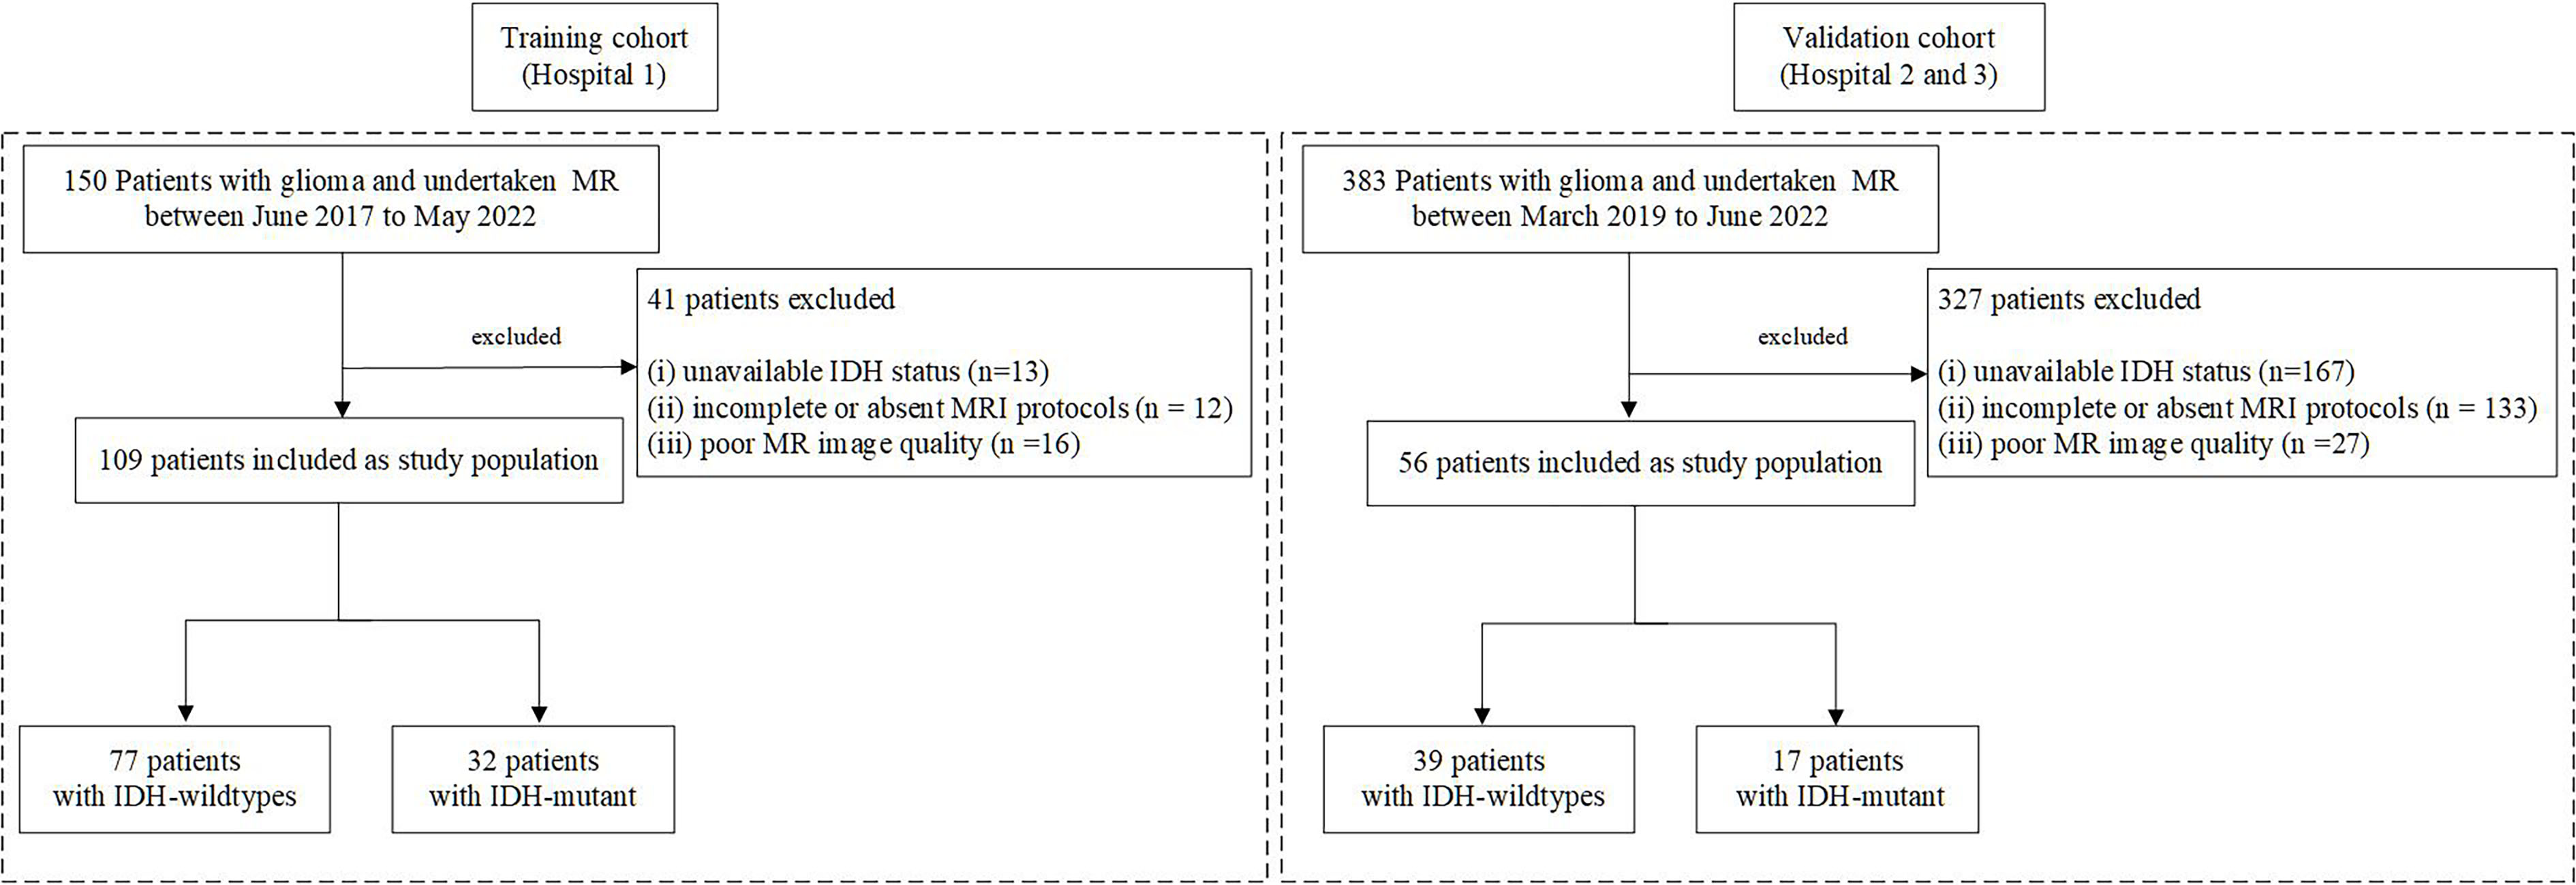
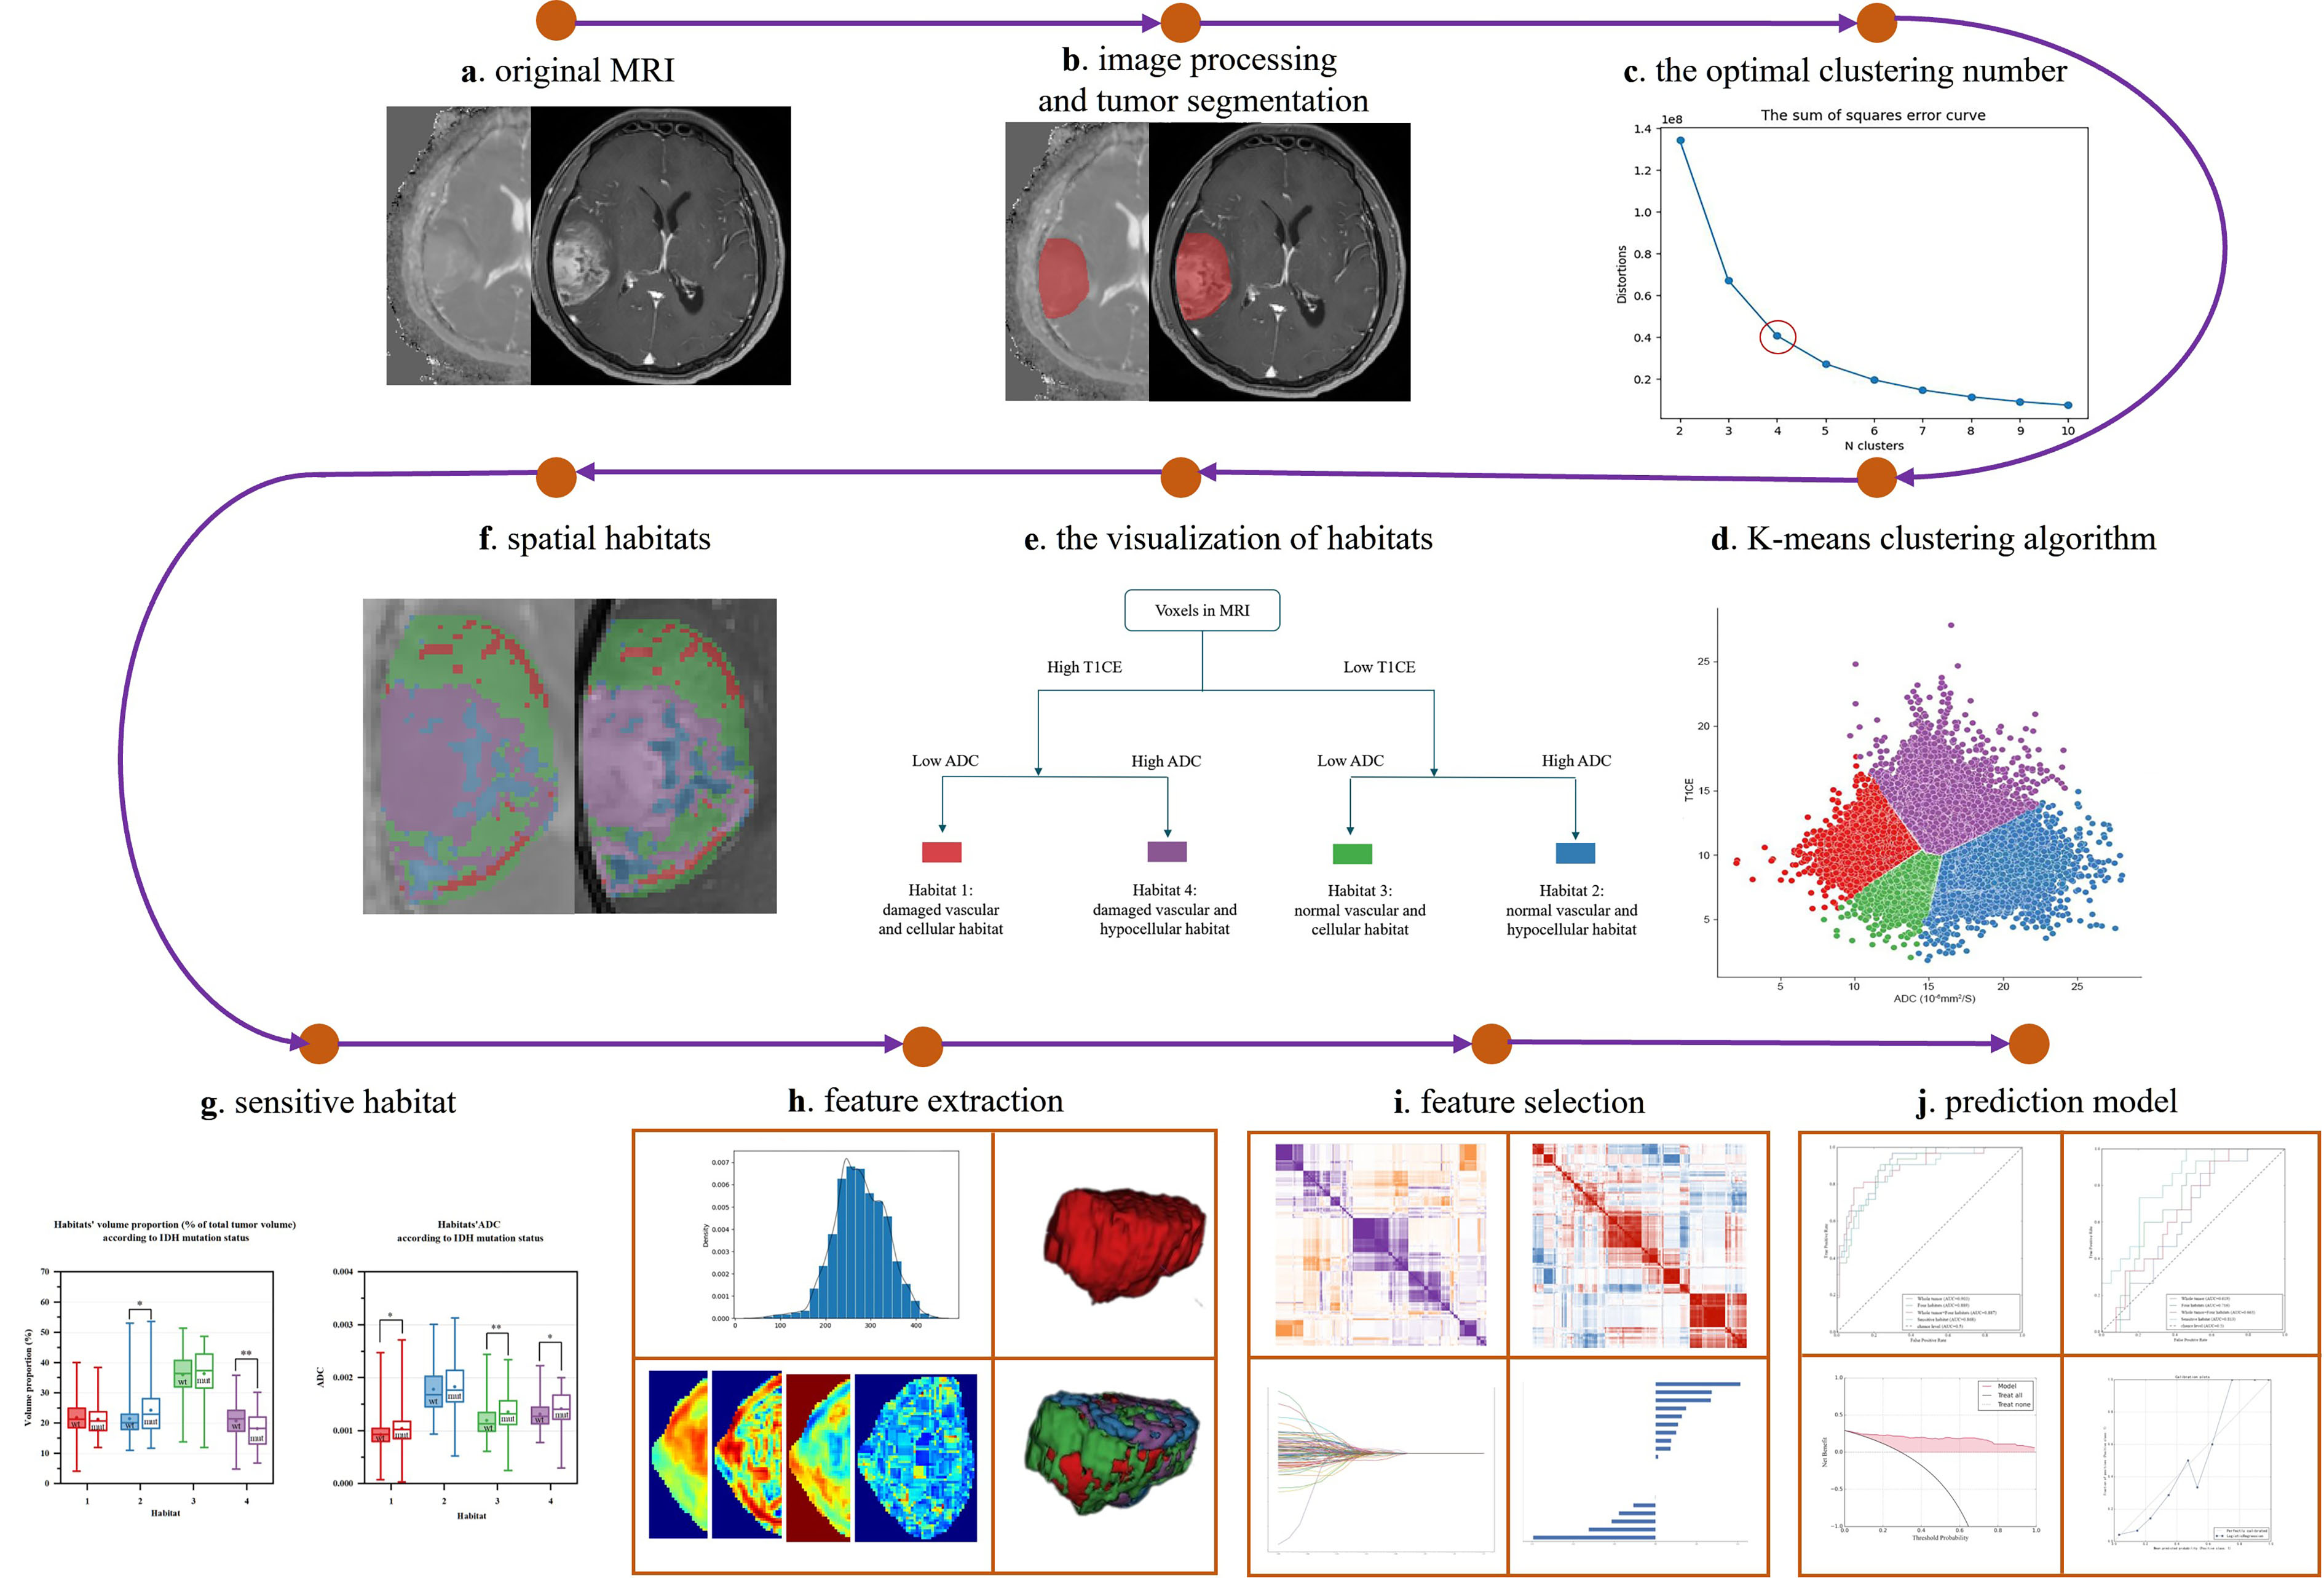
The study was approved by the Medical Ethics Committee of local hospitals (no. 2023-KY-KZ-104-02). A total of 165 pathologically confirmed patients with glioma who underwent preoperative T1-weighted contrast-enhanced imaging (T1CE) and diffusion-weighted imaging (DWI) from three hospitals (109 and 56 in the training and external validation cohorts, respectively) were retrospectively included. The patient enrollment process is illustrated in Fig.1. Four spatial habitats (subregions) based on T1CE and DWI-derived apparent diffusion coefficient images were defined employing k-means voxel-wise clustering. The sensitive habitat of IDH mutation was identified and radiomic features were extracted from the whole tumor and four habitats. Logistic regression classifiers were utilized to construct predictive models for IDH mutation. The data processing pipeline is illustrated in Fig.2.Results:
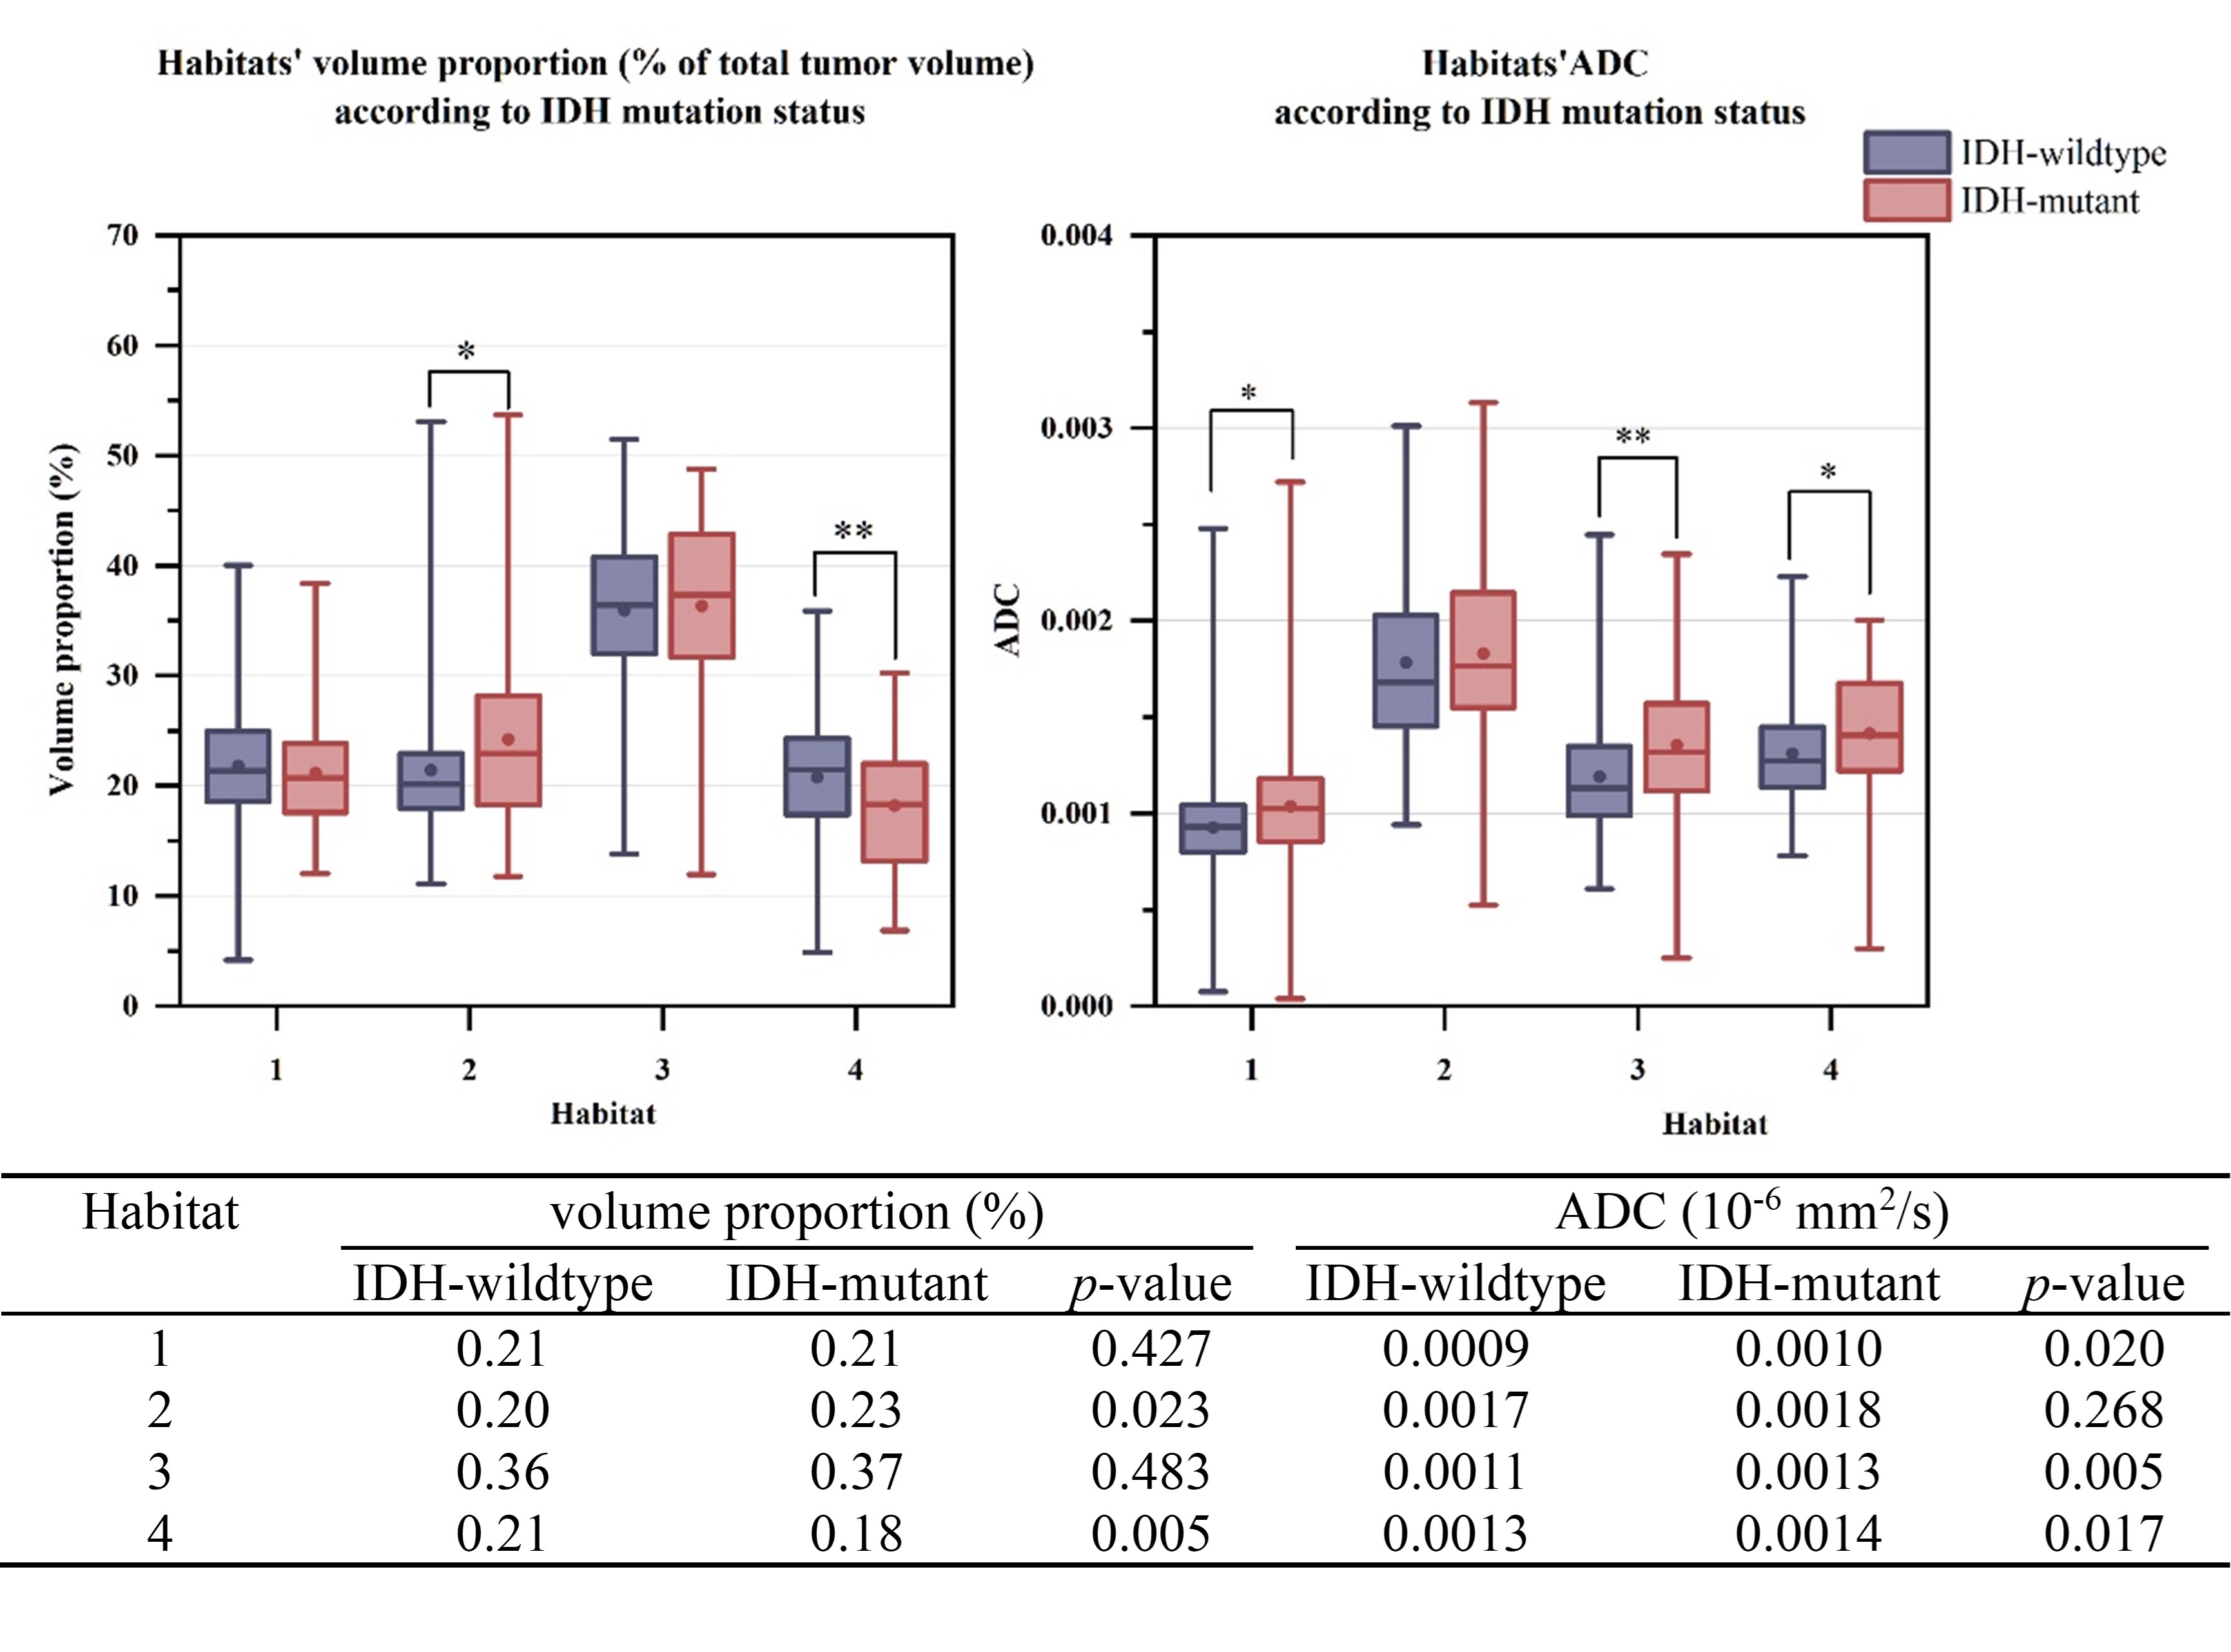
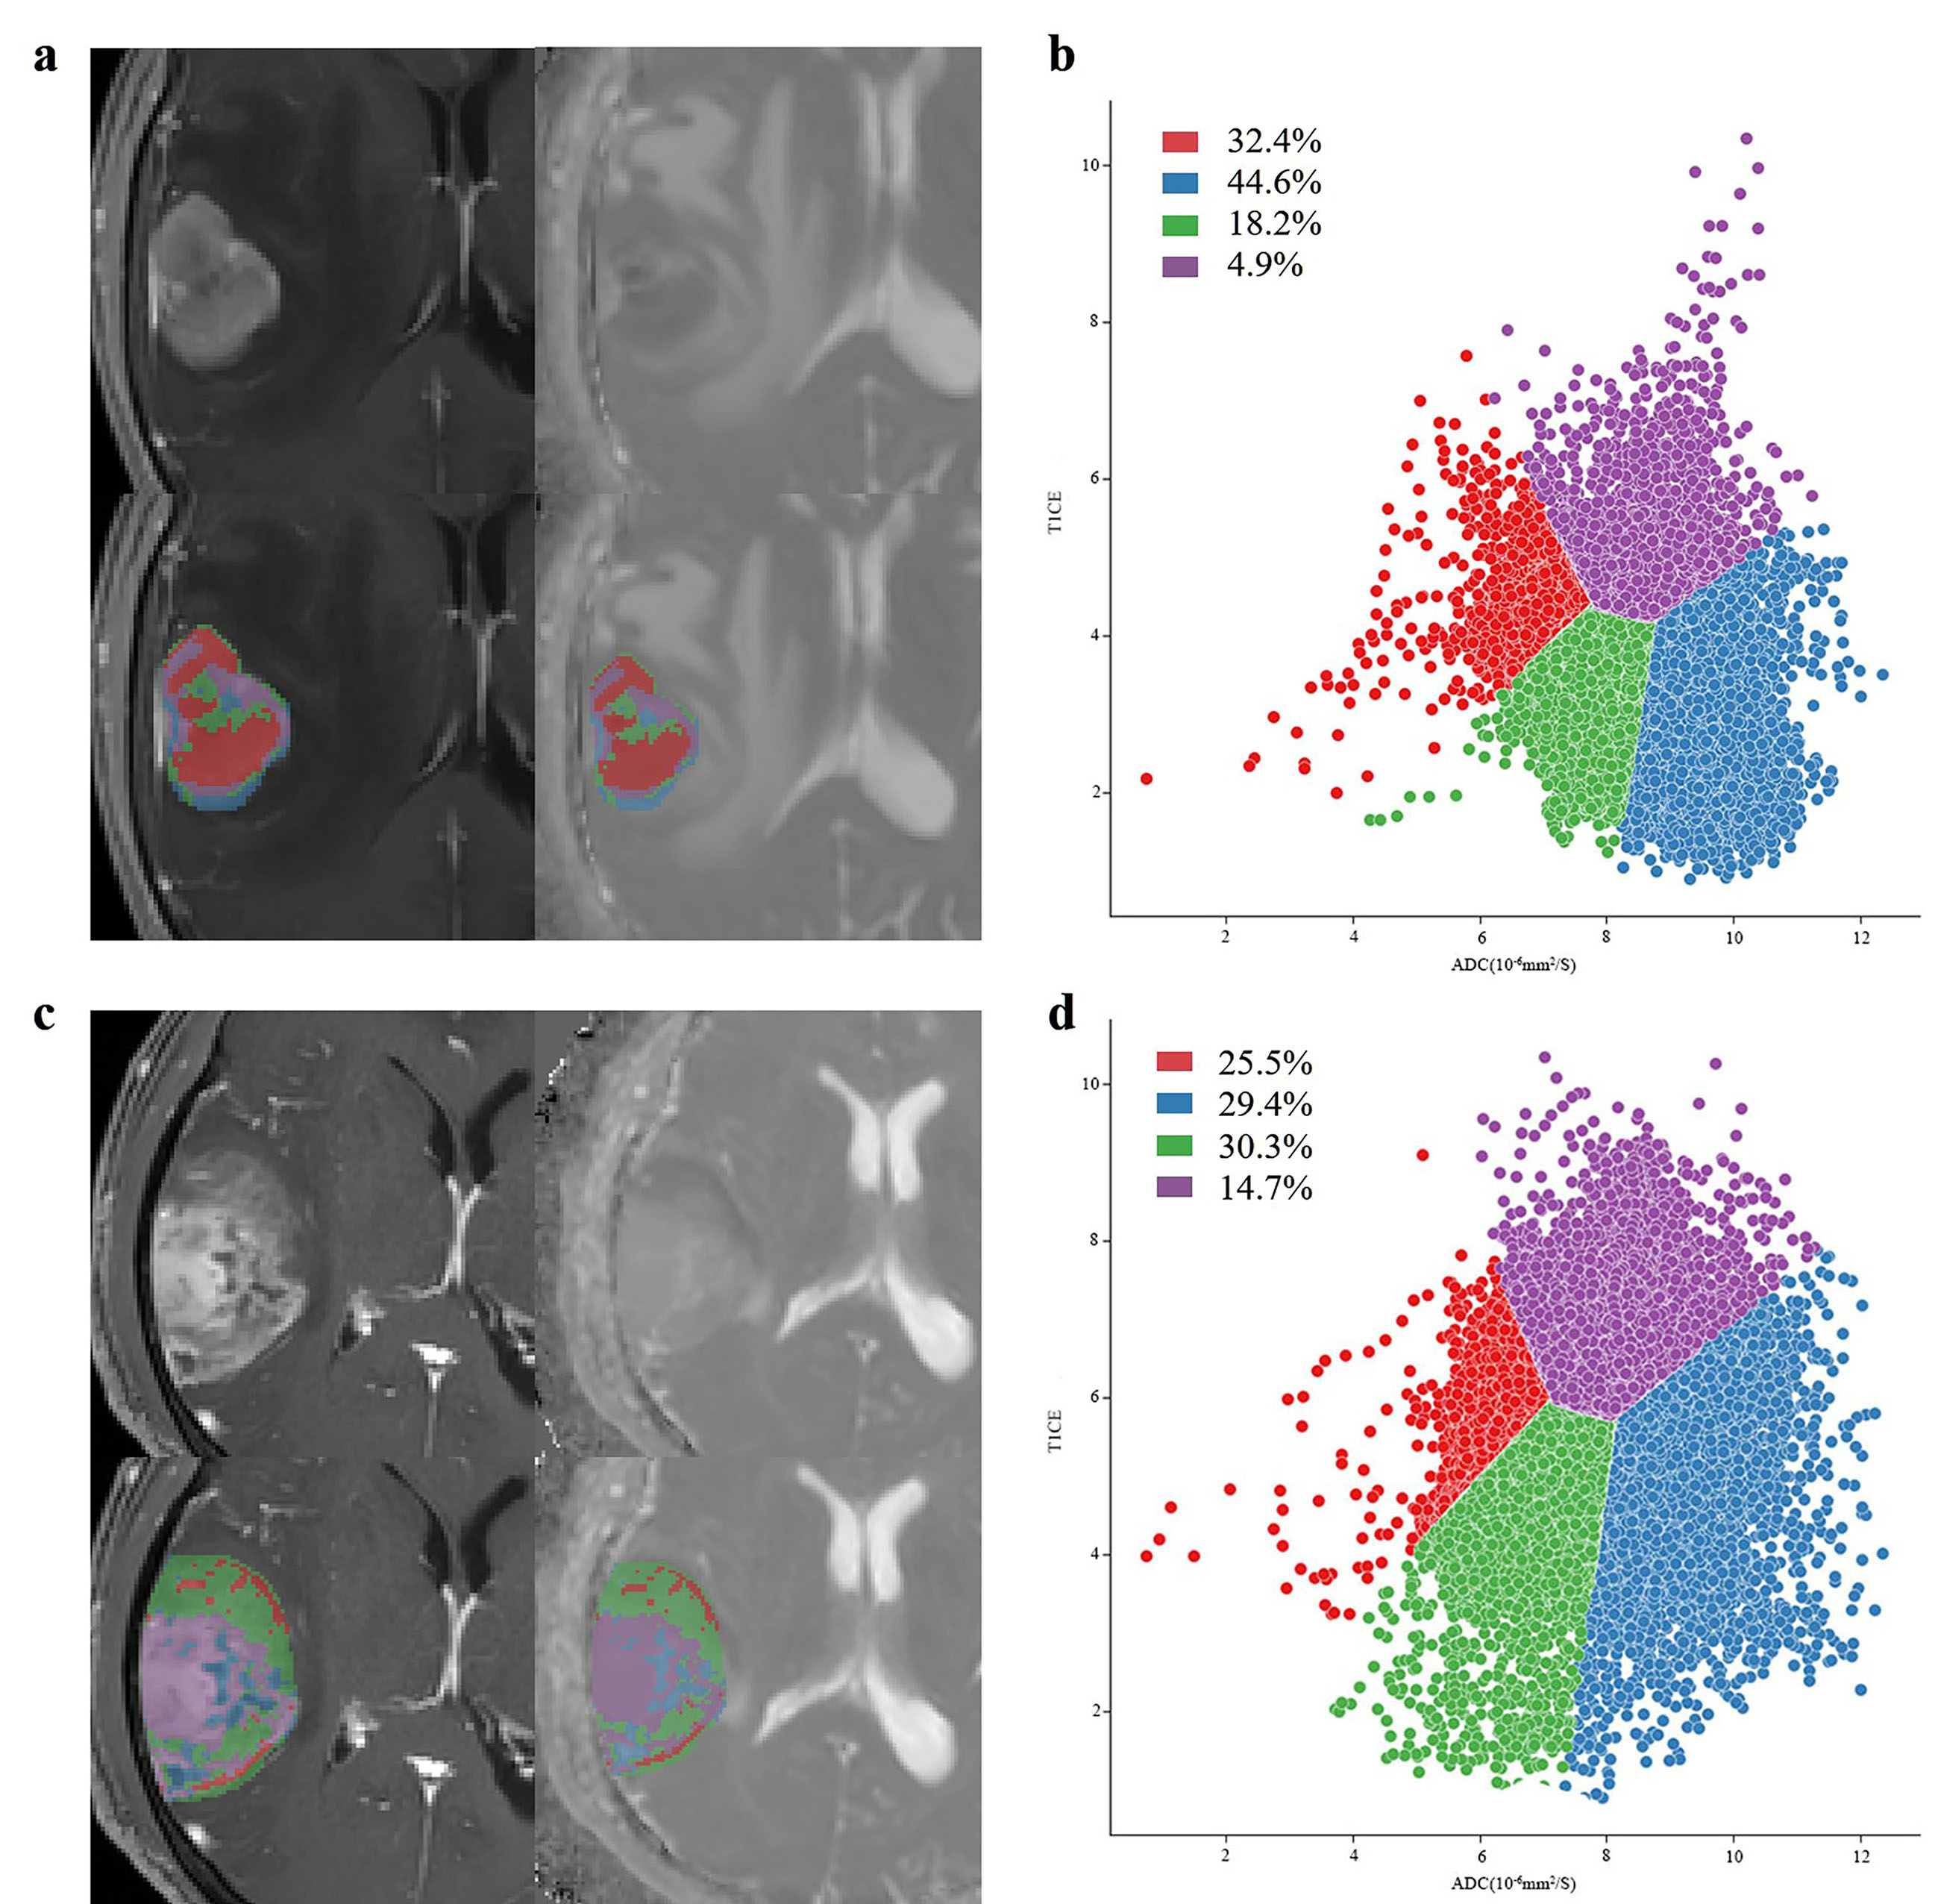
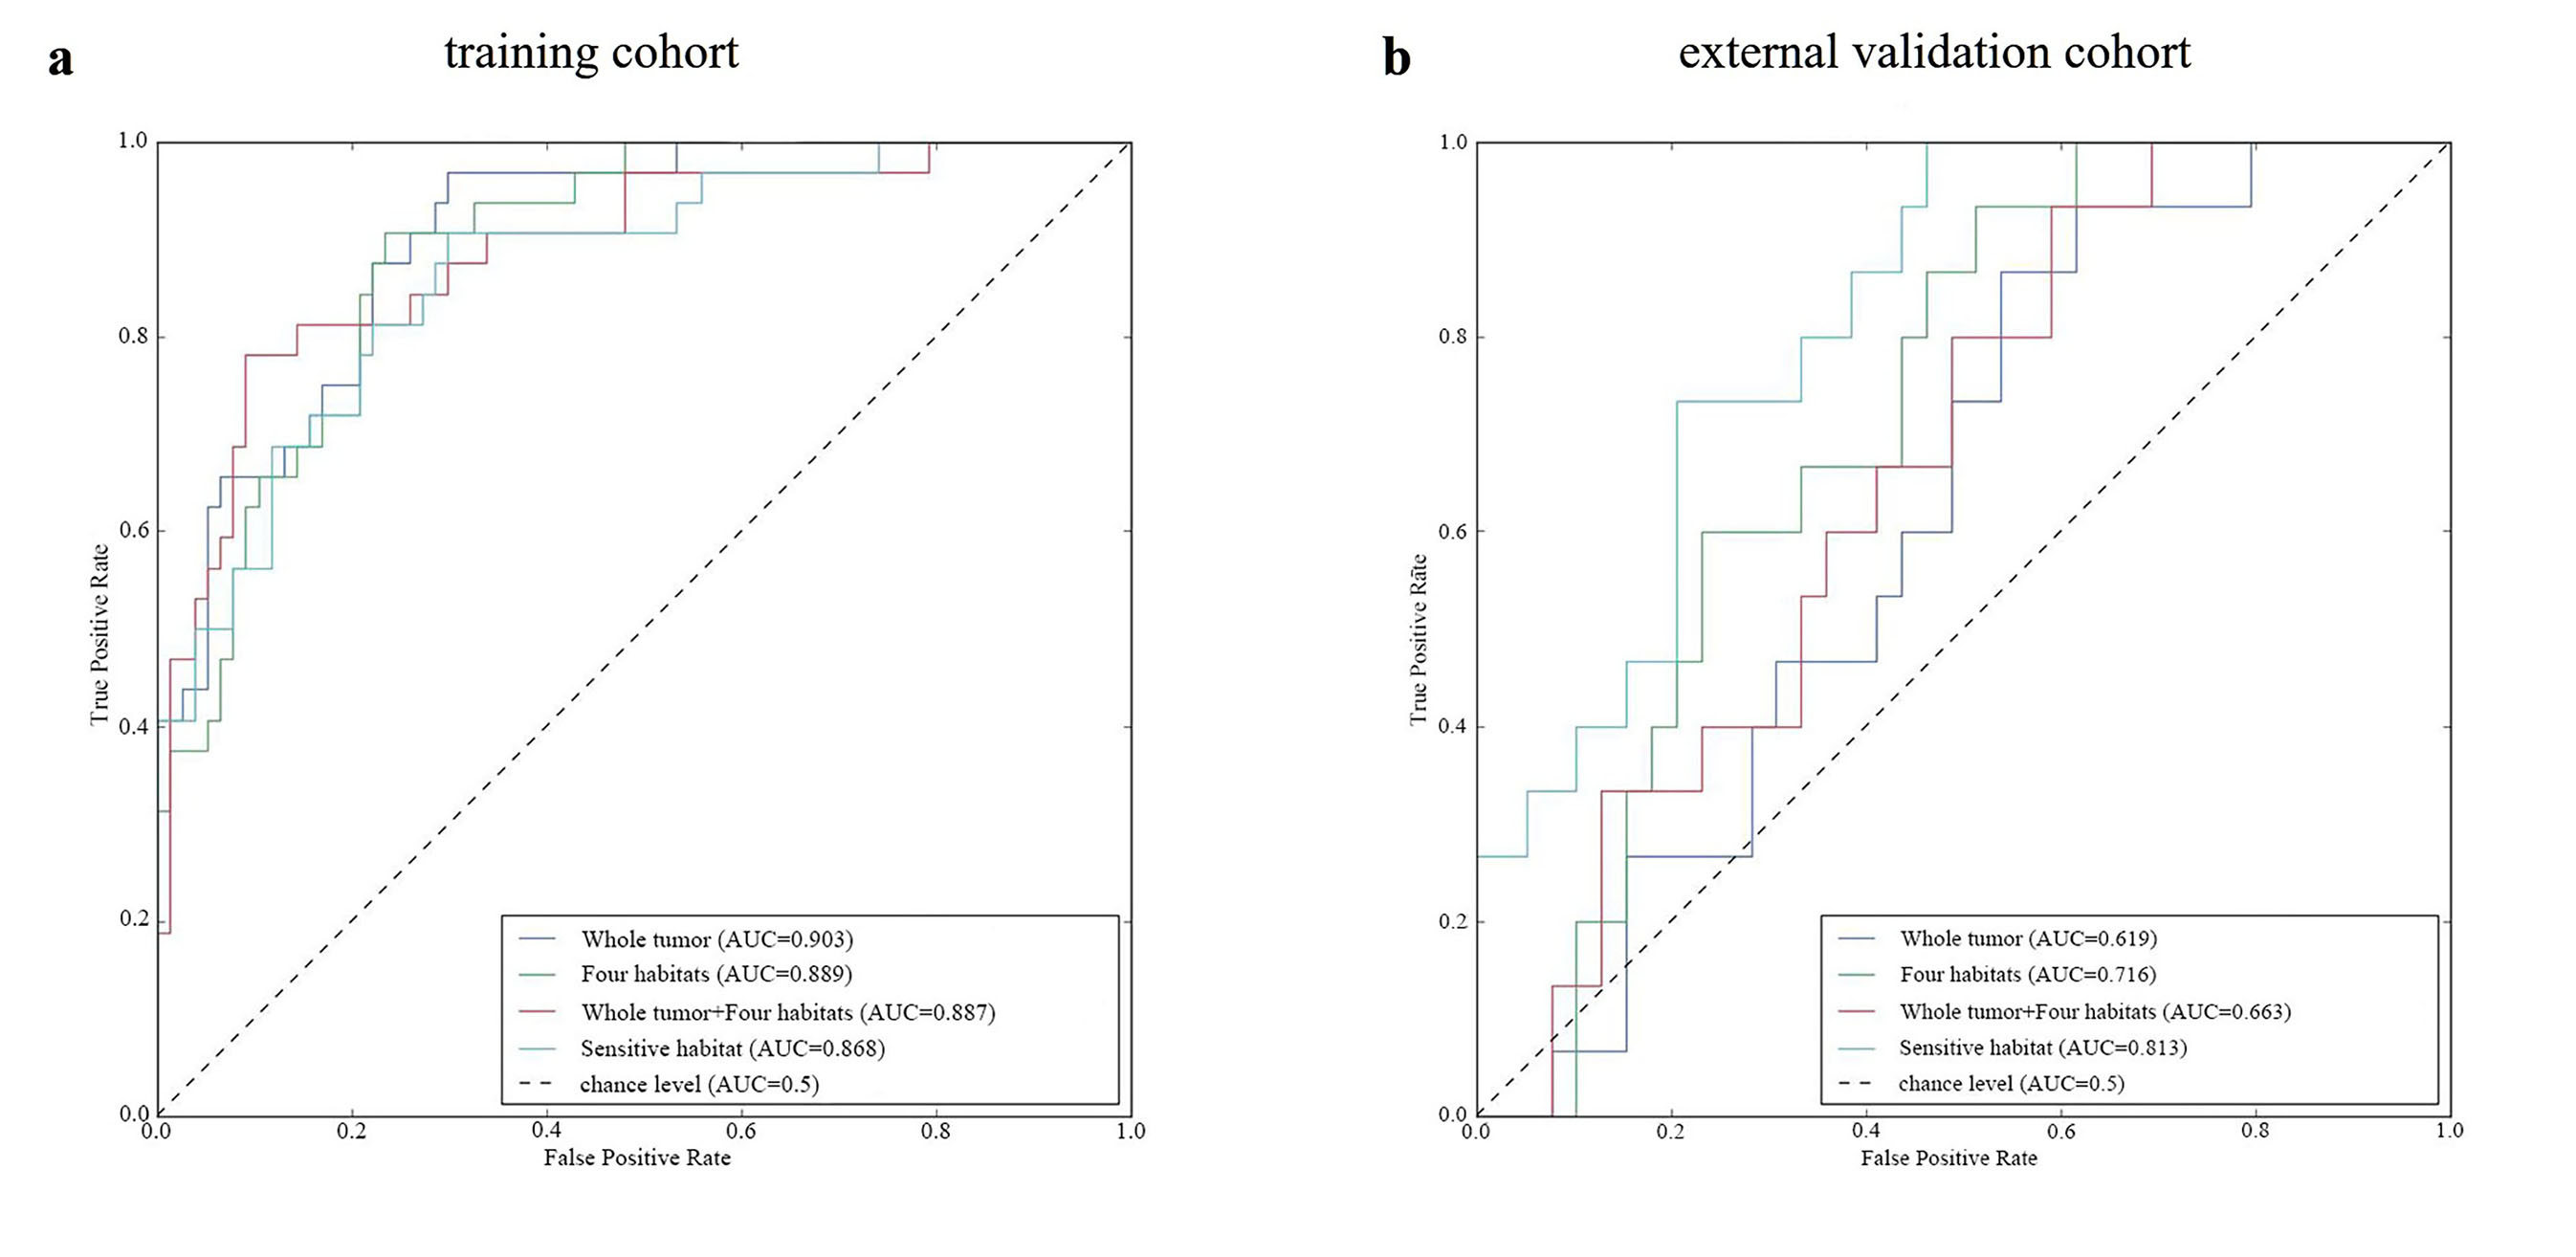
Habitat 1 (red) represents the damaged vascular and cellular habitat with high T1-CE and low ADC values; habitat 2 (blue) represents the normal vascular and hypocellular habitat with low T1-CE and high ADC values; habitat 3 (green) represents the normal vascular and cellular habitat with low T1-CE and low ADC values; habitat 4 (purple) represents the damaged vascular and hypocellular habitat with high T1-CE and high ADC values. Fig. 3 shows the median volume proportion and ADC in the four habitats according to IDH mutation status. The damaged vascular and hypocellular habitat was determined as the sensitive habitat. Two representative cases illustrating MRI vascular permeability and cell density habitats in IDH-wildtype and mutant gliomas are shown in Fig. 4. Fifteen significant radiomic features were selected for the models’ construction. The sensitive habitat model (area under curve [AUC], 0813; 95% confidence interval [CI]: 0.676–0.958) showed significantly better performance than that of the traditional whole tumor model (AUC, 0.619; 95% CI: 0.446–0.792), and better than that of models containing habitat information, which were the four habitats model (AUC, 0.716; 95% CI: 0.553–0.879), and whole tumor + four habitats model (AUC, 0.663; 95% CI: 0.493–0.833). The receiver operating characteristic (ROC) curves for each model are shown in Fig. 5.Discussion:
Accurate and noninvasive prediction of IDH status is desirable to improve patients’ treatment management in clinical practice. Intratumor heterogeneity in gliomas limits the accurate determination of IDH mutation status to some extent. In this study, we mined the bioinformatics from inhomogeneously distributed vessel permeability and cell density due to IDH mutation, employing the MRI habitat analysis on T1-CE and DWI, to improve the predictive accuracy of IDH mutation. We demonstrated that: (i) the damaged vascular and hypocellular imaging habitat alone performed best and robustly to predict the IDH mutation; (ii) the prediction model constructed on the traditional whole tumor model displayed the lowest efficacy to predict IDH mutation status, the predictive performance of the four habitats model slightly improved by 16.1% compared with that of the whole tumor model; (iii) when the whole tumor and four habitats were combined, the predictive power decreased. These results demonstrate that habitats generated from T1-CE-derived vascular habitat and DWI-derived cellular habitat can effectively identify IDH mutation status.Conclusions:
Vascular-cellular habitats based on T1-CE and DWI images showed high prediction capabilities for IDH mutation status in gliomas. The damaged vascular and hypocellular habitat was identified as the sensitive habitat and potential biomarker for IDH mutation. These findings will be beneficial for clinical treatment decision-making and patient-tailored therapy regimens for gliomas.Acknowledgements
We thank all the participants,and National Natural Science Foundation of China (No. 82271948, 82102004), the Key Laboratory Construction Project of the Guangzhou Science and Technology (202201020373), and the National Key Research and Development Project of China (2022YFC2400049).References
1.Ostrom QT, Price M, Neff C, et al (2022) CBTRUS Statistical Report: Primary Brain and Other Central Nervous System Tumors Diagnosed in the United States in 2015–2019. Neuro-Oncology 24: v1–v95. https://doi.org/10.1093/neuonc/noac202
2. Senhaji N, Squalli Houssaini A, Lamrabet S, et al (2022) Molecular and Circulating Biomarkers in Patients with Glioblastoma. IJMS 23:7474. https://doi.org/10.3390/ijms23137474
3.Shih AH, Levine RL (2012) IDH1 Mutations Disrupt Blood, Brain, and Barriers. Cancer Cell 22:285–287. https://doi.org/10.1016/j.ccr.2012.08.022
4. Machida Y, Nakagawa M, Matsunaga H, et al (2020) A Potent Blood–Brain Barrier-Permeable Mutant IDH1 Inhibitor Suppresses the Growth of Glioblastoma with IDH1 Mutation in a Patient-Derived Orthotopic Xenograft Model. Molecular Cancer Therapeutics 19:375–383. https://doi.org/10.1158/1535-7163.MCT-18-1349
5. Salamanca-Cardona L, Shah H, Poot AJ, et al (2017) In Vivo Imaging of Glutamine Metabolism to the Oncometabolite 2-Hydroxyglutarate in IDH1/2 Mutant Tumors. Cell Metabolism 26:830-841.e3. https://doi.org/10.1016/j.cmet.2017.10.001
6. Yu K, Hu Y, Wu F, et al (2020) Surveying brain tumor heterogeneity by single-cell RNA-sequencing of multi-sector biopsies. Natl Sci Rev 7:1306–1318. https://doi.org/10.1093/nsr/nwaa099
7. Venteicher AS, Tirosh I, Hebert C, et al (2017) Decoupling genetics, lineages, and microenvironment in IDH-mutant gliomas by single-cell RNA-seq. Science 355: eaai8478. https://doi.org/10.1126/science.aai8478
8. Chiu F-Y, Yen Y (2023) Imaging biomarkers for clinical applications in neuro-oncology: current status and future perspectives. Biomark Res 11:35. https://doi.org/10.1186/s40364-023-00476-7
9. Kim JY, Park JE, Jo Y, et al (2019) Incorporating diffusion- and perfusion-weighted MRI into a radiomics model improves diagnostic performance for pseudoprogression in glioblastoma patients. Neuro-Oncology 21:404–414. https://doi.org/10.1093/neuonc/noy133
Figures