0503
Ultrafast Deep Learning vs. Wave-CAIPI 3D FLAIR for Clinical Evaluation and Quantitative Assessment of White Matter Lesions1Athinoula A. Martinos Center for Biomedical Imaging, Massachusetts General Hospital, Boston, MA, United States, 2Department of Radiology, Harvard Medical School, Boston, MA, United States, 3Siemens Healthcare GmbH, Erlangen, Germany, 4Siemens Medical Solutions, Boston, MA, United States, 5Harvard-MIT Division of Health Sciences and Technology, Massachusetts Institute of Technology, Cambridge, MA, United States
Synopsis
Keywords: Multiple Sclerosis, Neuro
Motivation: Deep learning (DL) reconstructions show promise in accelerating MRI yet have not been extensively validated clinically, particularly for 3D sequences.
Goal(s): To evaluate the diagnostic quality of DL-based 3D FLAIR compared to Wave-CAIPI-accelerated FLAIR in a clinical setting.
Approach: This prospective study included 26 patients undergoing evaluation for demyelinating disease with Wave-CAIPI-FLAIR and a resolution-matched 6-fold-under-sampled Cartesian FLAIR acquisition with DL reconstruction.
Results: DL-FLAIR reduced scan time (1:53 vs. 2:50) and showed better image quality with higher SNR/CNR, greater lesion conspicuity, and reduced noise compared to Wave-CAIPI-FLAIR, with high agreement in lesional and regional brain volumes between both methods.
Impact: Deep learning reconstruction of 3D-FLAIR provides 30% less acquisition time and improved subjective image quality compared to a state-of-the-art accelerated technique. The excellent agreement in quantitative lesion and regional brain volumes suggests robustness for use in clinical and research studies.
Introduction
Three-dimensional fluid-attenuated inversion recovery (FLAIR) imaging plays an important role in the diagnosis and monitoring of demyelinating diseases1-4 but has traditionally been limited by extended scan durations. Accelerated imaging techniques such as Wave-CAIPI can expedite 3D image acquisition by up to an order of magnitude but encounter limits in the degree of acceleration that can be achieved5–8. Deep learning offers much promise and potential for improving imaging efficiency, patient experience, and diagnostic confidence9. The goal of this work was to validate a recently developed deep learning (DL) reconstruction technique that utilizes variational network and super-resolution algorithm and evaluate its clinical performance against state-of-the-art accelerated Wave-CAIPI-FLAIR both quantitatively and qualitatively.Methods
Deep learning frameworkA two-step deep learning-based image reconstruction was employed. The first step, inspired by unrolled variational networks10, reconstructed images from undersampled k-space data and coil sensitivity maps. This process involved six iterations alternating between data consistency updates and neural network evaluation. Implementation in PyTorch11 and training with 5000 pairs of 500 fully sampled 3D datasets from healthy volunteers was carried out on 1.5 and 3T scanners (MAGNETOM scanners, Siemens Healthcare, Erlangen, Germany). The resulting network was integrated into the scanner's reconstruction pipeline using ONNX Runtime, processing in approximately 15 seconds. The second step involved a super-resolution algorithm for further enhancement12, 13. Both steps were seamlessly integrated for prospective use in the scanner's reconstruction pipeline.
Data acquisition
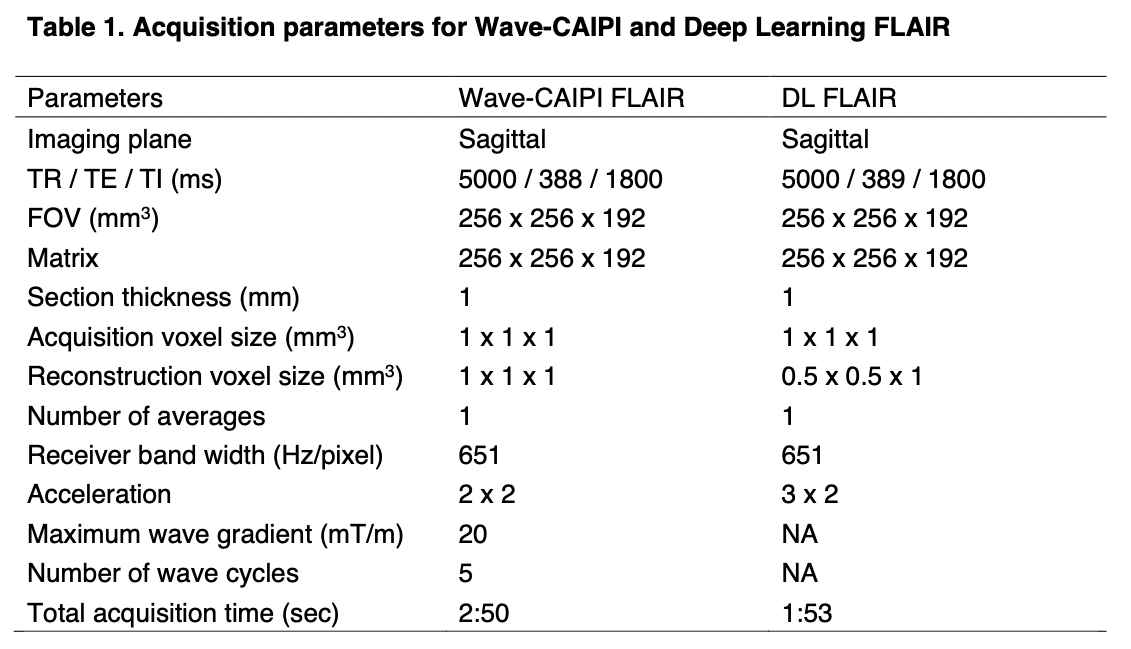
This prospective study was approved by the institutional review board. A single academic imaging center enrolled 26 consecutive patients undergoing brain MR imaging for routine clinical work-up or surveillance of multiple sclerosis (MS). For each participant, two 3D-FLAIR protocols with Sampling Perfection with Application-optimized Contrasts using different flip angle evolution (SPACE)14 were acquired: (1) Wave–controlled aliasing in parallel imaging (Wave-CAIPI) and (2) a research application DL, as detailed in Table 1. The Wave-CAIPI technique has been clinically validated15 and represents a state-of-the-art technique for rapid 3D clinical imaging. All data was acquired at 3-T system (MAGNETOM Vida, Siemens Healthcare, Erlangen, Germany) with a 20-channel head-neck coil.
Quantitative evaluation
Lesion segmentation was conducted using the Lesion Segmentation Tool (LST) on SPM16 and manually edited by a neuroradiologist. Signal-to-noise ratio (SNR) was calculated by dividing the signal intensity of the of the normal-appearing white matter (NAWM) by its standard deviation (SD). Additionally, the contrast-to-noise ratio (CNR) was assessed by subtracting the signal intensity of the contralateral NAWM from that of the WM lesion, with the resulting value divided by the SD of the NAWM. Brain segmentation was performed using Synthseg17 on Freesurfer v7.4.118, focusing on the total brain, cortical grey matter (GM), and WM volumes, adhering to the recommendations outlined in the MAGNIMS consensus guidelines1.
Qualitative (visual) evaluation
Head-to-head comparison of Wave-CAIPI- and DL-FLAIR images was performed by a board-certified neuroradiologist. Evaluations were based on a previously published scale15 and focused on the following aspects: (a) overall image quality, (b) lesion conspicuity, (c) noise, (d) motion, and (e) artifacts.
Statistical analysis
The Wilcoxon signed-rank test was applied to assess the SNR and CNR. Agreement of lesion counts and volumes based on Wave-CAIPI and DL was evaluated using two-way random-effects models of intraclass correlation coefficients (ICCs), linear regression, and Bland-Altman analysis.
Results
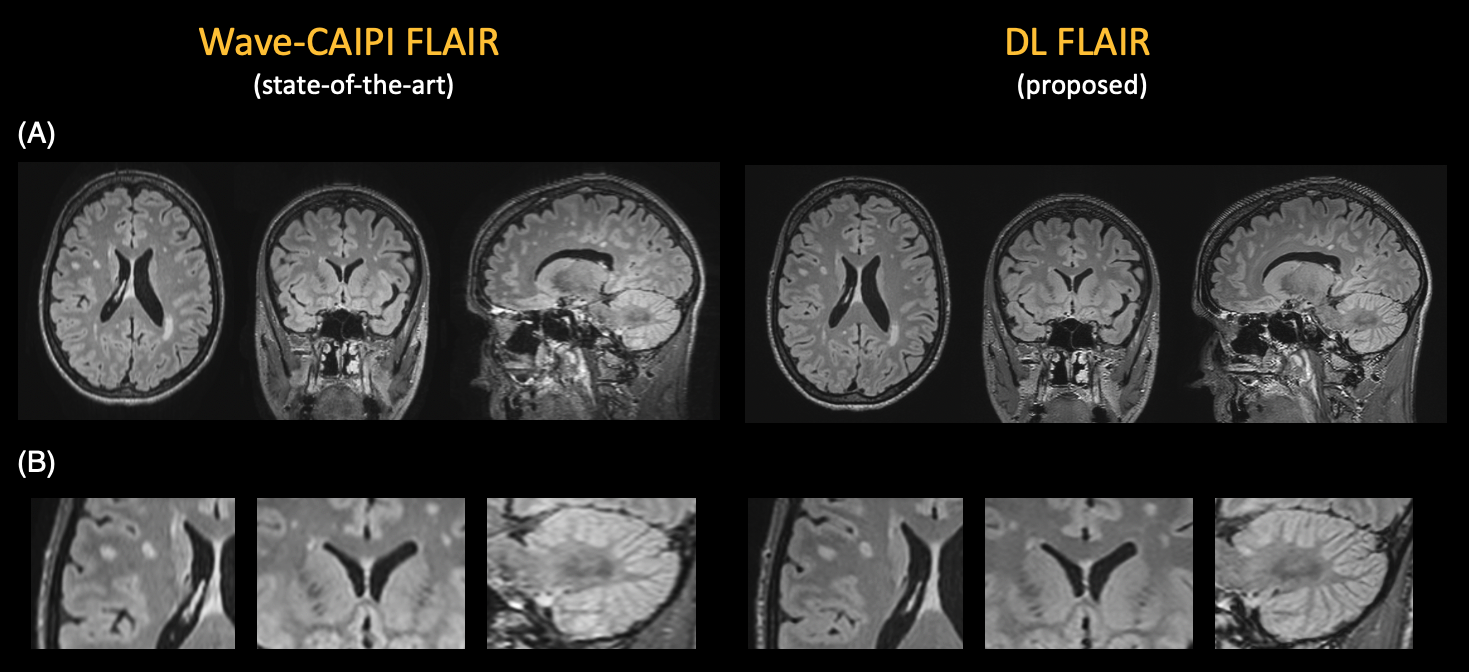
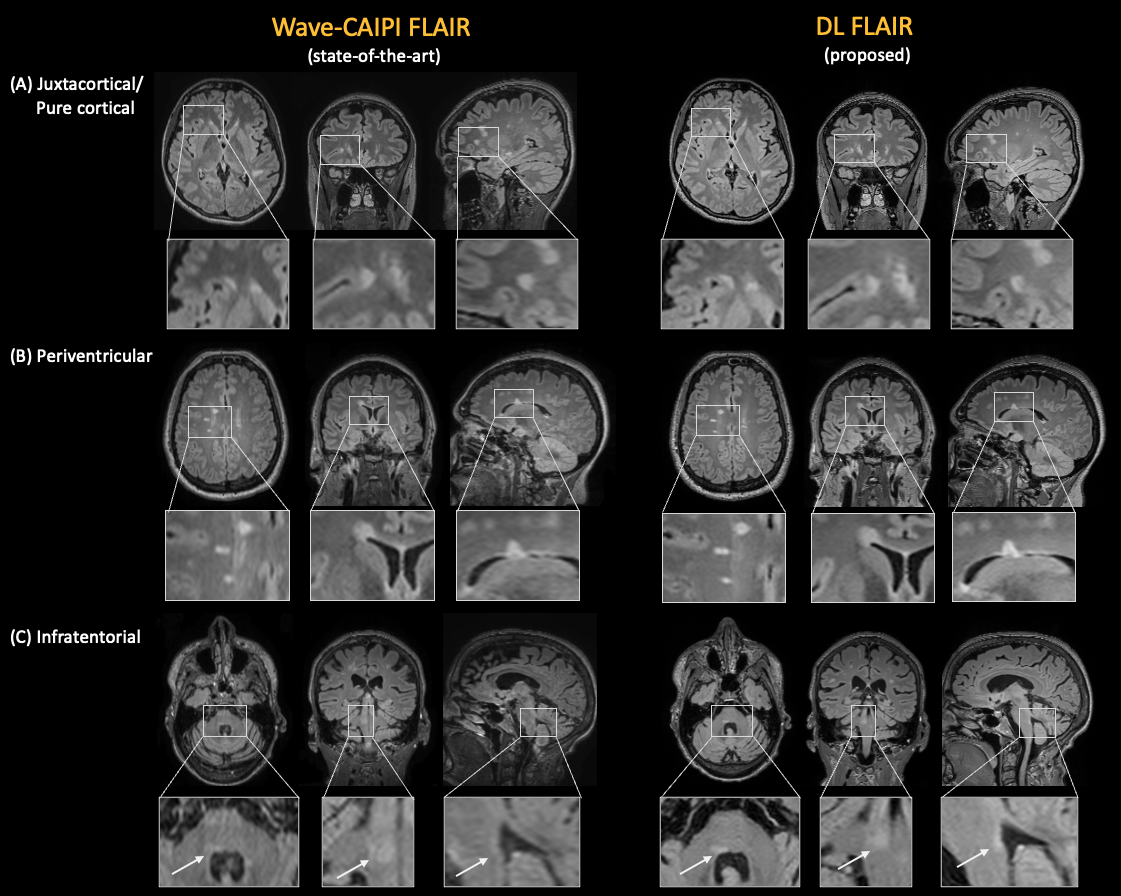
26 patients (20 women, 45±13 years) were recruited. 16 (62%) were diagnosed with MS or another demyelinating disorder. Figure 1 shows a representative case with multiple sclerosis. Figure 2 shows lesion depiction in representative cases.Quantitative evaluation
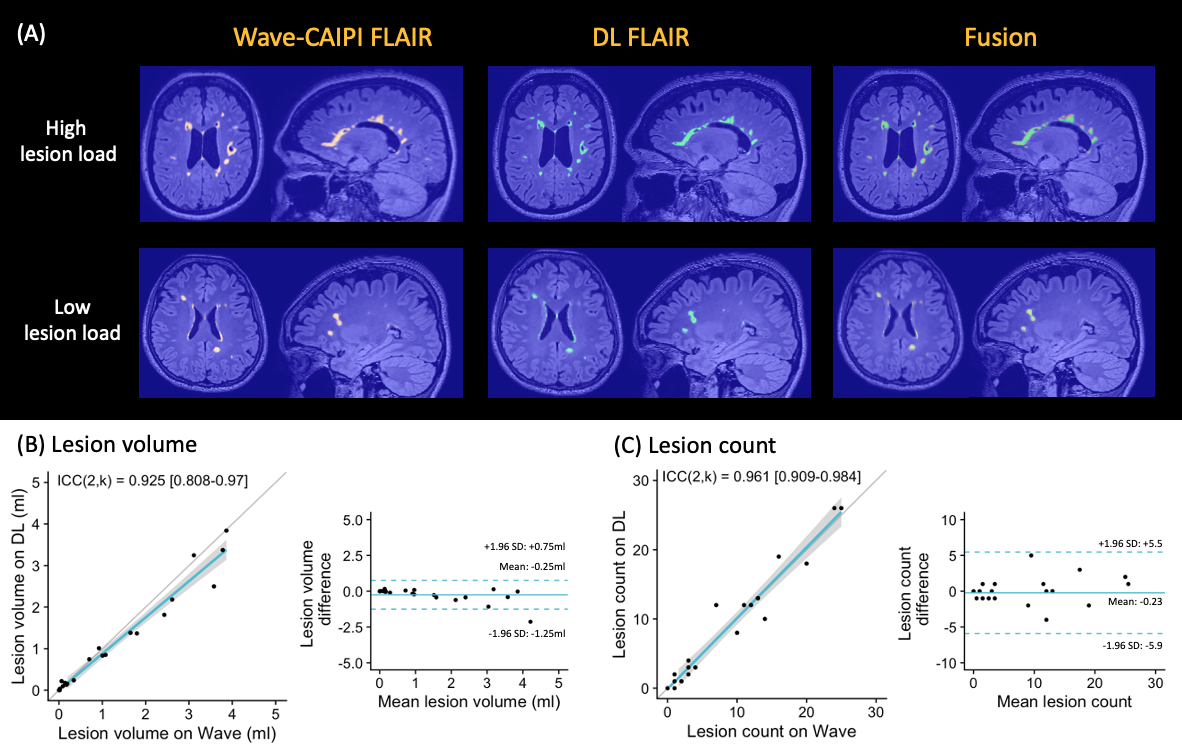
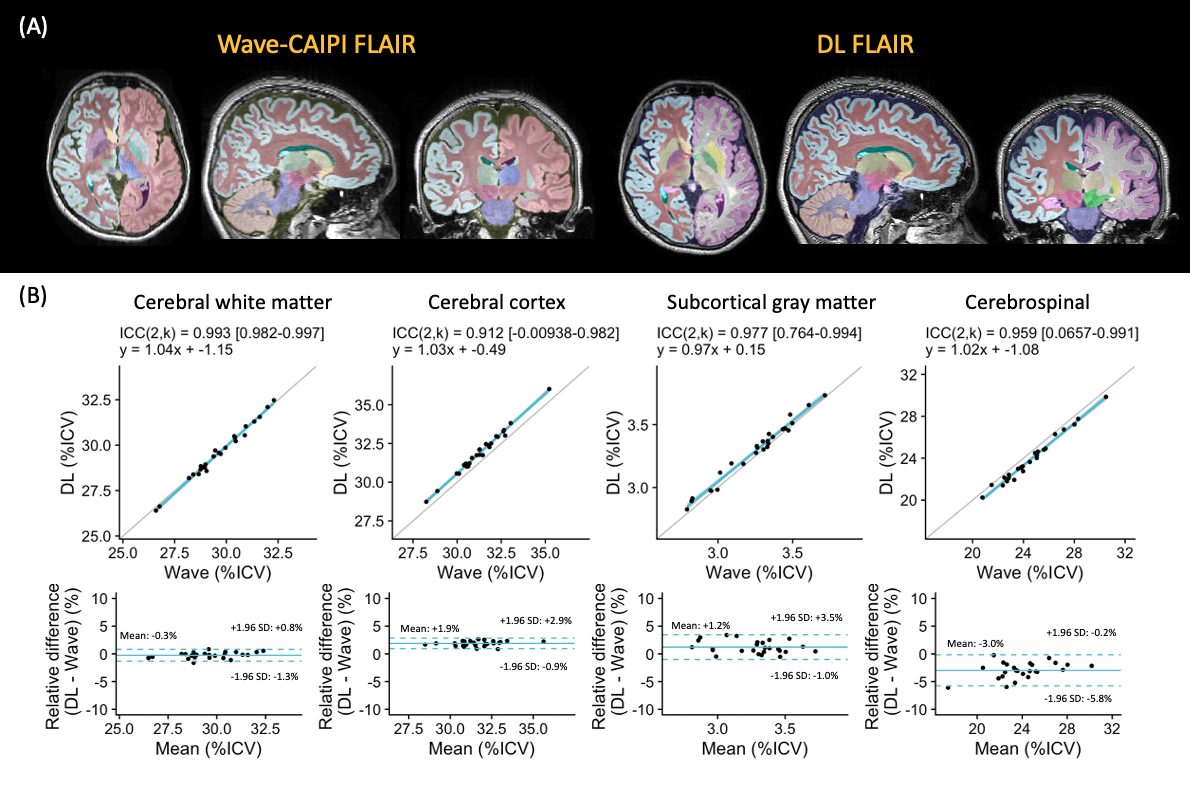
Figures 3 and 4 summarize lesion volume and brain segmentation based on Wave-CAIPI and DL FLAIR. Lesion volume and count showed high agreement between the two methods (ICC(2,k) = 0.93 and 0.96, respectively). SNR and CNR were both higher on DL compared to Wave-CAIPI-FLAIR (35.7 vs. 25.7, p=.0016; 24.1 vs. 11.7, p=.0042, respectively). DL FLAIR also demonstrated excellent agreement in brain region volume (ICC(2,k) ranging from 0.91 to 0.99) despite approximately 30% less scan time.
Qualitative (visual) evaluation
DL FLAIR showed significantly superior overall image quality, lesion conspicuity, and noise compared to Wave-CAIPI-FLAIR (all p<0.001). There were no significant differences in motion (p=0.33) or artifact (p=0.45).
Discussion
Although Cartesian encoding was employed in this study, integrating more advanced encodings, such as wave-encoding, with physics-informed deep learning reconstruction schemes may further improve acquisition efficiency and image quality.Conclusion
Deep learning reconstruction of 3D-FLAIR provided 30% acquisition time savings and improved image quality compared to a state-of-the-art accelerated technique, while also showing excellent agreement in quantitative lesion and regional brain volume estimation, suggesting the robustness of this method for use in clinical and research studies.Acknowledgements
This work was supported by a research grant from Siemens Healthineers.References
- Wattjes MP, Ciccarelli O, Reich DS, et al.: 2021 MAGNIMS-CMSC-NAIMS consensus recommendations on the use of MRI in patients with multiple sclerosis. Lancet Neurol 2021; 20:653–670.
- Filippi M, Preziosa P, Banwell BL, et al.: Assessment of lesions on magnetic resonance imaging in multiple sclerosis: practical guidelines. Brain 2019; 142:1858–1875.
- Rovira À, Wattjes MP, Tintoré M, et al.: Evidence-based guidelines: MAGNIMS consensus guidelines on the use of MRI in multiple sclerosis-clinical implementation in the diagnostic process. Nat Rev Neurol 2015; 11:471–482.
- Traboulsee A, Simon JH, Stone L, et al.: Revised recommendations of the consortium of MS centers task force for a standardized MRI protocol and clinical guidelines for the diagnosis and follow-up of multiple sclerosis. AJNR Am J Neuroradiol 2016; 37:394–401.
- Polak D, Cauley S, Huang SY, et al.: Highly-accelerated volumetric brain examination using optimized wave-CAIPI encoding. J Magn Reson Imaging 2019; 50:961–974.
- Bilgic B, Gagoski BA, Cauley SF, et al.: Wave-CAIPI for highly accelerated 3D imaging. Magn Reson Med2015; 73:2152–2162.
- Kiryu S, Akai H, Yasaka K, et al.: Clinical impact of deep learning reconstruction in MRI. Radiographics2023; 43.
- Akcakaya M, Doneva MI, Prieto C: Magnetic Resonance Image Reconstruction: Theory, Methods, and Applications. Elsevier Science; 2022.
- van Leeuwen KG, de Rooij M, Schalekamp S, van Ginneken B, Rutten MJCM: How does artificial intelligence in radiology improve efficiency and health outcomes? Pediatr Radiol 2022; 52:2087–2093.
- Hammernik K, Klatzer T, Kobler E, et al.: Learning a variational network for reconstruction of accelerated MRI data. Magn Reson Med 2018; 79:3055–3071.
- Paszke A, Gross S, Massa F, et al.: PyTorch: An imperative style, high-performance deep learning library. arXiv [csLG] 2019.
- Afat S, Wessling D, Afat C, et al.: Analysis of a deep learning-based superresolution algorithm tailored to partial Fourier gradient echo sequences of the abdomen at 1.5 T: Reduction of breath-hold time and improvement of image quality. Invest Radiol 2022; 57:157–162.
- Wessling D, Herrmann J, Afat S, et al.: Application of a deep learning algorithm for combined super-resolution and partial Fourier reconstruction including time reduction in T1-weighted precontrast and postcontrast gradient echo imaging of abdominopelvic MR imaging. Diagnostics (Basel) 2022; 12:2370.
- Mugler JP 3rd: Optimized three-dimensional fast-spin-echo MRI. J Magn Reson Imaging 2014; 39:745–767.
- Ngamsombat C, Gonçalves Filho ALM, Longo MGF, et al.: Evaluation of ultrafast Wave-controlled aliasing in parallel imaging 3D-FLAIR in the visualization and volumetric estimation of cerebral white matter lesions. AJNR Am J Neuroradiol 2021; 42:1584–1590.
- Schmidt P, Gaser C, Arsic M, et al.: An automated tool for detection of FLAIR-hyperintense white-matter lesions in Multiple Sclerosis. Neuroimage 2012; 59:3774–3783.
- Billot B, Greve DN, Puonti O, et al.: SynthSeg: Segmentation of brain MRI scans of any contrast and resolution without retraining. Med Image Anal 2023; 86:102789.
- Fischl B: FreeSurfer. Neuroimage 2012; 62:774–781.
Figures