0501
Quantification of the anisotropic biomechanical properties of the lower leg muscles during muscle contraction using MR elastography and DTI1Department of Radiology, Charité - Universitätsmedizin Berlin, Berlin, Germany, 2Institute of Medical informatics, Charité - Universitätsmedizin Berlin, Berlin, Germany, 3Berlin Institute of Health Julius Wolff Institut - Center for Musculoskeletal Biomechanics and Regeneration, Charité - Universitätsmedizin Berlin, Berlin, Germany
Synopsis
Keywords: Elastography, Elastography, MSK, MRE, anisotropic MRE, lower leg muscle,......
Motivation: Determining the in vivo mechanical properties of synergist muscles is challenging.
Goal(s): In this study, we developed an anisotropic inversion method for MR elastography (MRE) to quantify biomechanical parameter changes in lower leg muscles during passive plantarflexion and dorsiflexion.
Approach: Based on DTI and multifrequency MRE in 13 male volunteers, stiffness reconstruction was performed after aligning MRE with DTI coordinate systems. Isotropic shear wave speed (ciso) and anisotropic shear wave speed, parallel (c$$$_{\parallel}$$$) and perpendicular (c$$$_{\perp}$$$) to the fiber orientation were obtained.
Results: Our findings showed significant changes of biophysical properties during muscle movements, particularly c$$$_{\parallel}$$$ and c$$$_{\perp}$$$ are more sensitive than ciso.
Impact: Anisotropic muscle stiffness measured by DTI-MRE provides a consistent biomarker sensitive to changes in muscle structure and alignment altered by passive muscle movements such as plantarflexion and dorsiflexion.
Introduction
MR elastography (MRE) can non-invasively quantify the biomechanical properties of skeletal muscle for the assessment of muscle function and structure. However, biomechanical characterization of skeletal muscle requires knowledge of tissue anisotropy as shaped by the orientation and alignment of muscle fiber bundles1,2,3 . Therefore, we developed an anisotropic inversion method for multifrequency MRE that incorporates the information of fiber orientation provided by diffusion tensor imaging (DTI). This approach sensitized anisotropic biomechanical parameters to changes in lower leg muscle structure during passive movements.Methods
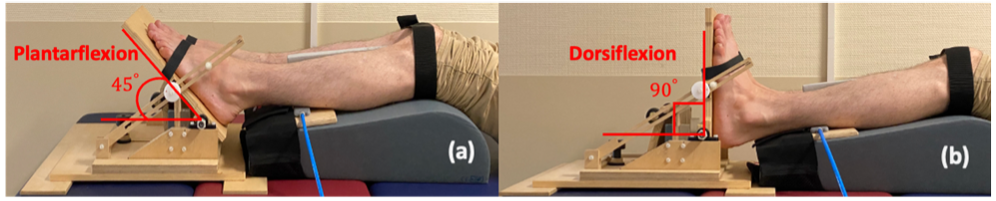
Thirteen male healthy participants (age: 28 years ± 4) were recruited. We investigated three distinct muscle groups in both legs: Tibialis anterior (TibA), Gastrocnemius Medialis (GasM) and Soleus posterior (SolP) using 3T MRI equipped with a 12-channel phased-array surface coil (Siemens Magnetom Lumina). An MRI-compatible device was designed to passively contract muscles at two preset angles: 45° plantarflexion and 90° dorsiflexion (Fig.1). Mechanical vibrations at frequencies of 30, 40 and 50 Hz were sequentially applied to the muscle groups using two compressed-air-powered pads4.We acquired 3D wavefields using a single-shot SE-EPI sequence with a bipolar flow-compensated motion-encoding gradient (MEG). Eight dynamics of shear wave cycle were measured. Thirty slices with 2×2×2 mm3 voxel size were acquired in 4:04 mins. DTI data were obtained with 20 gradient directions at b-values of 0 and 500 s/mm2 in 5:46 mins with image resolution matched to MRE. Subsequently, MRE and DTI data were co-registered.DTI data was processed using FSL and DSI studio5,6,7. For MRE postprocessing, we employed two inversion methods. The first method, known as the isotropic k-MDEV inversion technique8, produced maps of shear wave speed ( ciso in m/s), which served as surrogate marker for isotropic tissue stiffness. Second, we developed a new anisotropic inversion method based on a modified k-MDEV algorithm, that provided shear wave speed values parallel and perpendicular to the muscle fibers, denoted as c$$$_{\parallel}$$$ and c$$$_{\perp}$$$, respectively. For this anisotropic inversion, we firstly aligned the wavefield with the muscle fiber orientation. The polar angles θ and φ for this alignment were derived from DTI tractography, where θ was the angle between the main fiber axis and the z-axis of the scanner coordinate system while φ was the angle in the xy-plane (scanner coordinates) between the main fiber axis and the x-axis. Then, we inverted the reoriented wavefields using directional filters to obtain c$$$_{\parallel}$$$ when the shear wave propagation aligned with the principal fiber axis. Correspondingly, c$$$_{\perp}$$$ was obtained when the waves propagated perpendicular to the fibers. For statistical analysis, we applied the Wilcoxon signed-rank test.Results
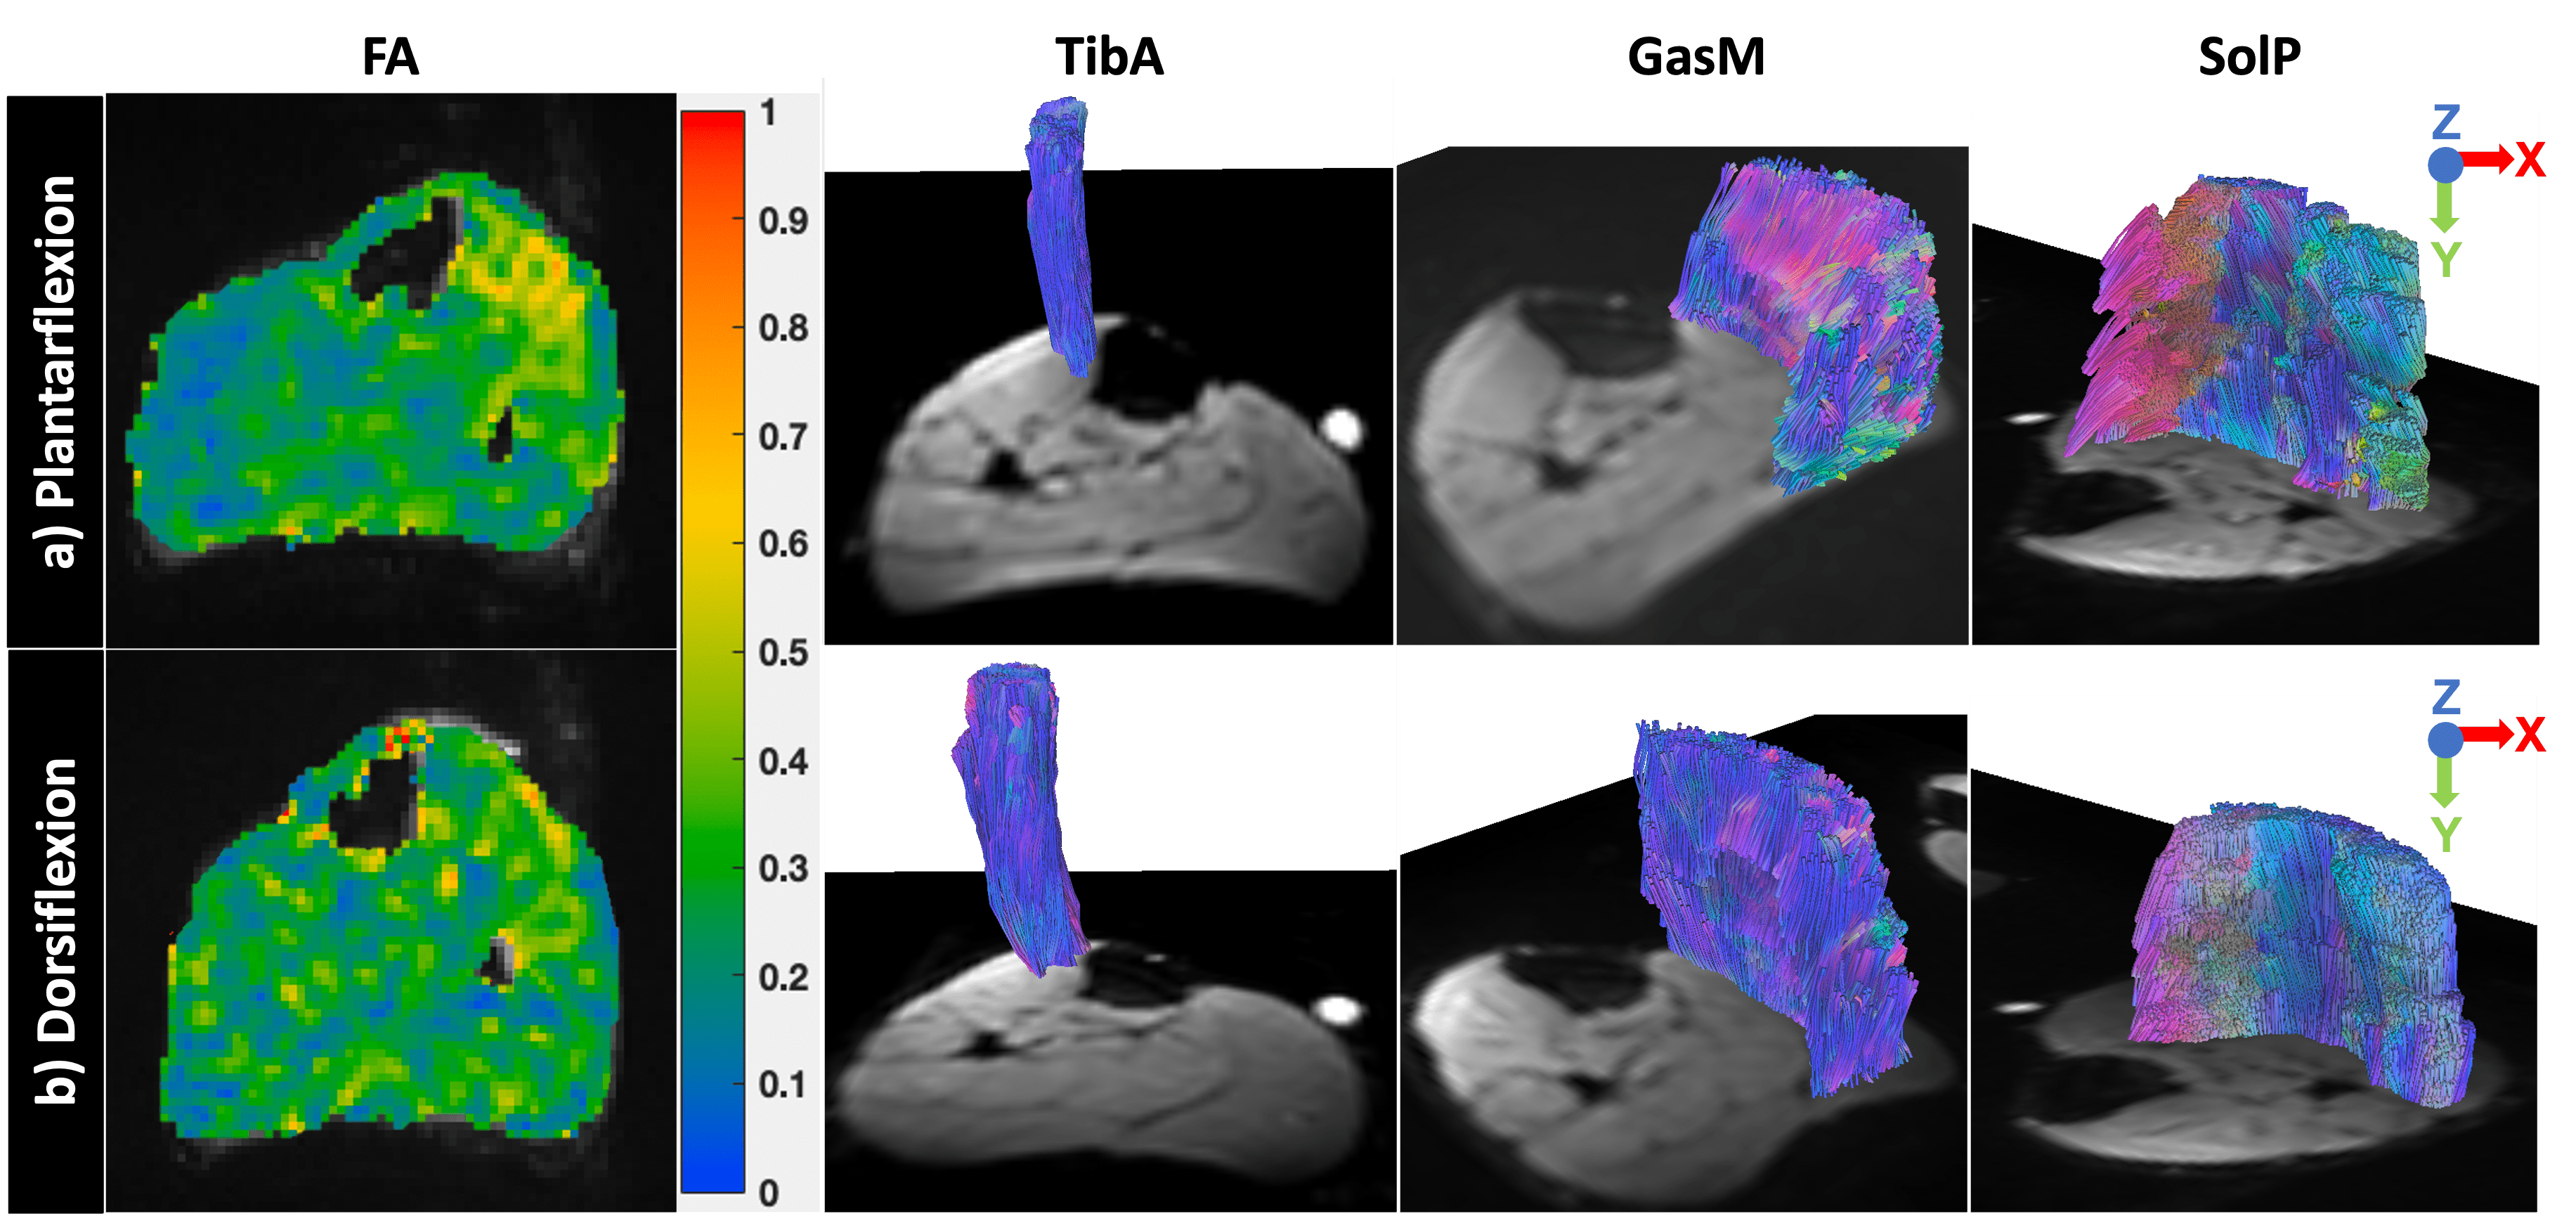
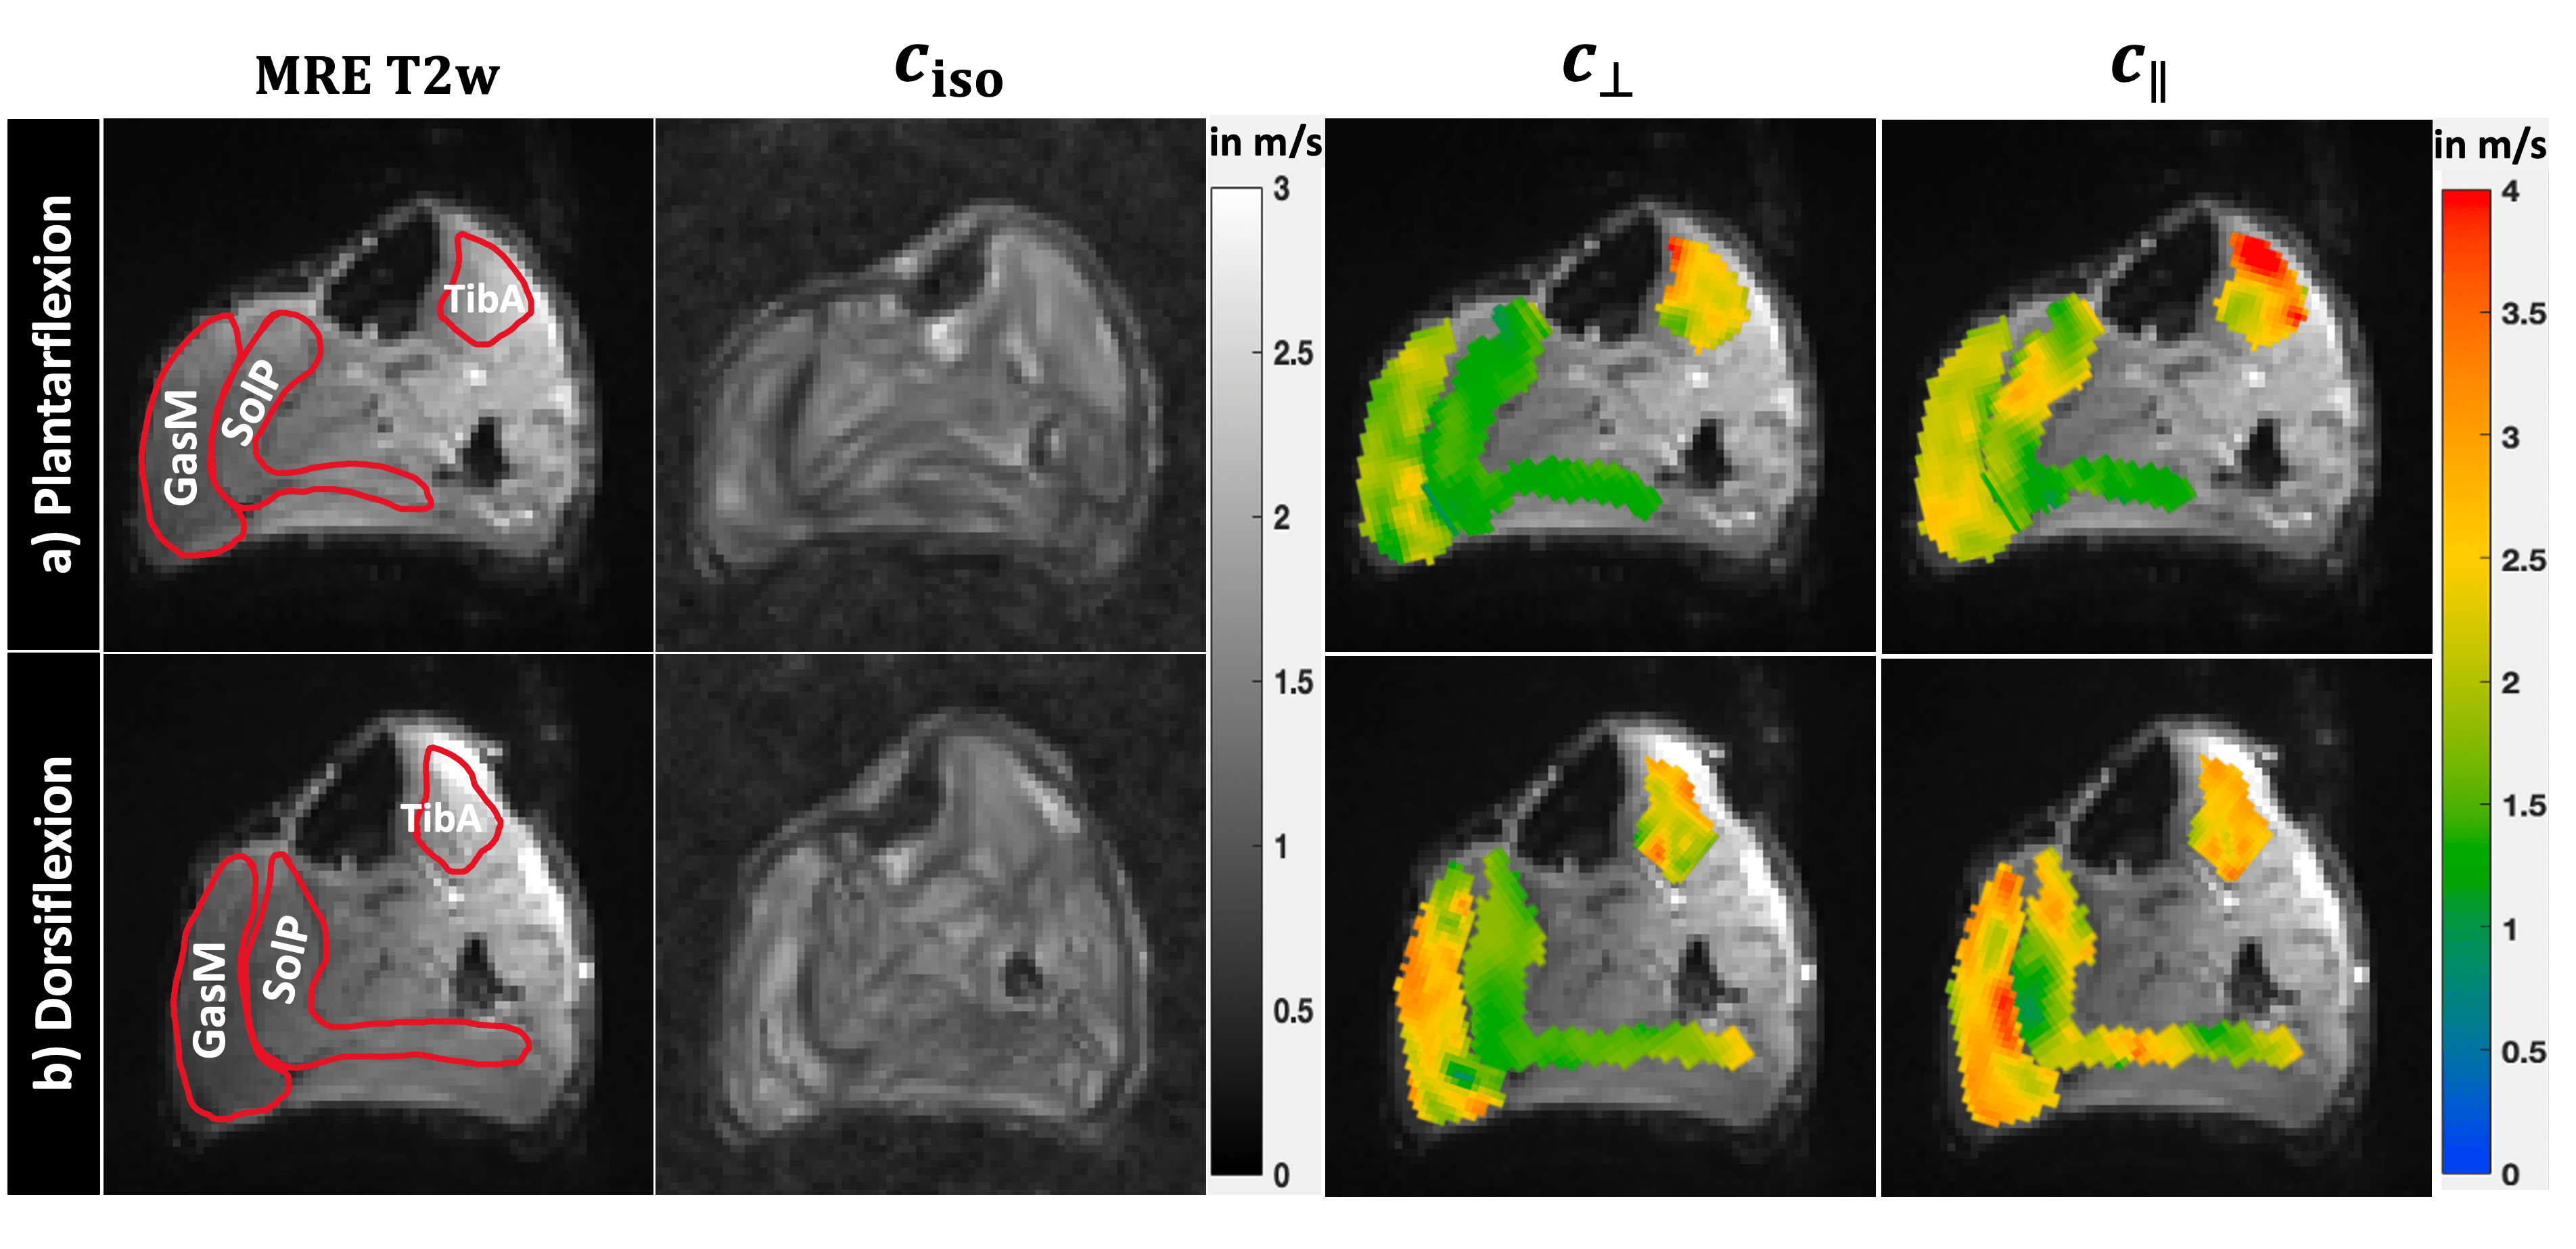
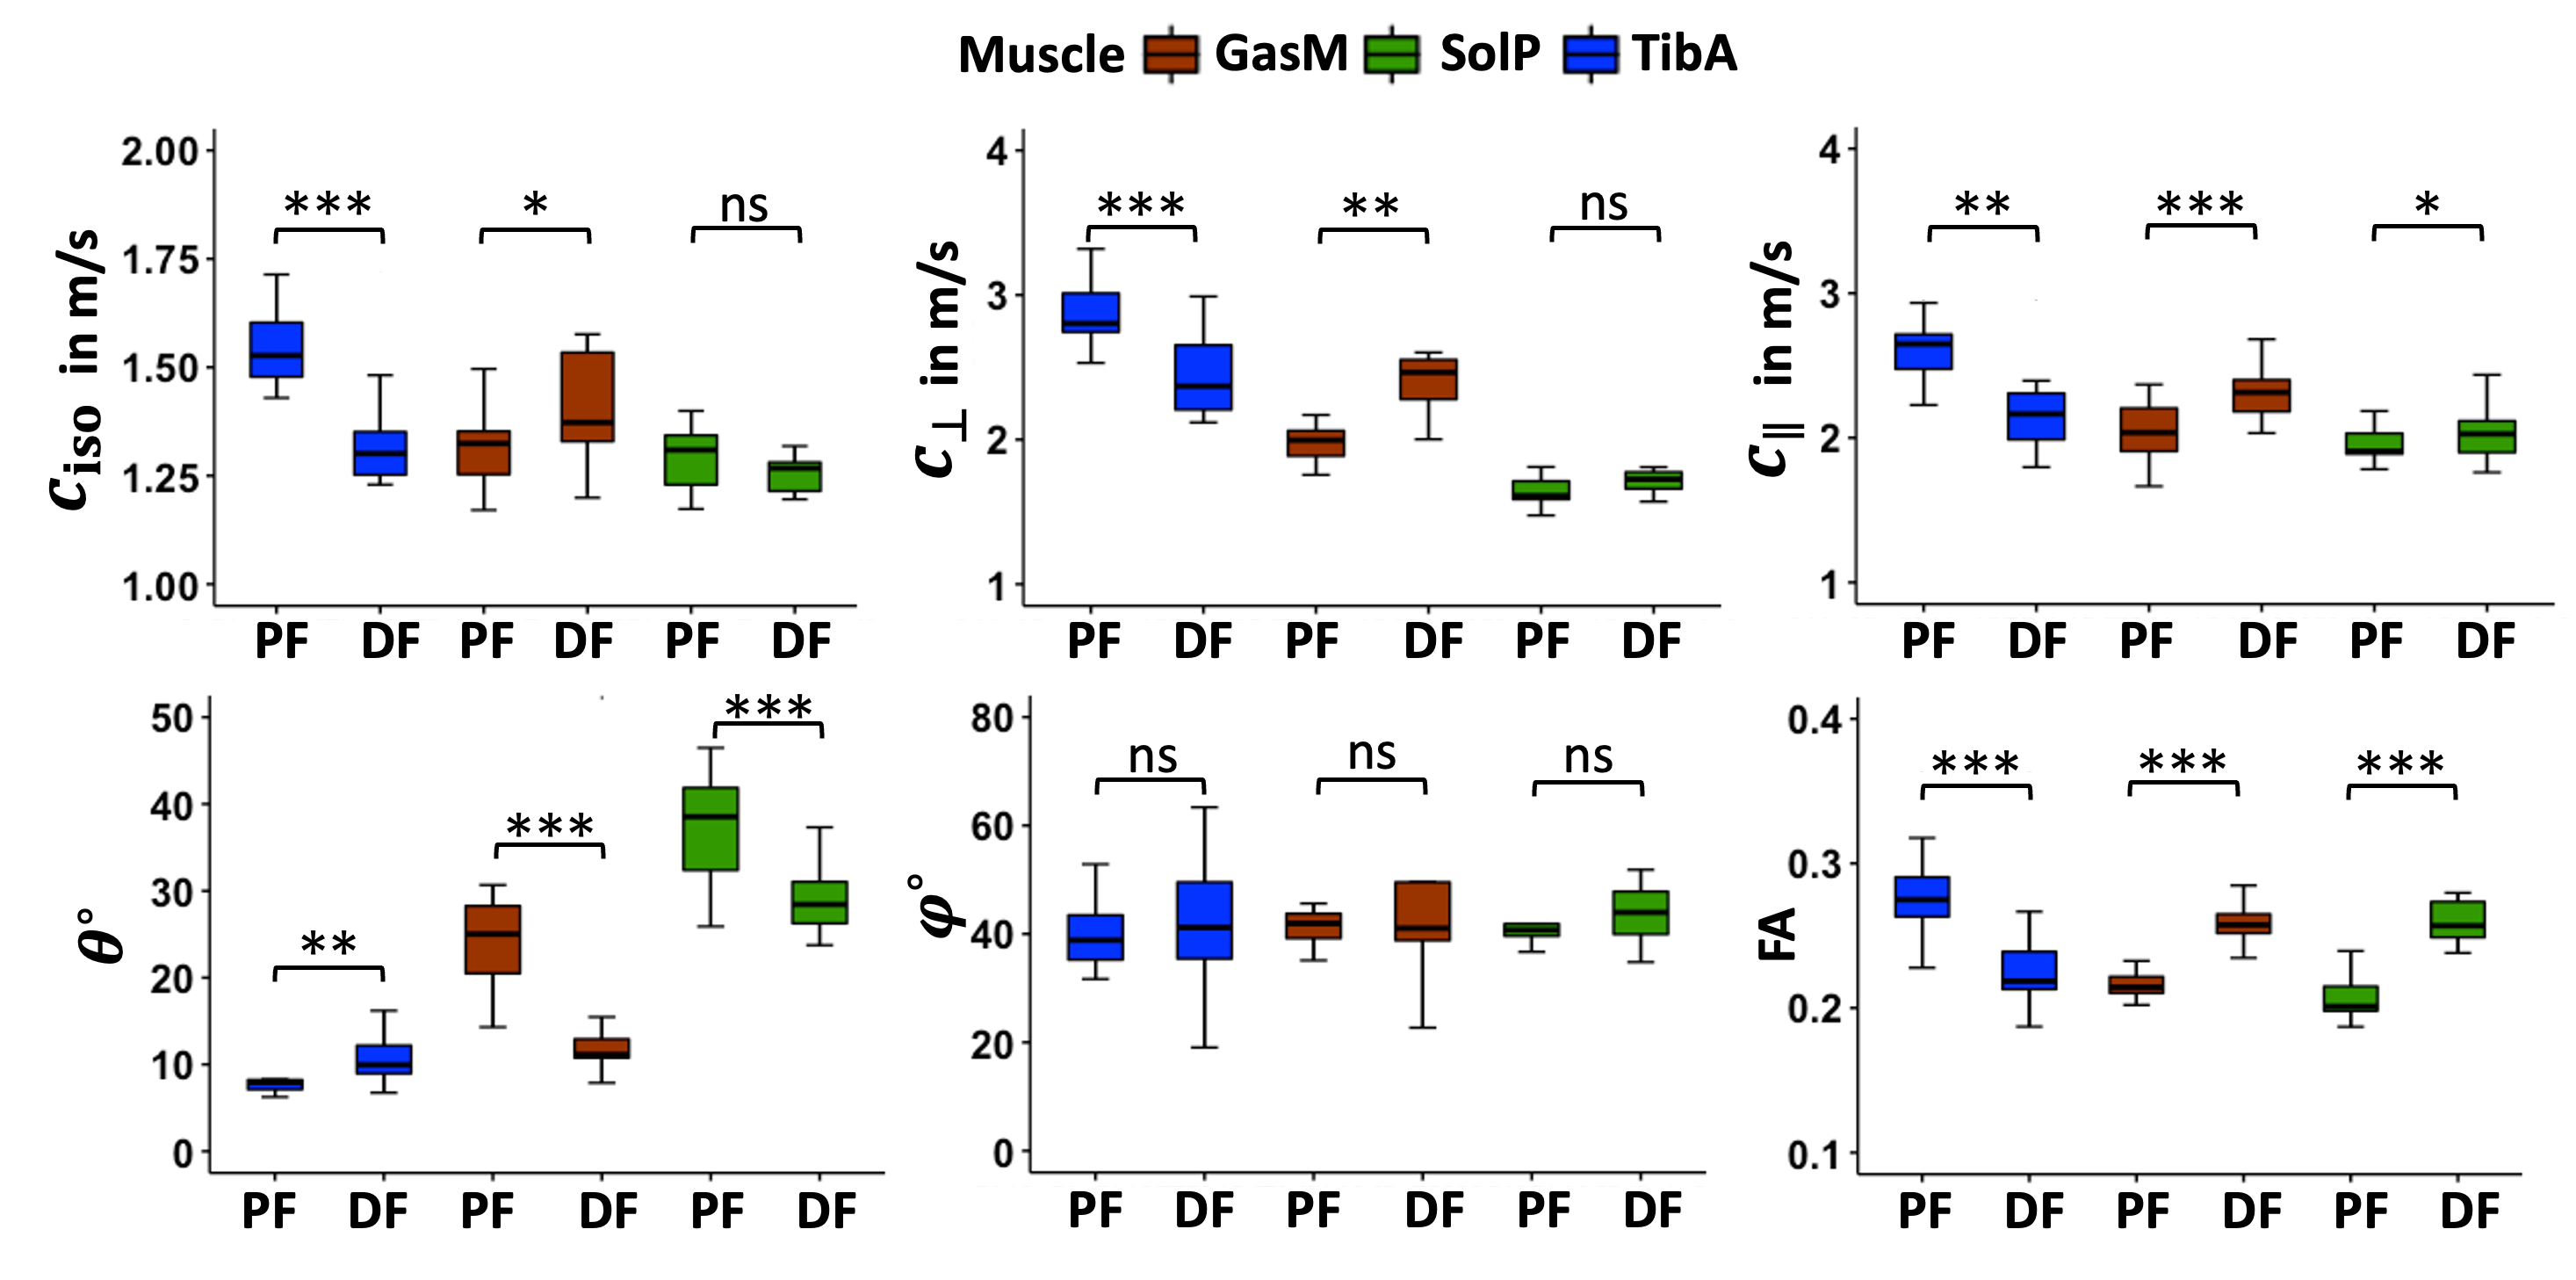
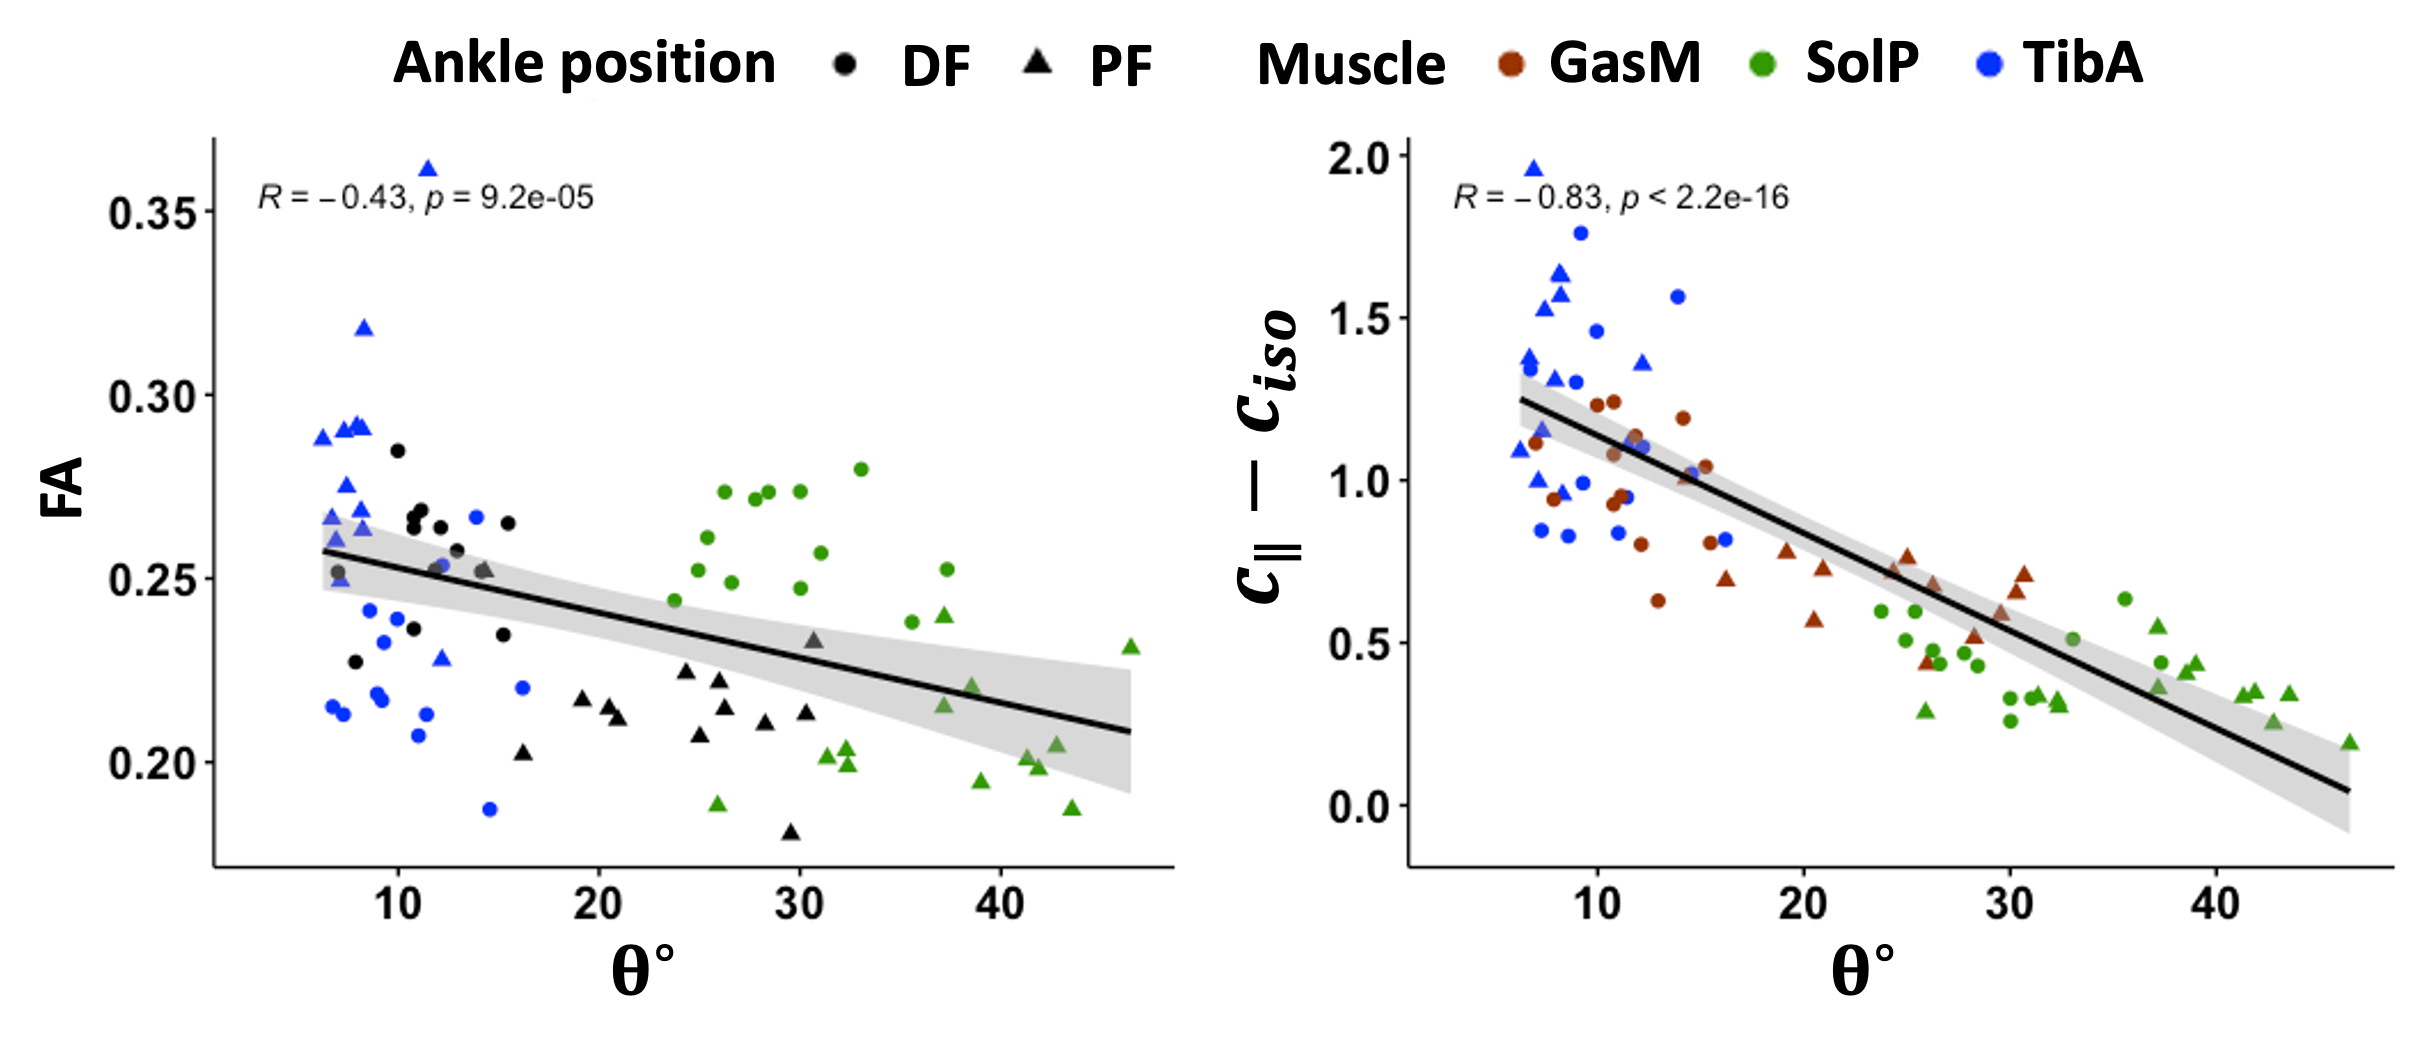
Fig.2 illustrates the FA maps and tractography results for each muscle group. In Fig.3, MRE T2w magnitude image and maps of ciso, c$$$_{\perp}$$$ and c$$$_{\parallel}$$$ are presented for the same volunteer. In Fig.4, group mean values of all imaging parameters were compared for TibA, GasM and SolP muscles during plantarflexion and dorsiflexion. As shown in Fig.4, TibA exhibited a significant decrease in ciso (p=0.0002), FA (p=0.0002), c$$$_{\perp}$$$ (p=0.0007) and c$$$_{\parallel}$$$ (p=0.001), accompanied by a significant increase in θ (p=0.001). In contrast, GasM displayed significant stiffening during dorsiflexion, with significantly higher values of ciso (p=0.01), FA (p=0.0002), c$$$_{\perp}$$$ (p=0.001), c$$$_{\parallel}$$$ (p=0.0002) and a significant decrease in θ (p=0.0002). SolP exhibited a significant increase in c$$$_{\parallel}$$$ (p=0.01) and FA (p=0.0002) along with a significant decrease in θ (p=0.0005). Furthermore, θ was significantly correlated with FA (R=-0.43, p=9.2e-05) as well as the absolute difference between c$$$_{\parallel}$$$ and ciso (R=-0.83, p< 2.2e-16) (Fig.5).Discussion
For the muscle groups investigated in this study, anisotropic biomechanical parameters were more sensitive to passive ankle movement compared to isotropic metrics, particularly for GasM and SolP where the fibers were less aligned compared to TibA. Our results indicated that θ angle and FA can accurately describe muscle alignment. θ angle associates negatively with the muscle alignment along the principal muscle axis and muscle anisotropy, as represented by FA. Muscle alignment also manifested biomechanically, elongation of muscles (TibA from dorsiflexion to plantarflexion and GasM and SolP from plantarflexion to dorsiflexion) decreased slack length and increased muscle tension, resulting in higher stiffness values9,10.Conclusion
We introduced anisotropic inversion for multifrequency MRE that takes into account the muscle fiber orientation, which is an inherent structural trait of skeletal muscle. This anisotropic inversion method could dissect the waves propagating parallel and perpendicular to the muscle fibers. Compared to conventional isotropic measures, these anisotropic biomechanical parameters showed increased sensitivity to passive position changes, making them potentially valuable for characterizing subtle structural changes due to muscle pathology.Acknowledgements
We acknowledge support from the German Research Foundation (DFG)- GU 172614-1, GRK2260, and SFB1340 Matrix in Vision.References
[1] Bilston, L. E., Bolsterlee, B., Nordez, A., & Sinha, S. (2019). Contemporary image-based methods for measuring passive mechanical properties of skeletal muscles in vivo. Journal of Applied Physiology, 126(5), 1454-1464.[2] Green, M. A., Geng, G., Qin, E., Sinkus, R., Gandevia, S. C., & Bilston, L. E. (2013). Measuring anisotropic muscle stiffness properties using elastography. NMR in Biomedicine, 26(11), 1387-1394.
[3] Smith, D. R., Caban-Rivera, D. A., Williams, L. T., Van Houten, E. E., Bayly, P. V., Paulsen, K. D., ... & Johnson, C. L. (2023). In vivo estimation of anisotropic mechanical properties of the gastrocnemius during functional loading with MR elastography. Physics in Medicine & Biology, 68(4), 045004.
[4] Braun, J., Hirsch, S., Heinze, T., & Sack, I. (2015). Feasibility of a new actuator type for magnetic resonance elastography based on transient air pressure impulses. In Proc 23rd Annual Annual Meeting ISMRM.
[5] Woolrich, M. W., Jbabdi, S., Patenaude, B., Chappell, M., Makni, S., Behrens, T., ... & Smith, S. M. (2009). Bayesian analysis of neuroimaging data in FSL. Neuroimage, 45(1), S173-S186.
[6] Yeh, F. C., Verstynen, T. D., Wang, Y., Fernández-Miranda, J. C., & Tseng, W. Y. I. (2013). Deterministic diffusion fiber tracking improved by quantitative anisotropy. PloS one, 8(11), e80713.
[7] Schwenzer, N. F., Steidle, G., Martirosian, P., Schraml, C., Springer, F., Claussen, C. D., & Schick, F. (2009). Diffusion tensor imaging of the human calf muscle: distinct changes in fractional anisotropy and mean diffusion due to passive muscle shortening and stretching. NMR in Biomedicine: An International Journal Devoted to the Development and Application of Magnetic Resonance In vivo, 22(10), 1047-1053.
[8] Tzschätzsch, H., Guo, J., Dittmann, F., Hirsch, S., Barnhill, E., Jöhrens, K., ... & Sack, I. (2016). Tomoelastography by multifrequency wave number recovery from time-harmonic propagating shear waves. Medical image analysis, 30, 1-10.
[9] Hirata, K., Miyamoto-Mikami, E., Kanehisa, H., & Miyamoto, N. (2016). Muscle-specific acute changes in passive stiffness of human triceps surae after stretching. European journal of applied physiology, 116, 911-918.
[10] Le Sant, G., Nordez, A., Andrade, R., Hug, F., Freitas, S., & Gross, R. (2017). Stiffness mapping of lower leg muscles during passive dorsiflexion. Journal of anatomy, 230(5), 639-650.
Figures