0495
Collagen Fibre Direction Estimation Using a Prototype Rotatable Low Field Scanner1Mechanical Engineering, Imperial College London, London, United Kingdom, 2Imperial College London, London, United Kingdom, 3Department of Surgery & Cancer, Imperial College London, London, United Kingdom
Synopsis
Keywords: Tendon/Ligament, Joints, Magic angle, collagen, PCL, ACL, soft registration
Motivation: Certain types of tendon and ligament pathologies are hard to diagnose using conventional MRI. This can lead to invasive procedures or under-informed decisions regarding treatment.
Goal(s): The goal of this research is to develop a novel scanner and image analysis techniques in order to assess tendon/ligament structure and health non-invasively.
Approach: Tendons/ligaments contain collagen fibres that produce different signal intensities at different B0 orientations, this is the "magic angle effect". We have developed a rotatable scanner to reorient B0 to exploit this effect.
Results: This study shows successful tendon structure estimation of a bovine PCL using our scanner and image processing techniques.
Impact: The results of this study provide a foundation to begin testing our methodology in-vivo. Our successful fibre estimation in a bovine PCL has shown our scanner captures the magic angle effect and our processing techniques can estimate collagen fibre directions.
Introduction
Our research aim is to utilise the magic angle effect to non-invasively assess tendon and ligament health in-vivo. Our methodology involves using a rotatable low field scanner1 of our own design to acquire sets of images that can be analysed to estimate collage fibre directions. In the present work we have applied this methodology to a bovine knee specimen.Tissues that contain significant amounts of organised collagen typically exhibit low MR signal. Tendons and ligaments therefore appear dark, making assessment of their structure/health difficult. For this reason, invasive arthroscopy is the diagnostic gold standard2 for pathologies such as partial ligament tears that are challenging to visualise using MRI.
However, tendons and ligaments exhibit the “magic angle effect” which we leverage to estimate collagen fibre directions.
Methods and Theory
Water in collagen fibres is orientationally restricted3 by dipole-dipole interactions between the water molecules and fibre proteins. This causes residual dipolar couplings oriented in the fibre direction giving collagen rich tissues a very short T2. Orienting the main field, at the “magic angle” relative to the fibres disrupts these interactions and increases T2. Equation 1 models4 the effect as:$$I = A \cdot \exp(-B \cdot (3 (\cos^{2} \theta - 1)^{2})\quad\quad(1)$$
Where $$$I$$$ is intensity, $$$A$$$ and $$$B$$$ are constants, and $$$\theta$$$ is the angle between B0 and the fibre. Solving equation 1 for maximum intensity yields the magic angle: $$$\theta=54.7^{o}$$$.
We used our rotatable scanner to image a bovine knee specimen at 6 different orientations. Collagen fibre direction estimation was then performed by analysing the intensity variation of the PCL across the scans. More detail is available in our previous work5.
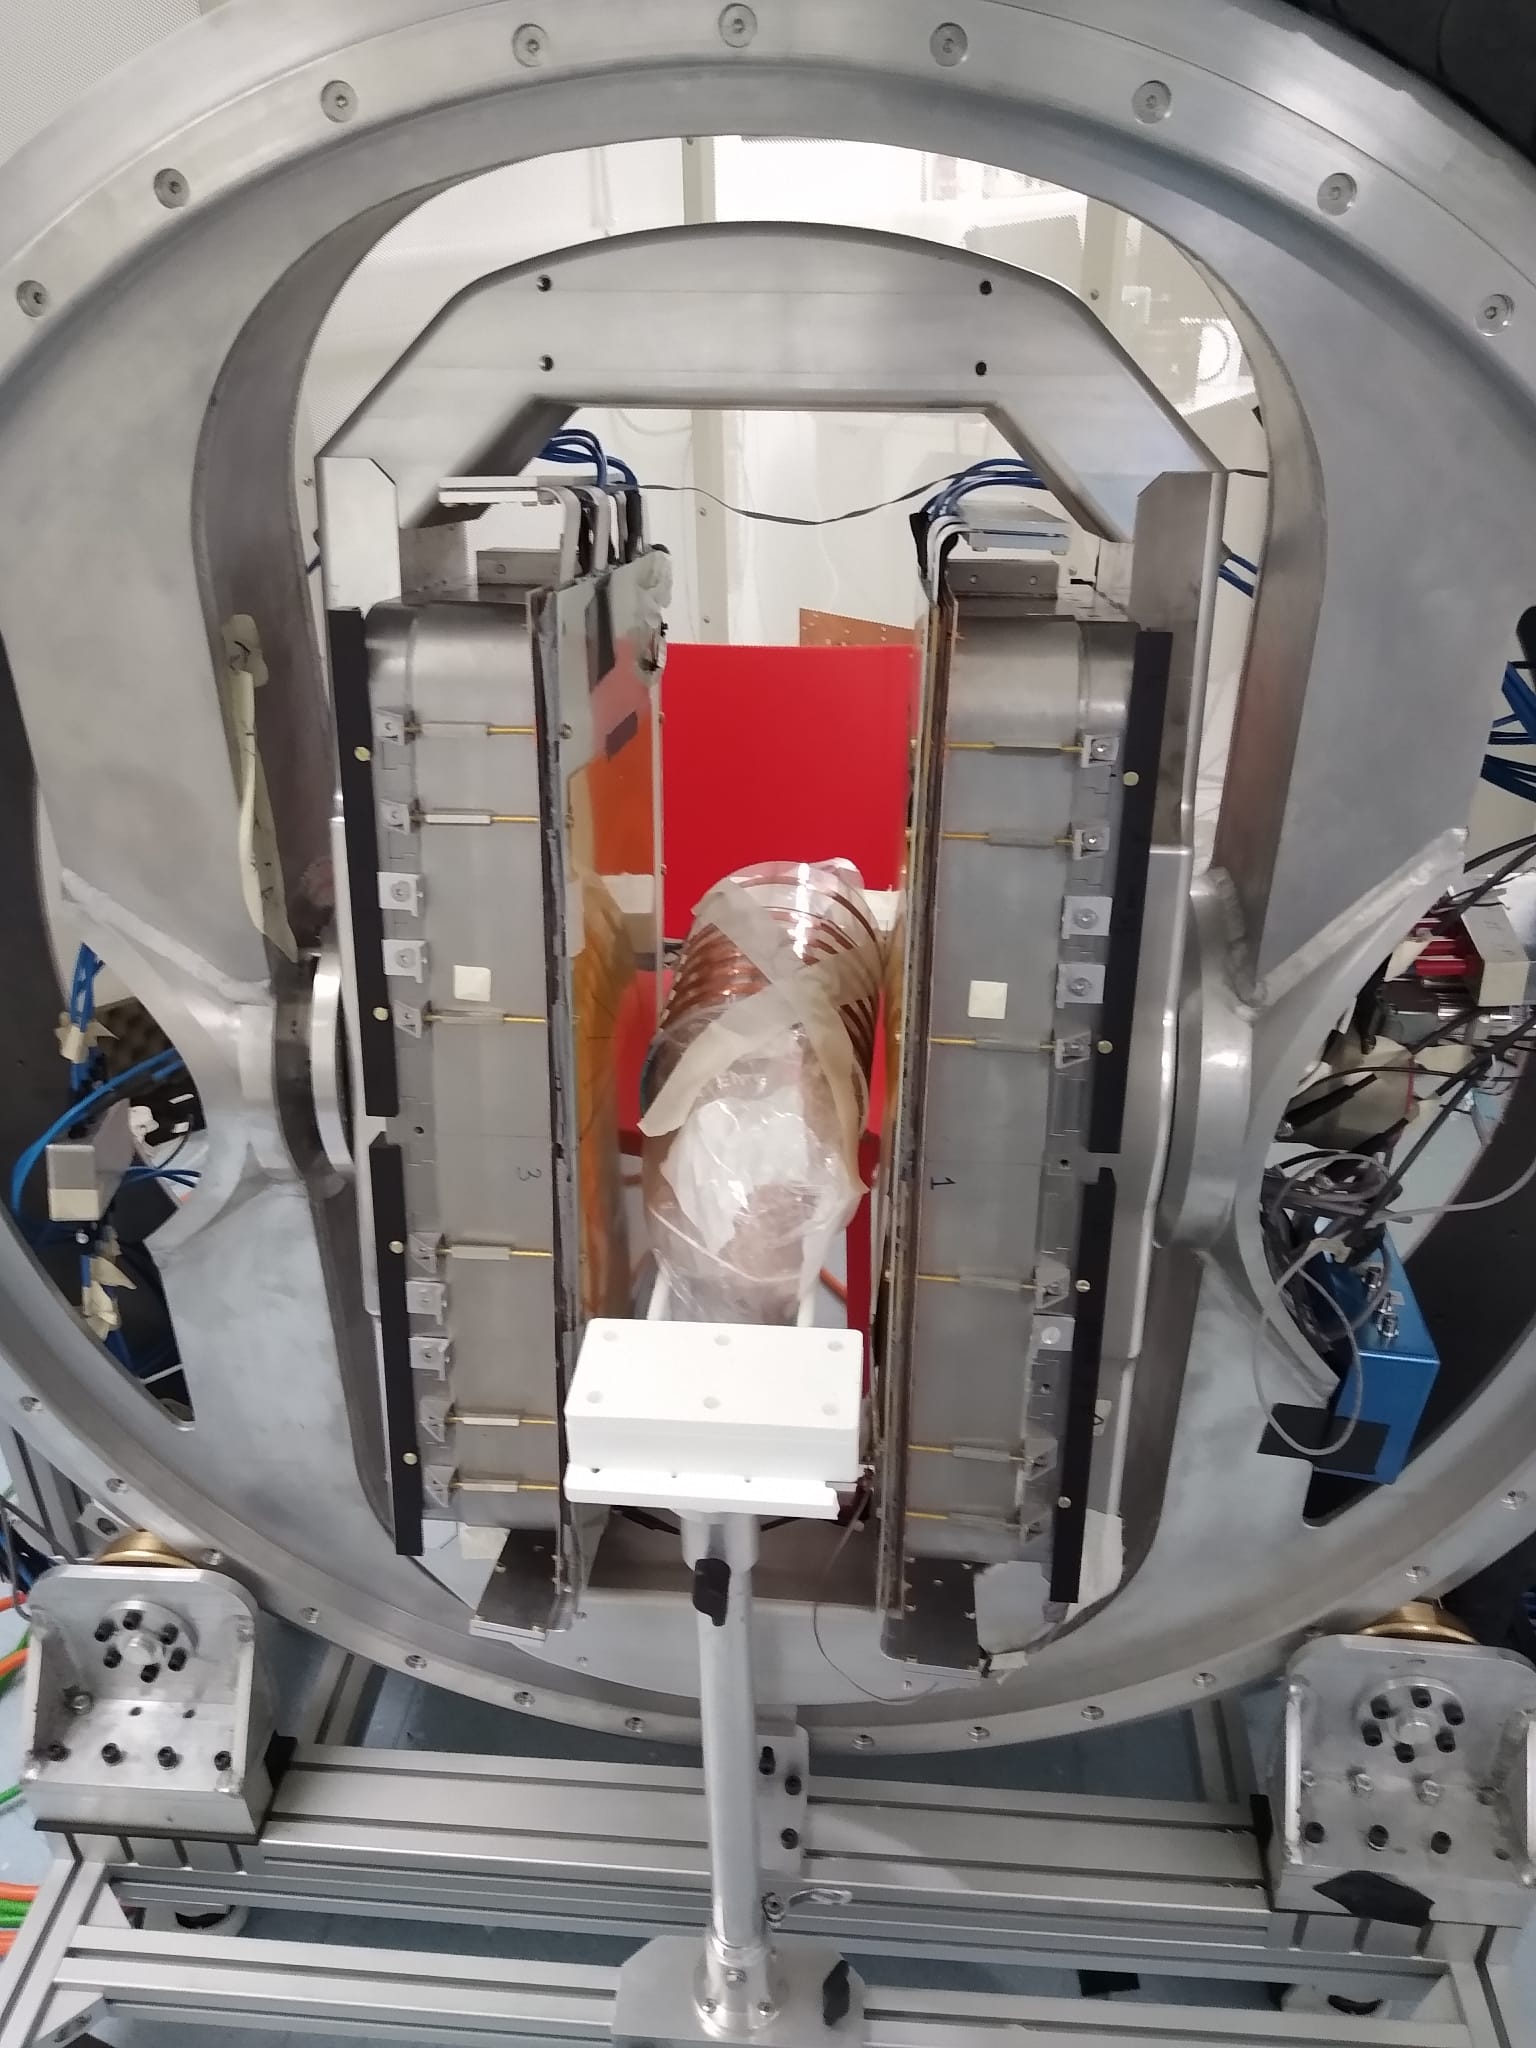
1) A bovine knee specimen was prepared and placed into the scanner as shown in Figure 1.
2) MR images were then acquired at 6 different orientations by varying scanner roll and yaw to reorient B0 relative to the specimen.
2a) Scan details: 1mm isotropic, 5 averages, 3DGRE, TR 12ms, TE 6ms, FA $$$75^{o}$$$, each scan: 22.5 minutes.
3) The images were registered using affine and B-spline transforms to precisely align features across the image set. Registration was implemented using the elastix toolbox6.
4) The bovine PCL was then segmented from the first image.
4a) The same segmentation was applied to all registered images to allow for intensity variation analysis across the image set.
5) The intensity variation over corresponding voxels in the image set was then correlated with simulated intensities (using equation 1) of a ball of candidate fibre directions.
6) The most correlated candidate direction for each voxel was then used as the initial condition for an optimisation routine to fine tune each estimated fibre direction.
Results
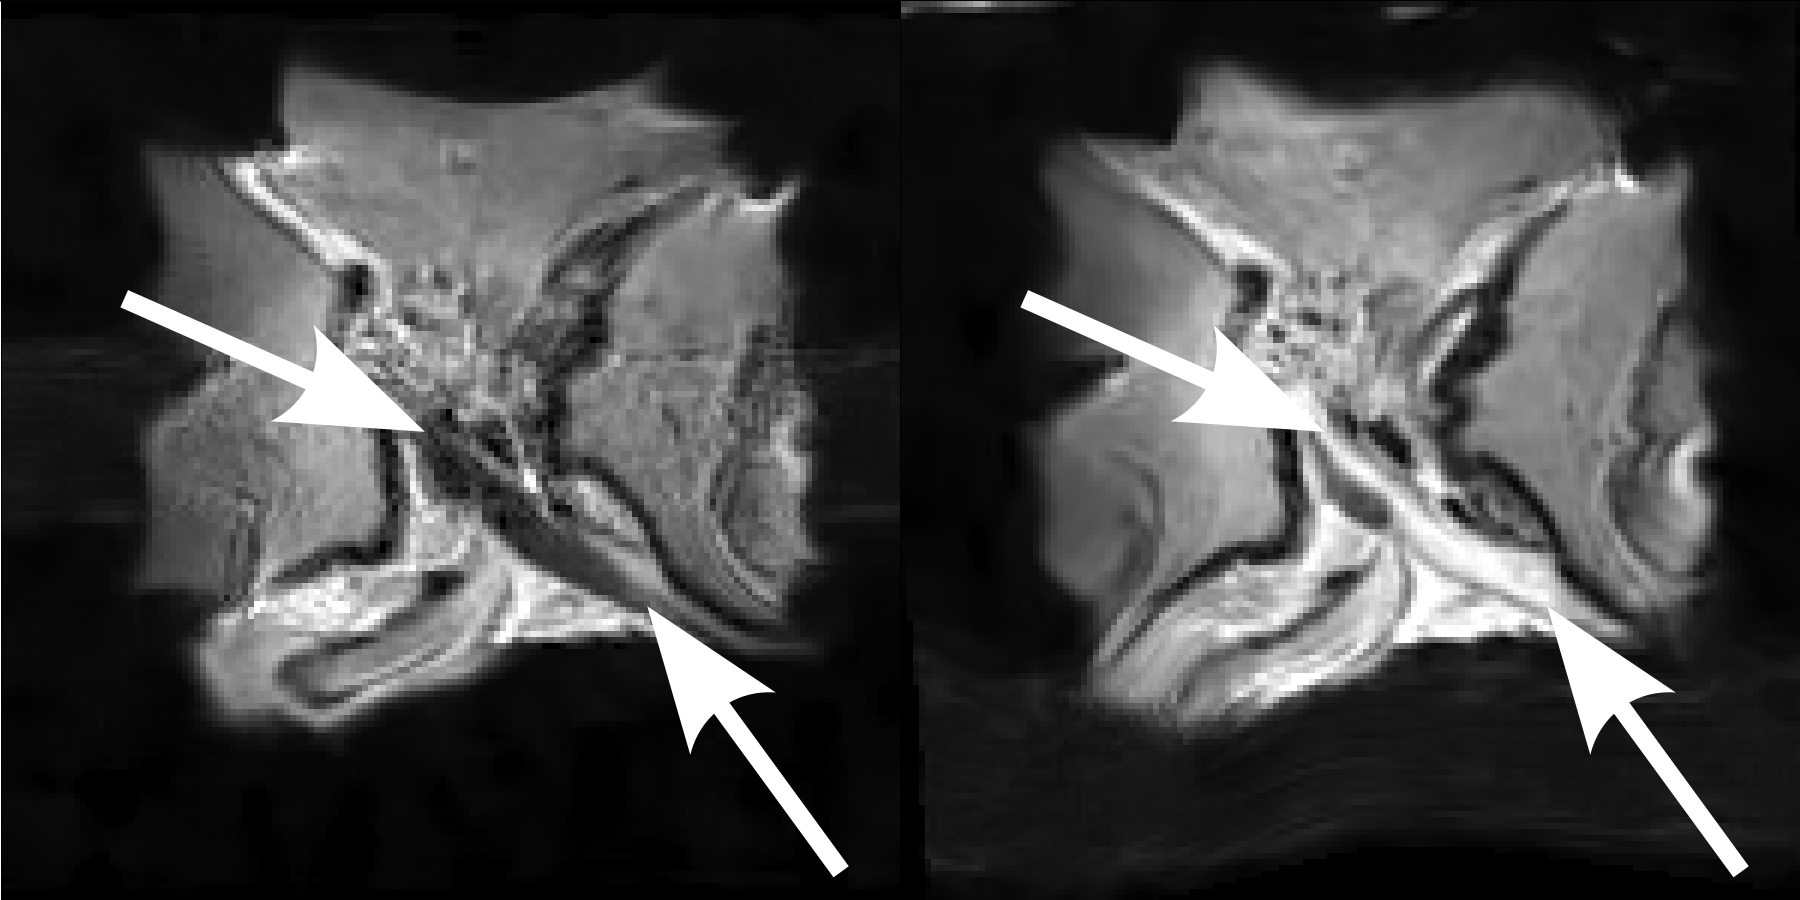
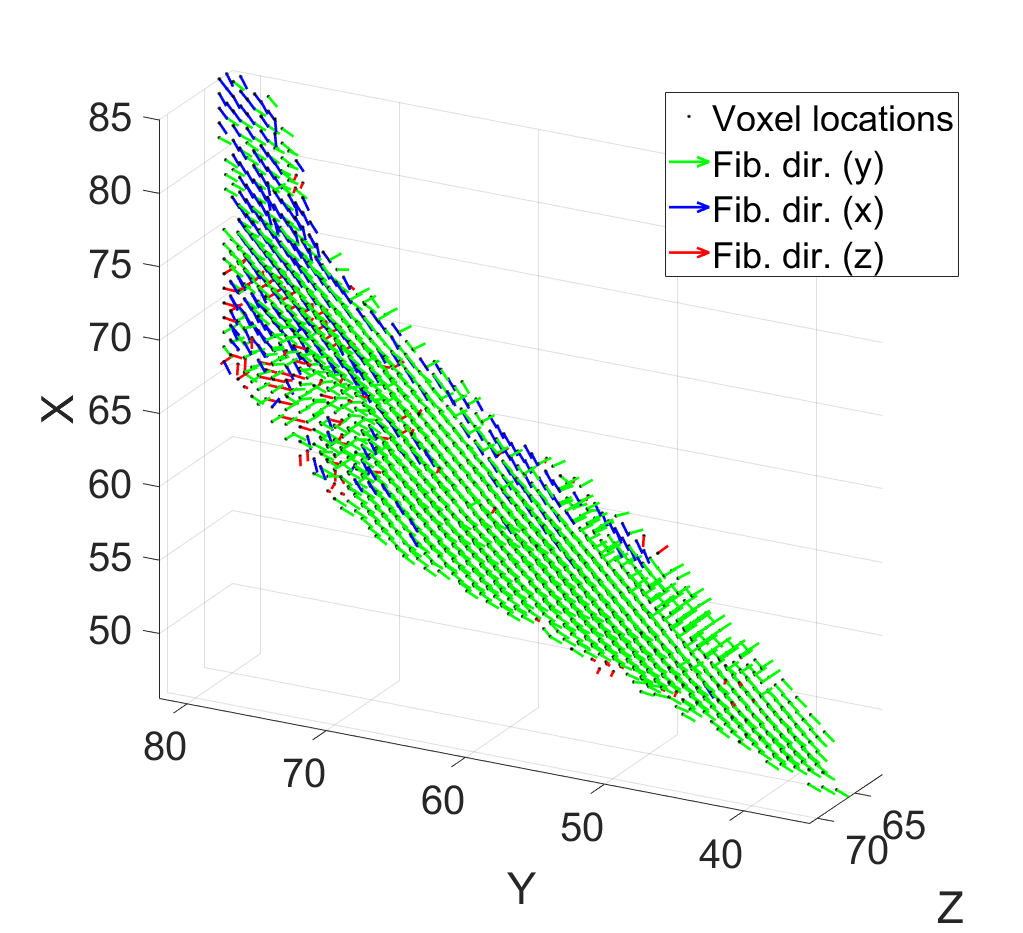
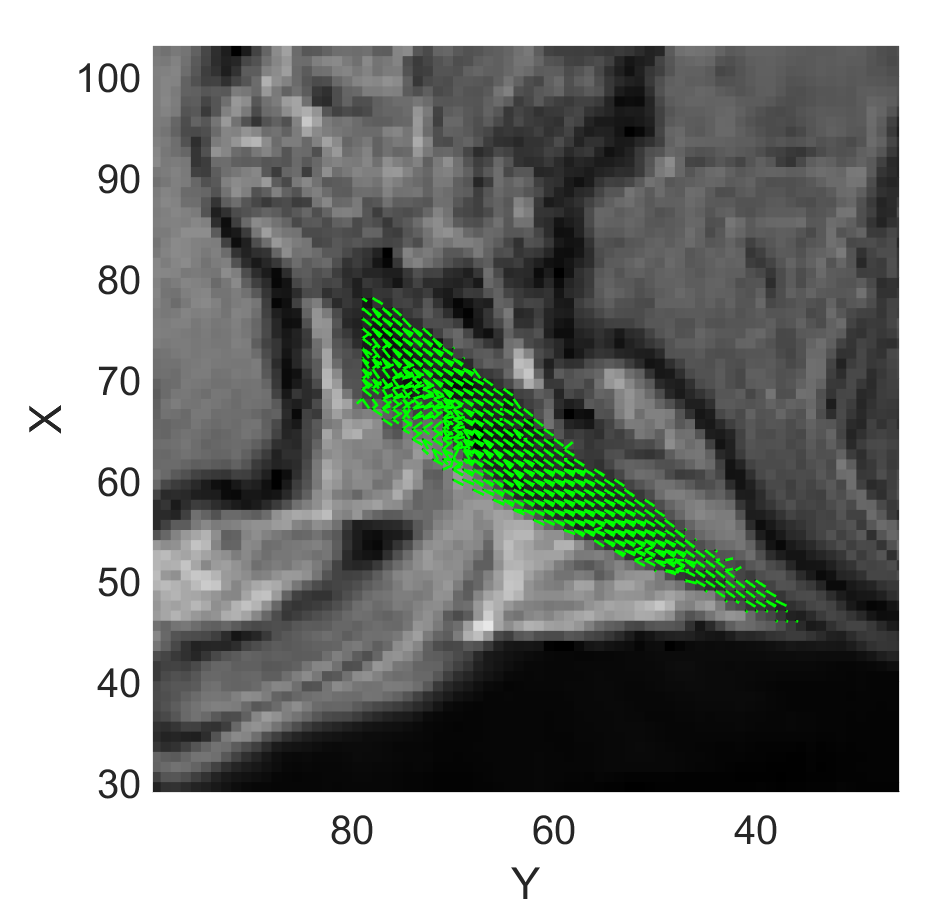
Figure 2 shows the PCL from the 1st and 4th scan. The magic angle effect drastically increases the signal from the PCL between the two orientations.Figure 3 shows the fibre estimation results from the intensity variation analysis. Each voxel has an associated estimated fibre direction which are seen to be highly aligned within the ligament.
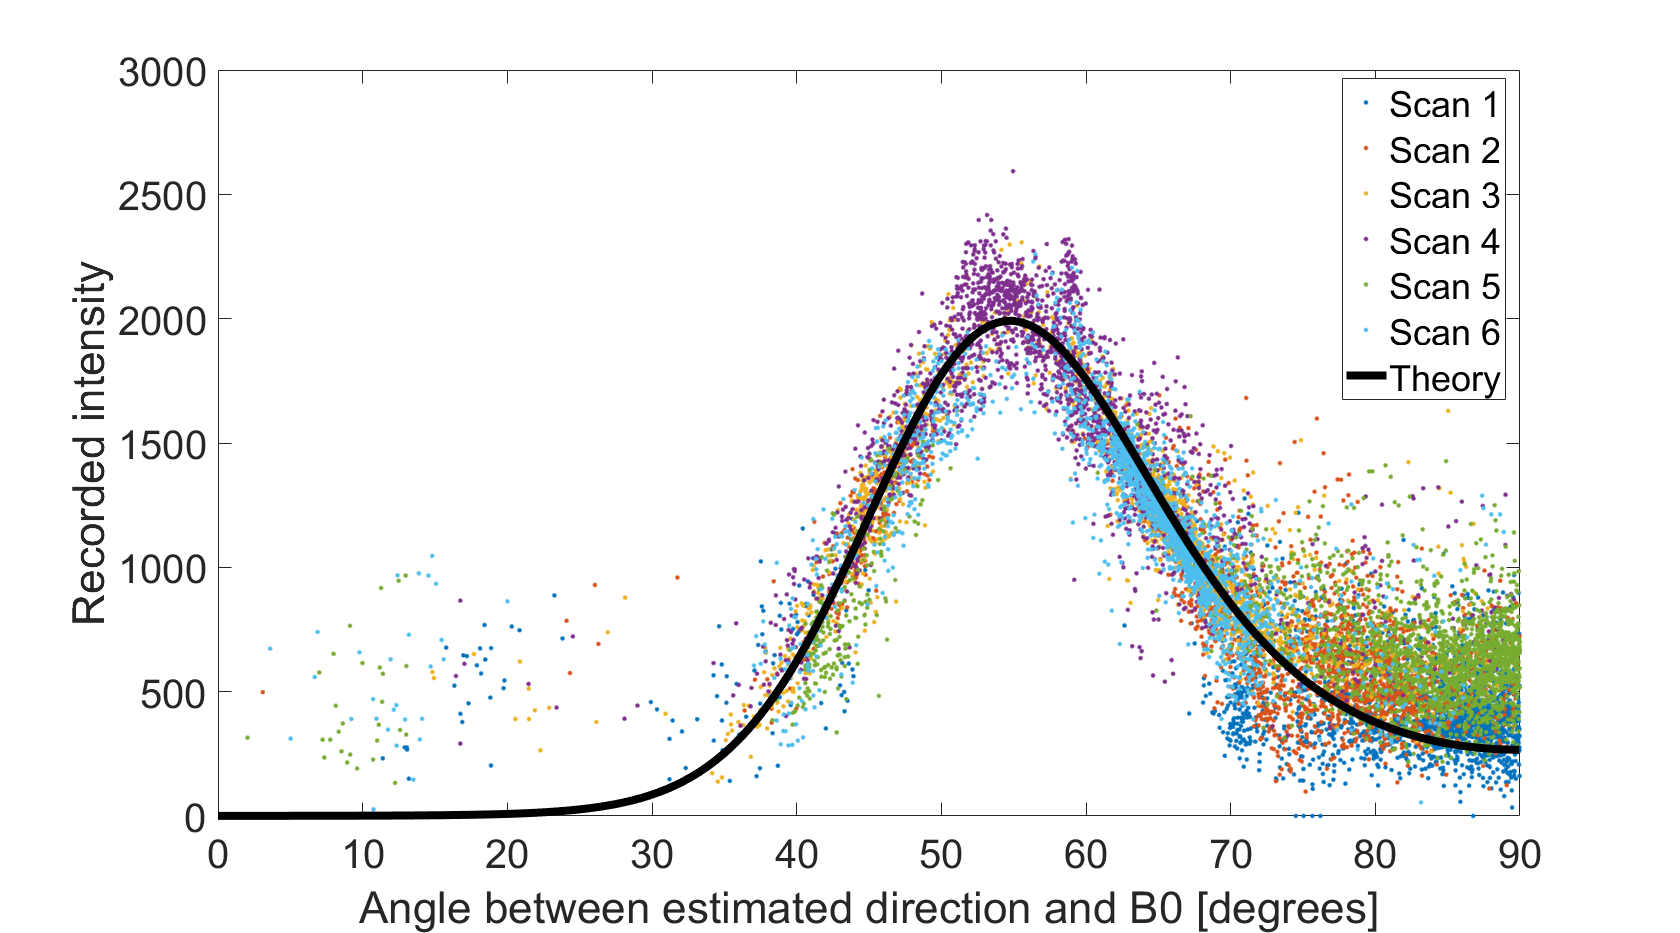
Figure 4 shows the segmented intensity data from each scan, versus the angle between the estimated fibre direction and B0. Equation 1 is also plotted showing strong agreement between the theory and data, particularly close to the magic angle.
Figure 5 shows the estimated fibre directions superimposed onto the MR data in 3D to provide context for the fibre estimations relative to the scan. The fibres are shown to be aligned with the ligament direction.
Discussion
Figures 2-4 show that intensity variations due to magic angle effect were successfully captured and utilised to estimate collagen fibre directions within the bovine PCL. The high degree of fibre alignment with the ligament direction is the expected result as fibres within a ligament are oriented to sustain tensile forces. Some fibres on the periphery of the ligament show deviation from their neighbours. This may be expected at the ligament insertions as it bends to attach to the bone, whereas at the edge of the ligament these deviations are likely due to partial volume effects or slightly inaccurate segmentation.Conclusion
In the present work we have demonstrated successful fibre direction estimation in a bovine PCL, using our rotatable low field scanner. The results agree with the general intuition of ligament fibre directions being oriented in the direction of tensile forces. Future work will focus on applying the method in-vivo, reduction of total acquisition time, and using the method to detect pathologies in/ex-vivo. Ex-vivo or surgical analysis will also allow for cross validation of the method by comparing dissection or arthroscopic results with our method.Acknowledgements
This work was partly supported by the Wellcome Trust Innovator Award WT215908/Z/19/Z.References
1. McGinley, J.V., Ristic, M., Young, I.R., 2016. A permanent mri magnet for magic angle imaging having its field parallel to the poles. Journal of magnetic resonance (1997) 271, 60–67. doi:10.1016/j.jmr.2016.08.001
2. Devitt, B.M., O’Sullivan, R., Feller, J.A., Lash, N., Porter, T.J., Webster, K.E., Whitehead, T.S., 2017. Mri is not reliable in diagnosing of concomitant anterolateral ligament and anterior cruciate ligament injuries of the knee. Knee surgery, sports traumatology, arthroscopy: official journal of the ESSKA 25, 1345–1351. doi:10.1007/s00167-017-4538-2
3. Fullerton, G.D., Rahal, A., 2007. Collagen structure: The molecular source of the tendon magic angle effect. Journal of magnetic resonance imaging 25, 345–361. doi:10.1002/jmri.20808
4. Szeverenyi, N.M., Bydder, G.M., 2011. Dipolar anisotropy fiber imaging in a goat knee meniscus. Magnetic resonance in medicine 65, 463–470. doi:10.1002/mrm.22645
5. Lanz, H., Ristic, M., Chappell, K.E. & McGinley, J.V.M. (2023) Minimum number of scans for collagen fibre direction estimation using Magic Angle Directional Imaging (MADI) with a priori information. Array (New York). 17, 100273-. doi:10.1016/j.array.2022.100273.
6. Klein, S., Staring, M., Murphy, K., Viergever, M., Pluim, J., 2010. elastix: A toolbox for intensity-based medical image registration. IEEE transactions on medical imaging 29, 196–205. doi:10.1109/TMI.2009.2035616.
Figures