0487
Hepatitis C virus infection is associated with elevated bone marrow adiposity in the proximal femur: A preliminary study1Radiology, University of Pennsylvania, Philaelphia, PA, United States
Synopsis
Keywords: Bone, Infectious disease, Hepatitis C
Motivation: Hepatitis C (HCV) has been linked to osteoporosis and elevated risk of fracture in retrospective studies.
Goal(s): To perform the first investigation of bone marrow adiposity in a cohort of patients with chronic HCV infection.
Approach: A total of 33 patients with HCV and 42 age-, sex-, and race-matched HCV-uninfected controls were recruited for MRI. Proximal femur bone marrow adiposity was assessed via chemical-shift-encoded MRI from multi-echo gradient-echo sequences.
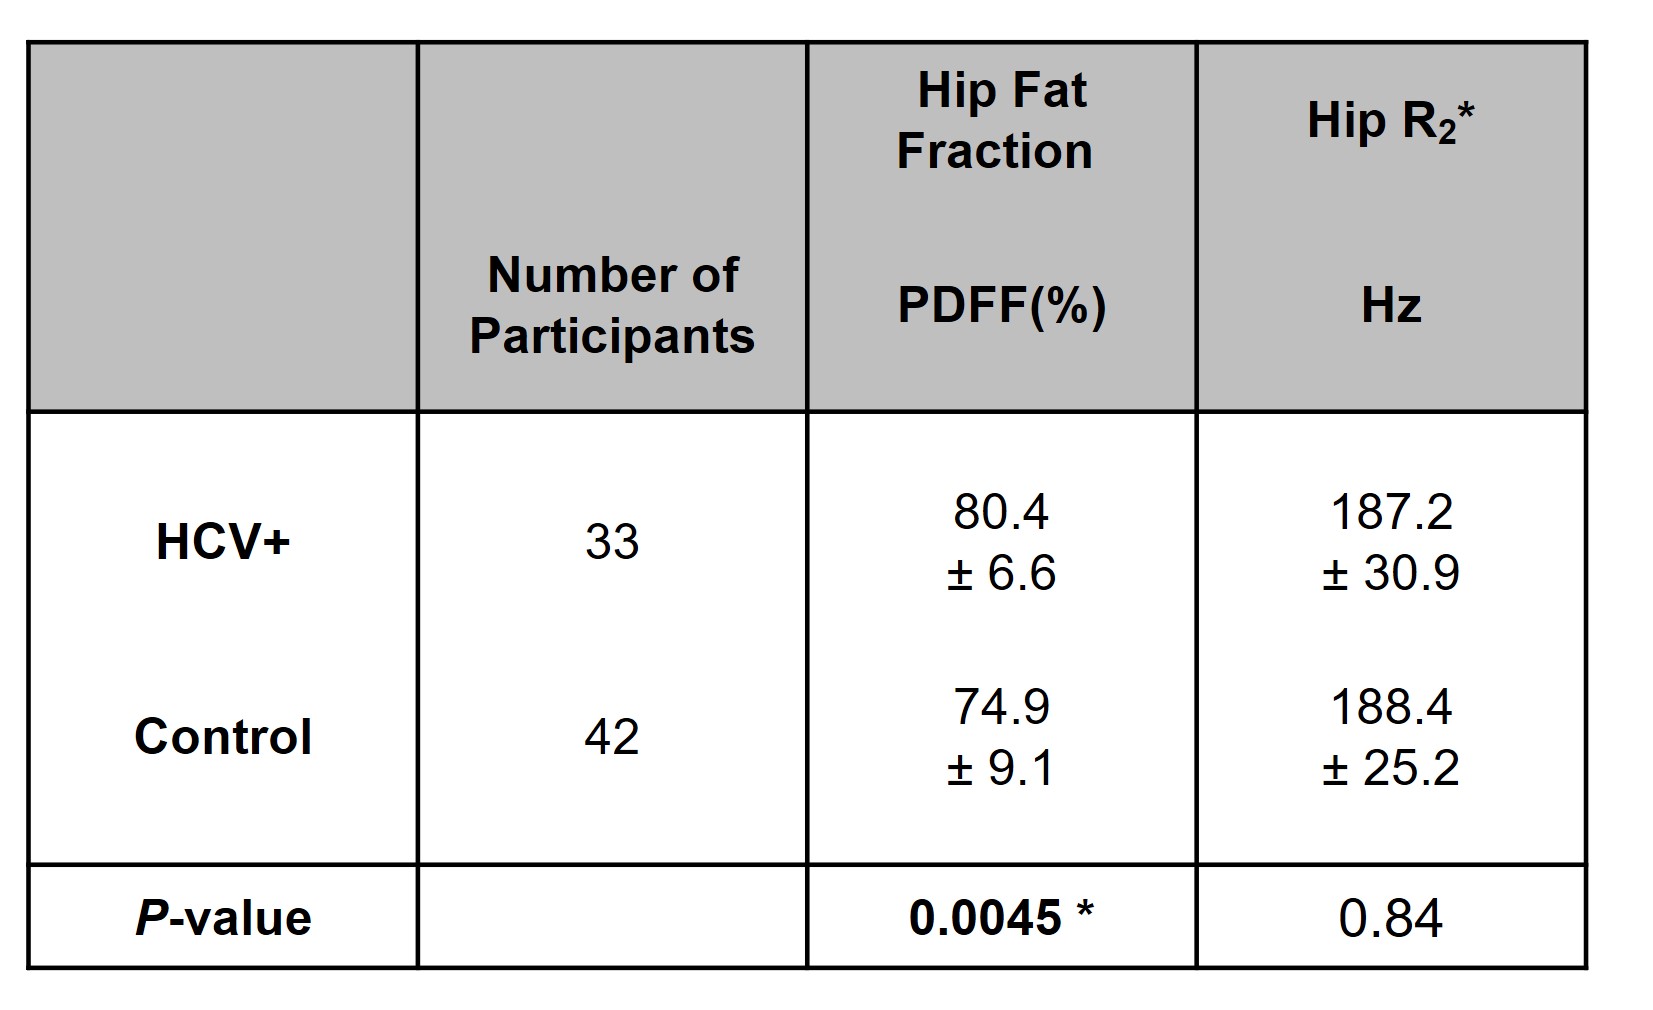
Results: The HCV group had elevated marrow adiposity in the proximal femur (80.4 ± 6.6% vs 74.9 ± 9.1%, P=0.0045) compared to controls, suggesting impairment of the trabecular network.
Impact: HCV was associated with elevated bone marrow adiposity compared to uninfected controls. MRI quantification of hip fat fraction enables investigation into the pathogenesis of increased fracture risk for patients with Hepatitis C infection.
INTRODUCTION
There are an estimated 70 million people worldwide with hepatitis C infection (HCV) [1]. Hepatitis C is a primary cause of chronic liver disease and leads to systemic metabolism dysregulation, chronic pro-inflammatory response, and malnutrition, among others [1-3]. There is some evidence that HCV is associated with lower bone mineral density and increased prevalence of osteoporosis [4-7]. Indeed, one recent meta-analysis study of over 360,000 participants concluded that HCV infection increases fracture risk ratio by over 50% after accounting for co-variates [3]. The prevailing belief is that metabolism dysregulation and chronic inflammation lead to impairment of bone mass which accounts for the increased fracture risk. However, to date, studies into the effects of HCV on bone health have been limited to retrospective studies and have not investigated the pathophysiology of bone impairment. Therefore, the objective of this prospective study was to investigate cross-sectional differences in proximal femur bone marrow adiposity in patients with HCV compared to healthy controls.METHODS
A cohort of participants with HCV infection and age-, sex-, and race-matched HCV-uninfected controls were recruited for prospective MRI scans. MRI was performed in the head-first supine position at 3T (Siemens Prisma, Erlangen, Germany) with an 18-channel body matrix coil array wrapped around the left hip, as in previous works [8]. Manual shimming and transmitter adjustments were performed before each scan to improve B0 magnetic field homogeneity and signal-to-noise ratio. Chemical-shift encoded water-fat imaging (CSE) was performed to compute bone marrow fat fraction in the proximal femur. Briefly, oblique coronal multi-echo gradient-echo sequences were acquired in the proximal femur with the following sequence parameters: repetition time 7.1 ms, field-of-view 487 x 325 mm, matrix 240x160, bandwidth 1360 Hz/Pixel, flip angle 12 degrees, nominal voxel size 2 mm in-plane, 5 mm slice thickness, scan time two minutes. Two separate three-echo sequences were run for each acquisition to allow for interleaving echo times of 1.8, 3.2, 4.6 ms and 2.5, 3.9, 5.3 ms. An open-sourced offline reconstruction toolbox based on the Iterative Decomposition of water and fat with Echo Asymmetry and Least-squares (IDEAL) algorithm was used to reconstruct the k-space into parametric fat fraction and R2* maps [1-5]. The periosteum of the proximal femur was manually segmented on the central, largest coronal 2D slice for each scan to compute the median fat fraction and R2* for each subject.RESULTS
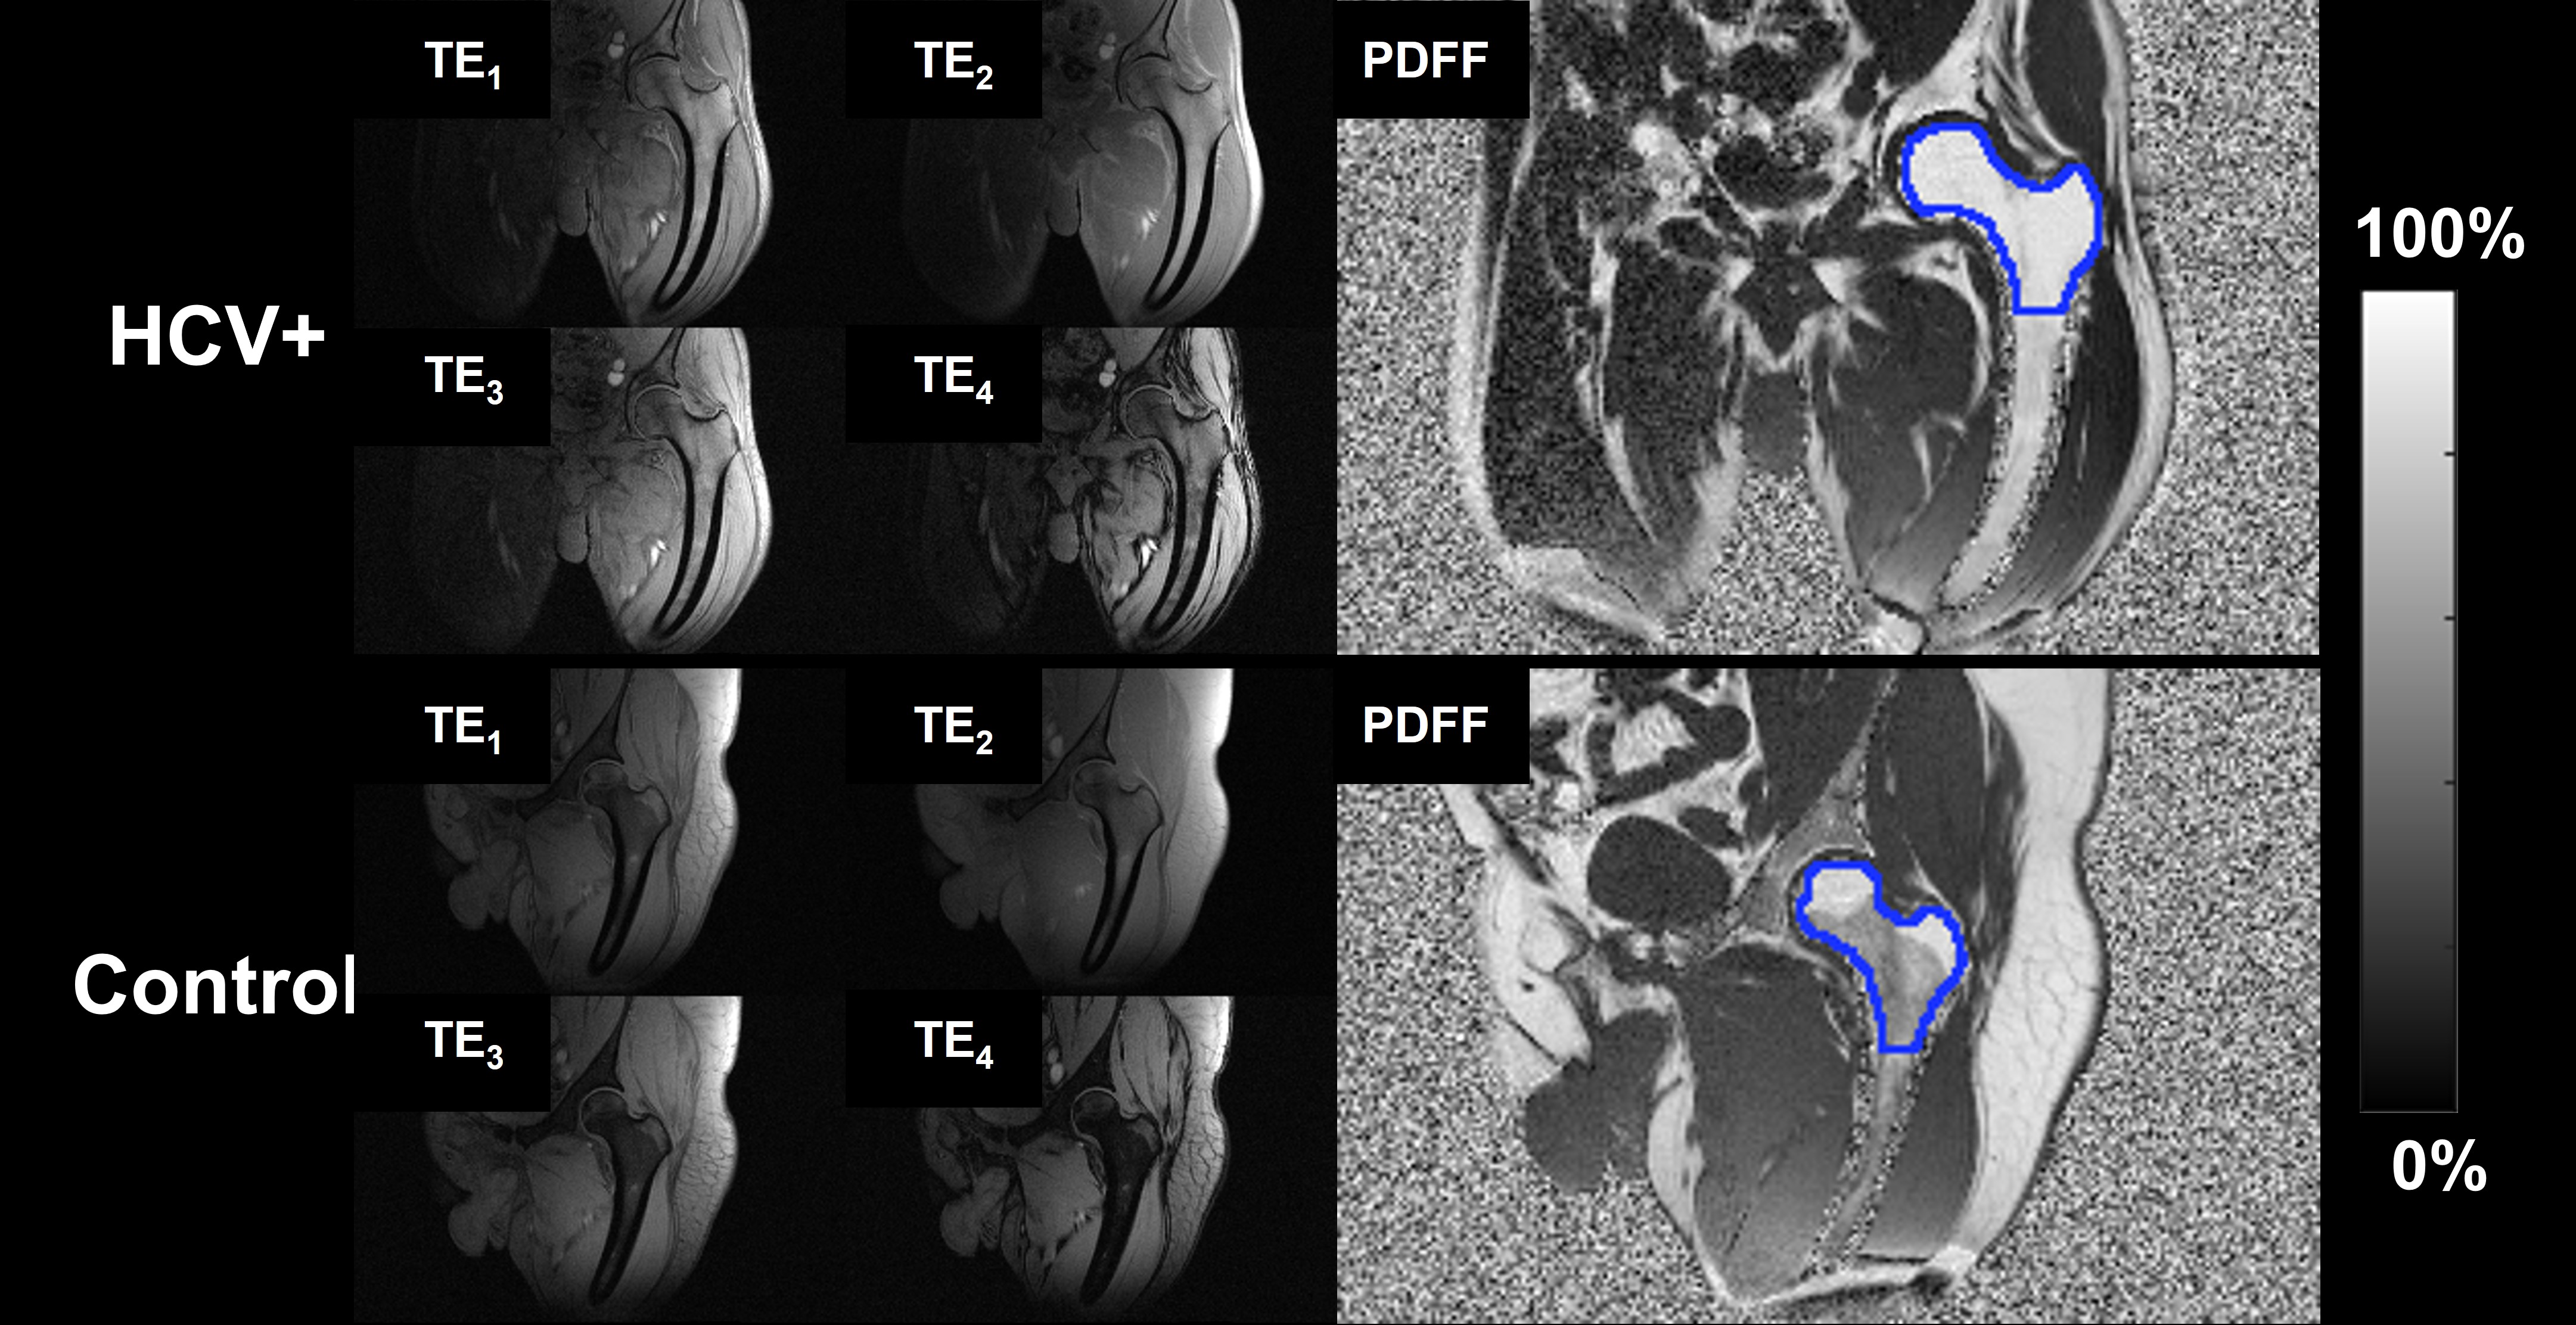
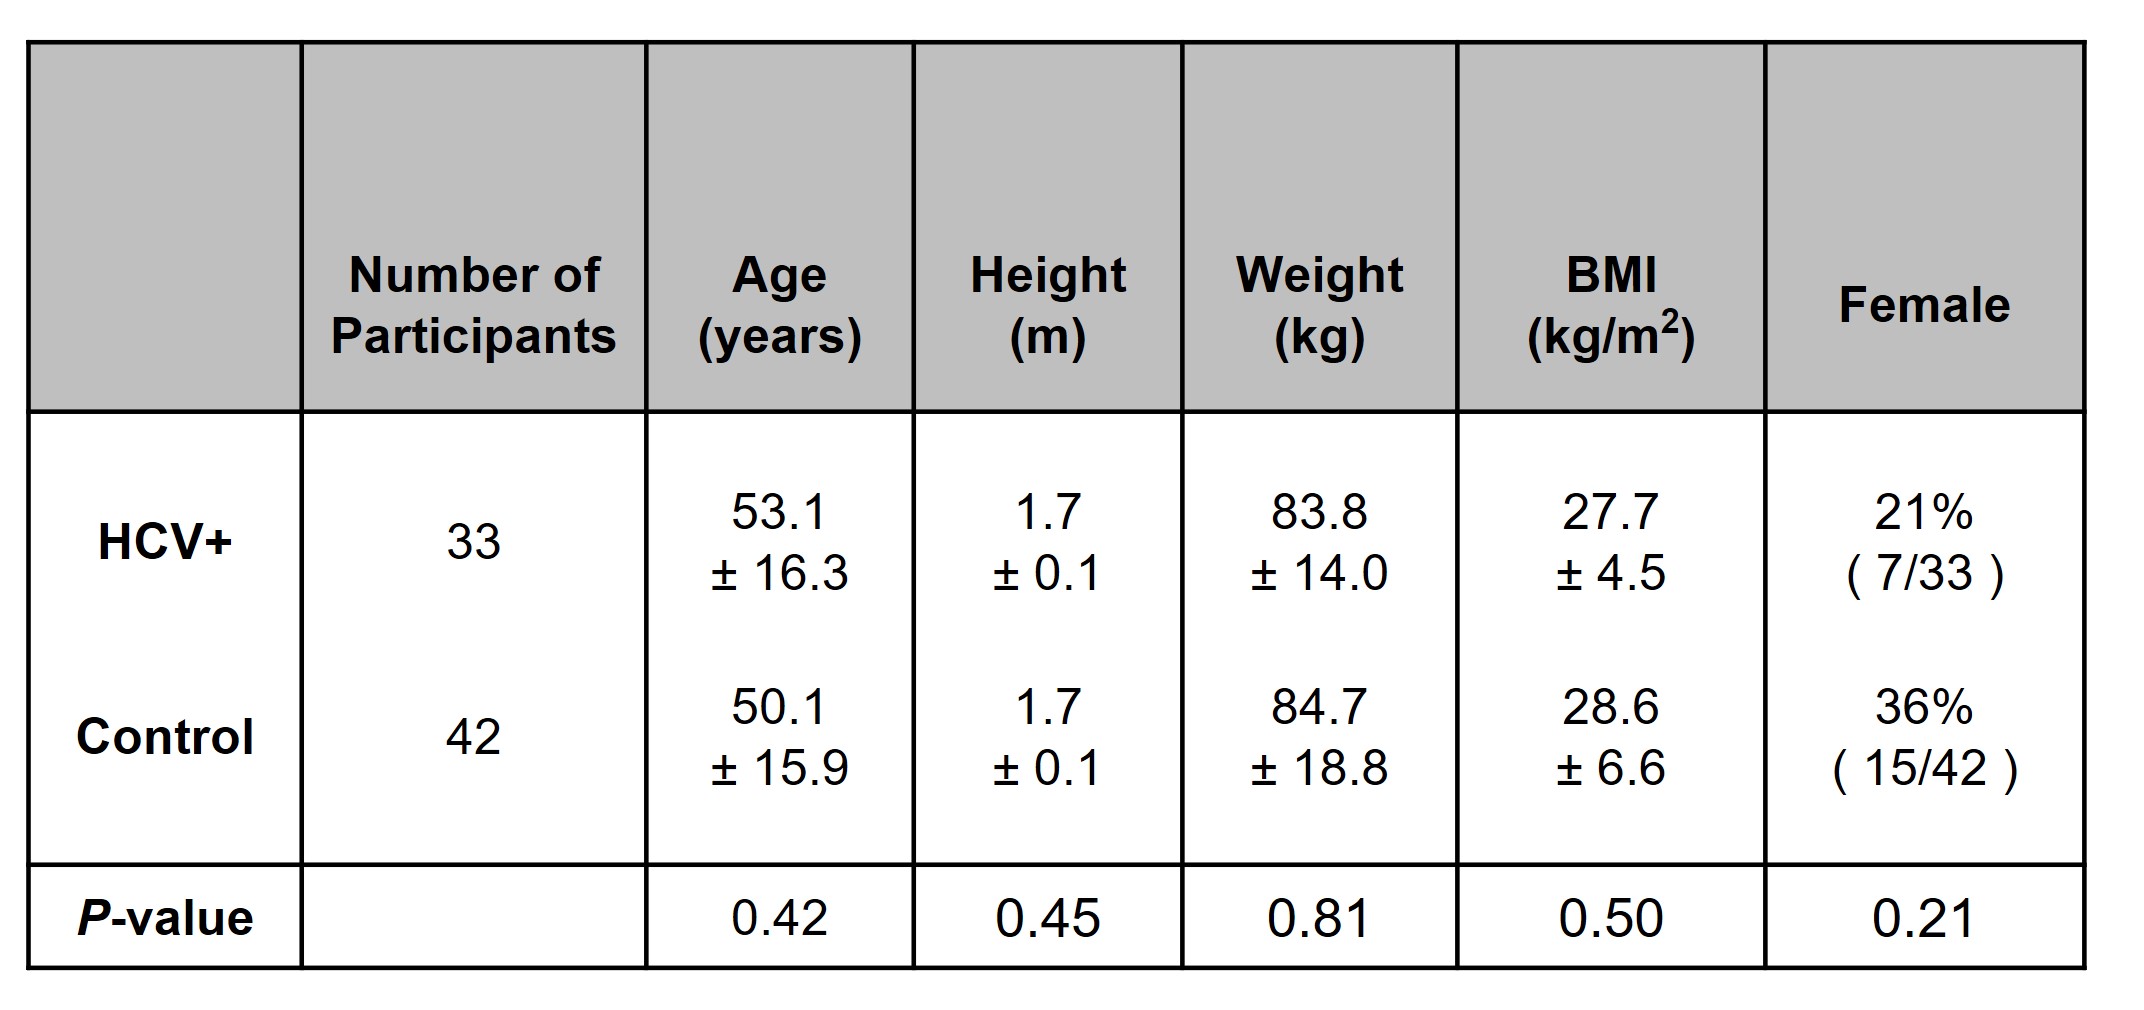
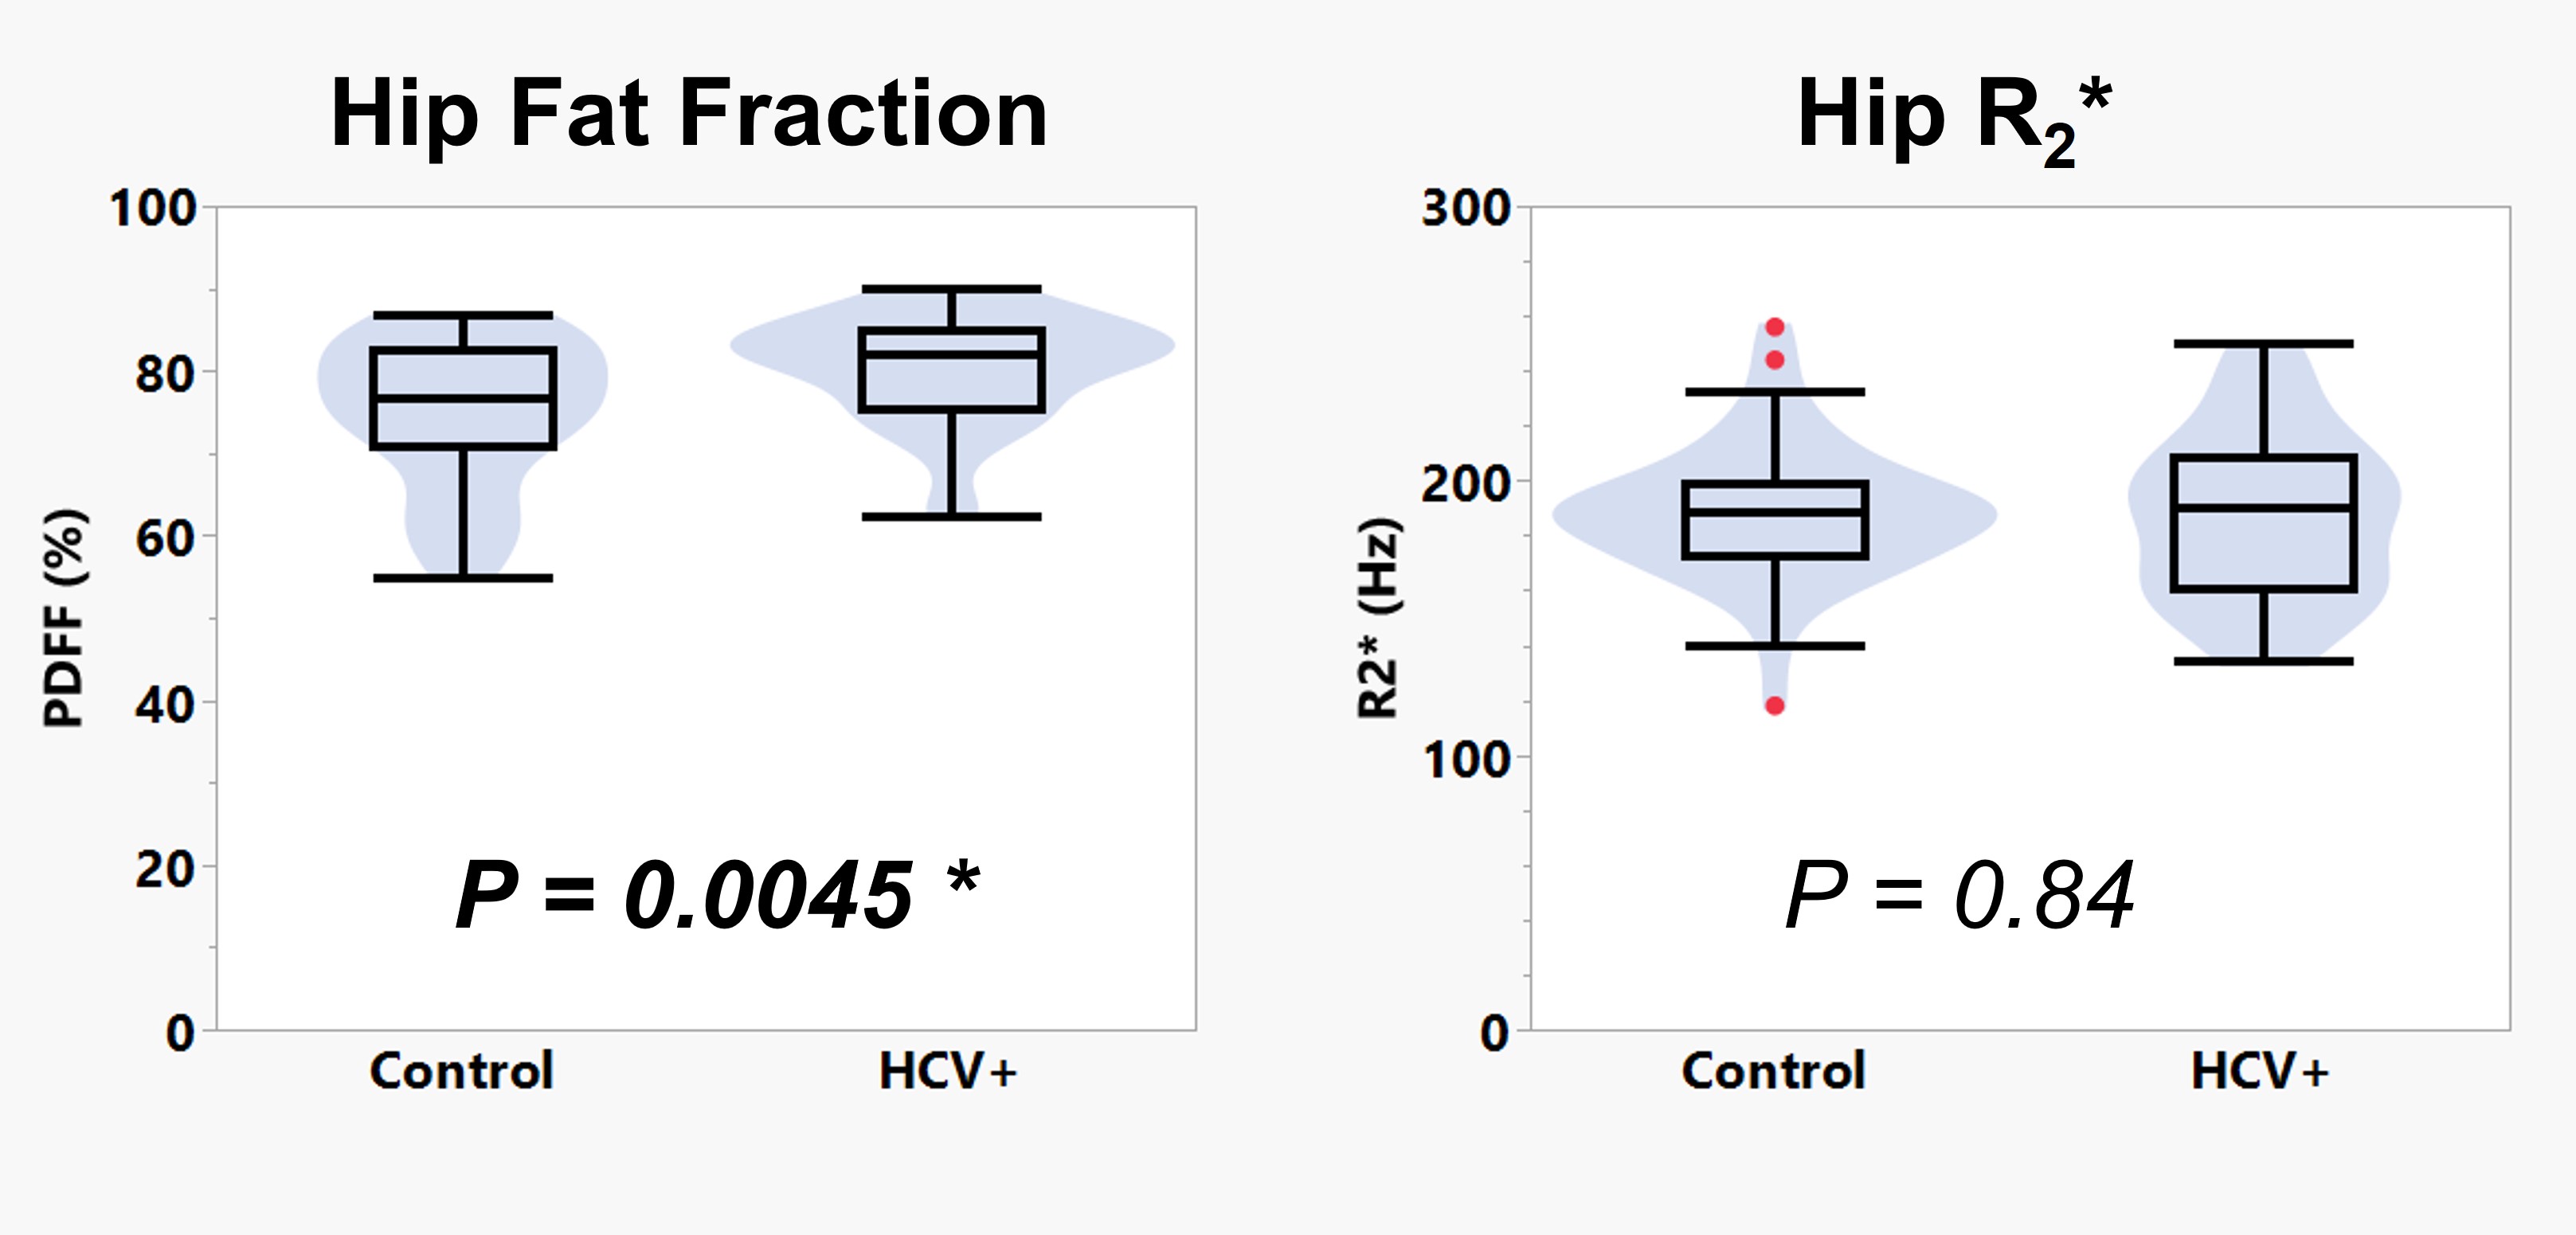
We recruited 33 participants with HCV+ infection and 42 age-, sex-, and race-matched HCV-uninfected controls. Table 1 details the demographics of both cohorts. We note that there were no significant differences in age, height, weight, body mass index (BMI), or gender distributions between the two cohorts (all p-values>0.20). Figure 1 illustrates representative MR images and bone marrow adiposity maps between the two cohorts. The results comparing quantitative biomarkers of bone marrow adiposity and R2* between the two groups are depicted in Table 2 and Figure 2. The HCV+ group had significantly elevated proton density fat fraction in the proximal femur compared to the controls (80.4 ± 6.6% vs 74.9 ± 9.1%, P=0.0045). There were no differences in the R2* between the two groups (P=0.84).DISCUSSION
Degradation of the trabecular bone network in osteoporosis is characterized by displacement of resorbed osseous tissue with marrow adiposity. Hence, quantitative assessment of bone marrow adiposity from chemical-shift-encoded MRI is a robust biomarker of bone quality. While previous retrospective studies have linked Hepatitis C infection to osteoporosis, this prospective study demonstrated that patients with HCV infection have elevated fat fraction in the proximal femur, suggesting impairment of the trabecular bone network. Ongoing work will investigate compartmental differences in marrow adiposity between the two groups, such as focusing on the femoral neck, greater trochanteric, and subtrochanteric regions, among others. Additionally, ongoing work is focused on analyzing other quantitative MRI biomarkers in these cohorts to explore trabecular bone microstructure and cortical porosity. Future work will track these participants longitudinally following treatment with direct acting antiviral medications to “cure” Hepatitis C with sustained virological response.CONCLUSION
This study was the first to demonstrate that patients with Hepatitis C have elevated bone marrow adiposity in the proximal femur.Acknowledgements
NIH R01 AR076392References
1. Pawlotsky, J.-M., et al., EASL recommendations on treatment of hepatitis C: Final update of the series☆. Journal of Hepatology, 2020. 73(5): p. 1170-1218.
2. Tao, J., et al., Seropositive for hepatitis B and C viruses is associated with the risk of decreased bone mineral density in adults: An analysis of studies from the NHANES database. Frontiers in Medicine, 2023. 10.
3. Wijarnpreecha, K., et al., Hepatitis C virus infection and risk of osteoporotic fracture: A systematic review and meta-analysis. J Evid Based Med, 2018. 11(1): p. 20-25.
4. Biver, E., A. Calmy, and R. Rizzoli, Bone health in HIV and hepatitis B or C infections. Ther Adv Musculoskelet Dis, 2017. 9(1): p. 22-34.
5. Gaudio, A., et al., Reduction of volumetric bone mineral density in postmenopausal women with hepatitis C virus-correlated chronic liver disease: a peripheral quantitative computed tomography (pQCT) study. Eur J Intern Med, 2012. 23(7): p. 656-60.
6. Orsini, L.G.S., et al., Bone Mineral Density Measurements, Bone Markers and Serum Vitamin D Concentrations in Men with Chronic Non-Cirrhotic Untreated Hepatitis C. PLOS ONE, 2013. 8(11): p. e81652.
7. Lo Re, V., 3rd, et al., Risk of hip fracture associated with hepatitis C virus infection and hepatitis C/human immunodeficiency virus coinfection. Hepatology, 2012. 56(5): p. 1688-98.
8. Vu, B.-T.D., et al., Six-minute, in vivo MRI quantification of proximal femur trabecular bone 3D microstructure. Bone, 2023. 177: p. 116900.
Figures