0486
Ultrashort echo time quantitative magnetization transfer (UTE-qMT) MRI distinguishes human diabetic bones from healthy ones1Department of Radiology, University of California, San Diego, La Jolla, CA, United States, 2Department of Bioengineering, University of California, San Diego, La Jolla, CA, United States, 3Radiology Service, VA San Diego Healthcare System, La Jolla, CA, United States, 4Department of Medicine, University of California, San Diego, La Jolla, CA, United States, 5Department of Orthopedic Surgery, University of California, San Diego, La Jolla, CA, United States
Synopsis
Keywords: Bone, Diabetes, Bone
Motivation: There is no standardized method to probe bone quality, a key determinant of bone fracture risk of type 2 diabetes patients.
Goal(s): We tested whether UTE quantitative MT (UTE-qMT) imaging and UTE-based water pool measurement can distinguish diabetic bones from healthy ones.
Approach: Twenty-two ex vivo human diabetic bones and 13 healthy ones were scanned with UTE-MT, proton density UTE, and inversion recovery UTE sequences to measure qMT parameters and fractions of pore and bound water pools.
Results: The proton exchange rates from UTE-qMT showed a significant decrease in diabetic bones.
Impact: The proton exchange rate measured via UTE-qMT can distinguish diabetic bones from healthy ones. UTE-qMT may provide insight into molecular-scale bone quality that explains the increased fracture risk in type 2 diabetes patients despite the increased bone mineral density.
Introduction
Diabetes is often followed by an increased risk of bone fracture, assessed via measurement of bone mineral density (BMD) by DXA and CT scans1. Yet, in the case of type 2 diabetes, a counterintuitive BMD increase is often reported despite the increased risk of fracture2. While it is well known that not only bone quantity but also quality, such as the degree of collagen crosslinking, is a significant factor determining the fracture risk, there are no established methods to noninvasively monitor such molecular scale features3. Quantitative magnetization transfer (qMT) MRI has been widely studied not only for quantifying macromolecular proton fraction (MMF) but also for probing tissue microenvironment by measuring their exchange with surrounding water protons4. The qMT technique was combined with ultrashort echo time (UTE) MRI to acquire molecular information of short T2 tissues, including cortical bones5. In this study, we examined whether UTE-qMT can distinguish diabetic cortical bones from healthy ones. We also tested the diagnostic potential of UTE-based measurements of pore and bound water pools for diabetic bones.Methods
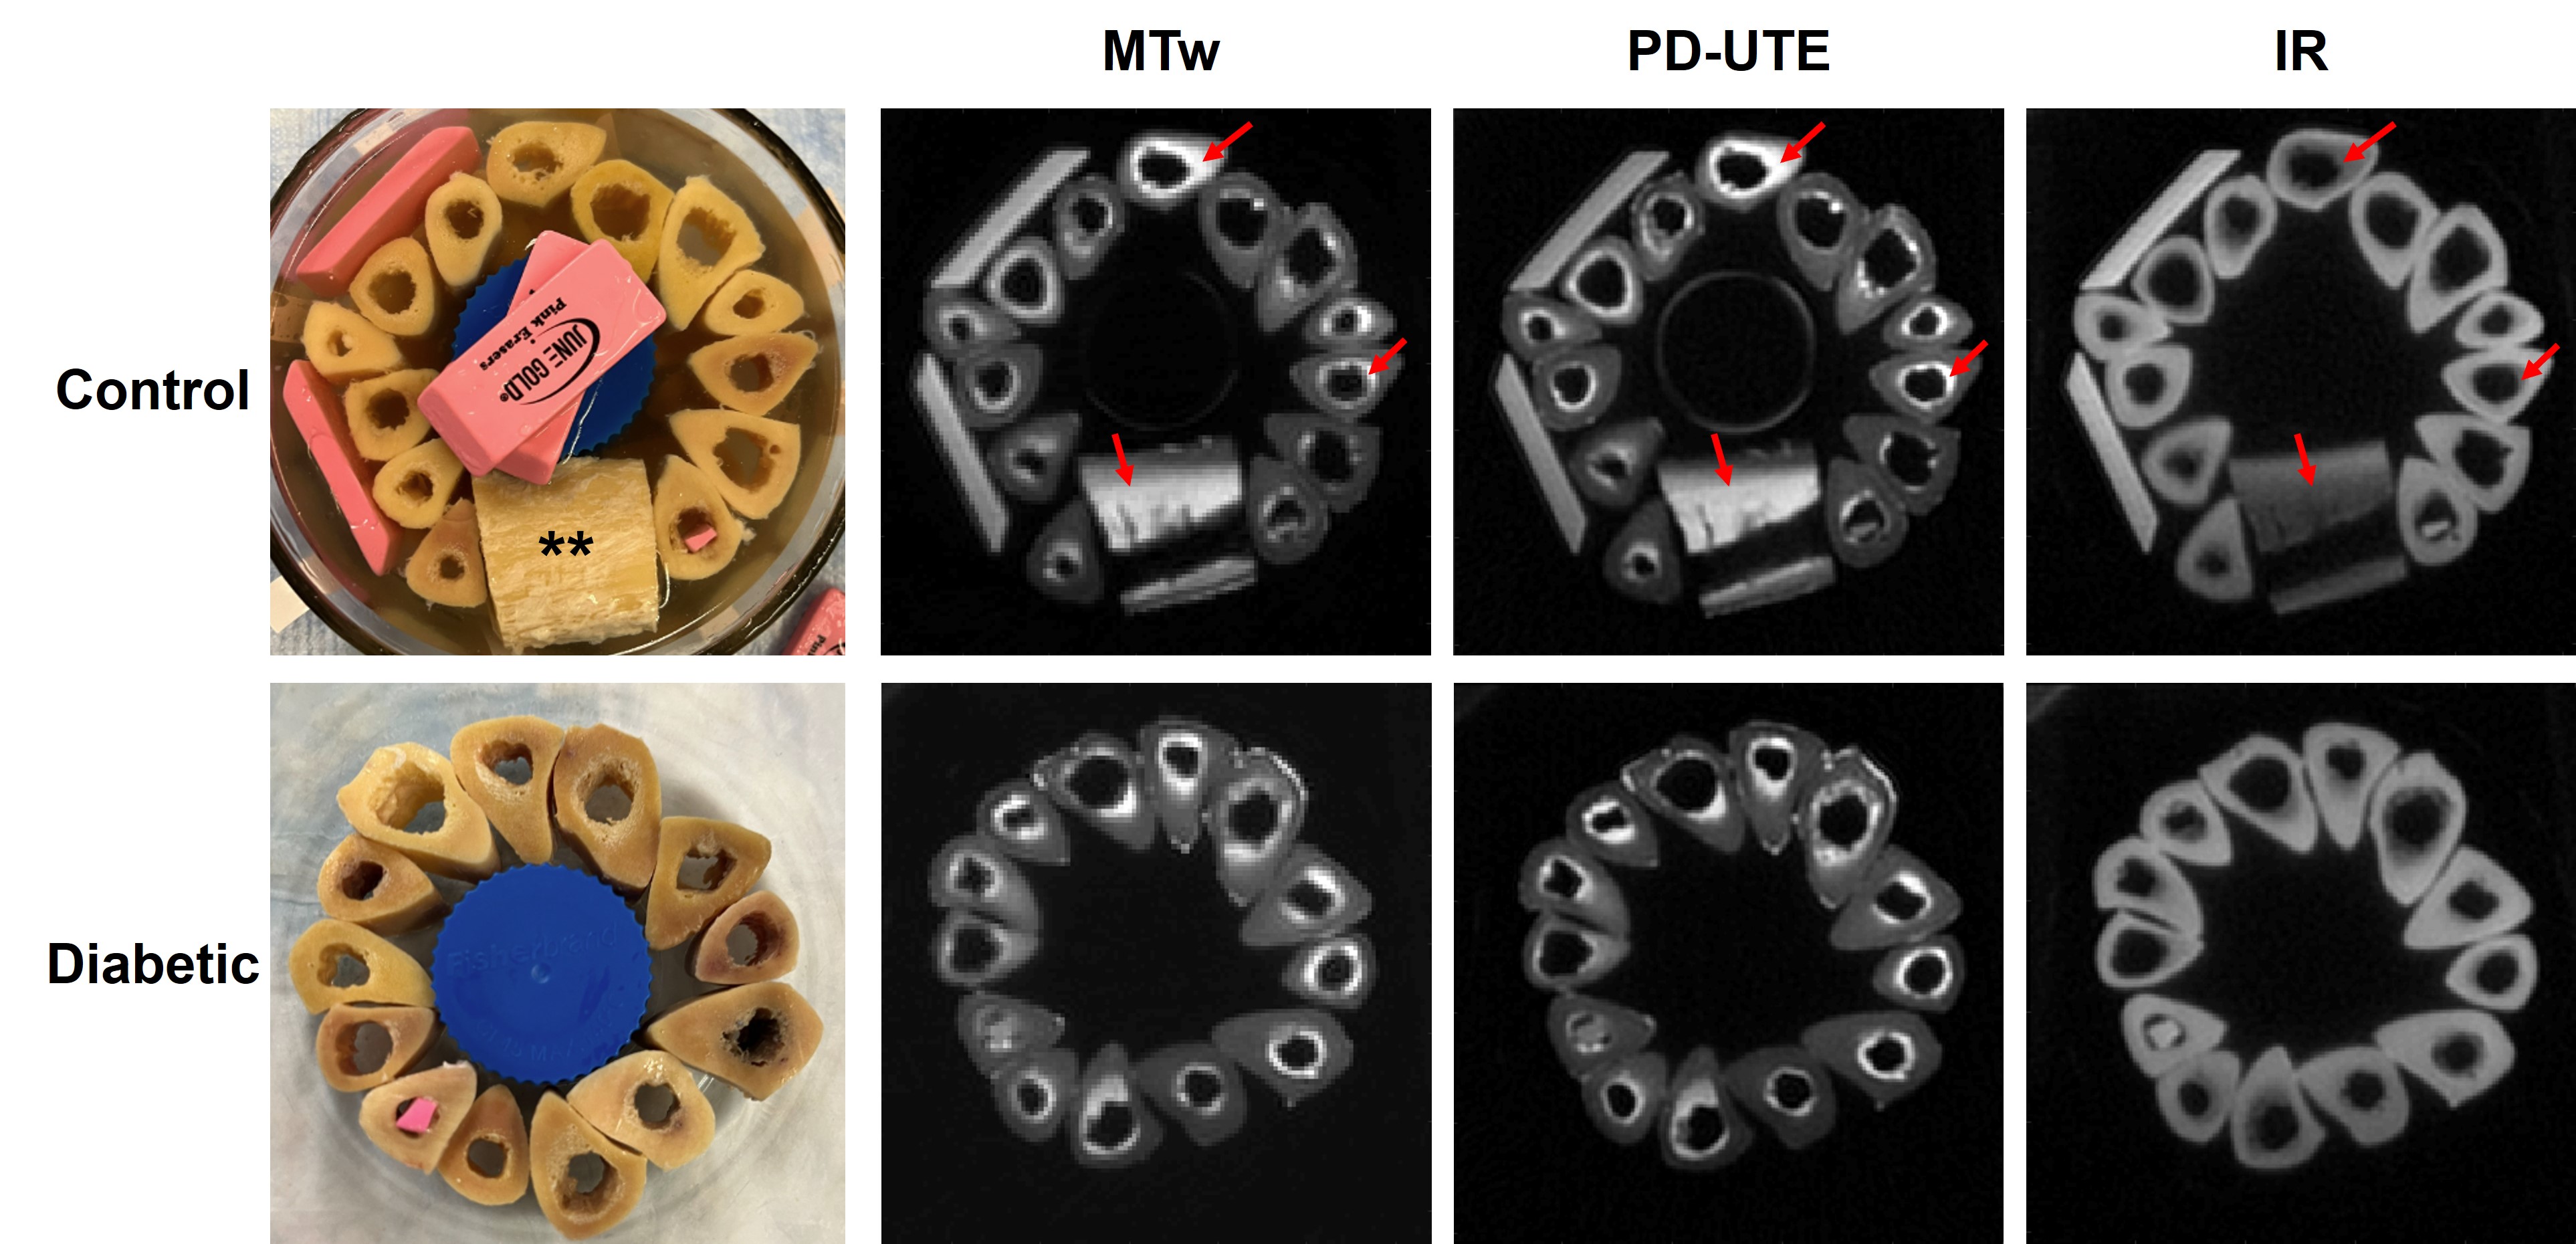
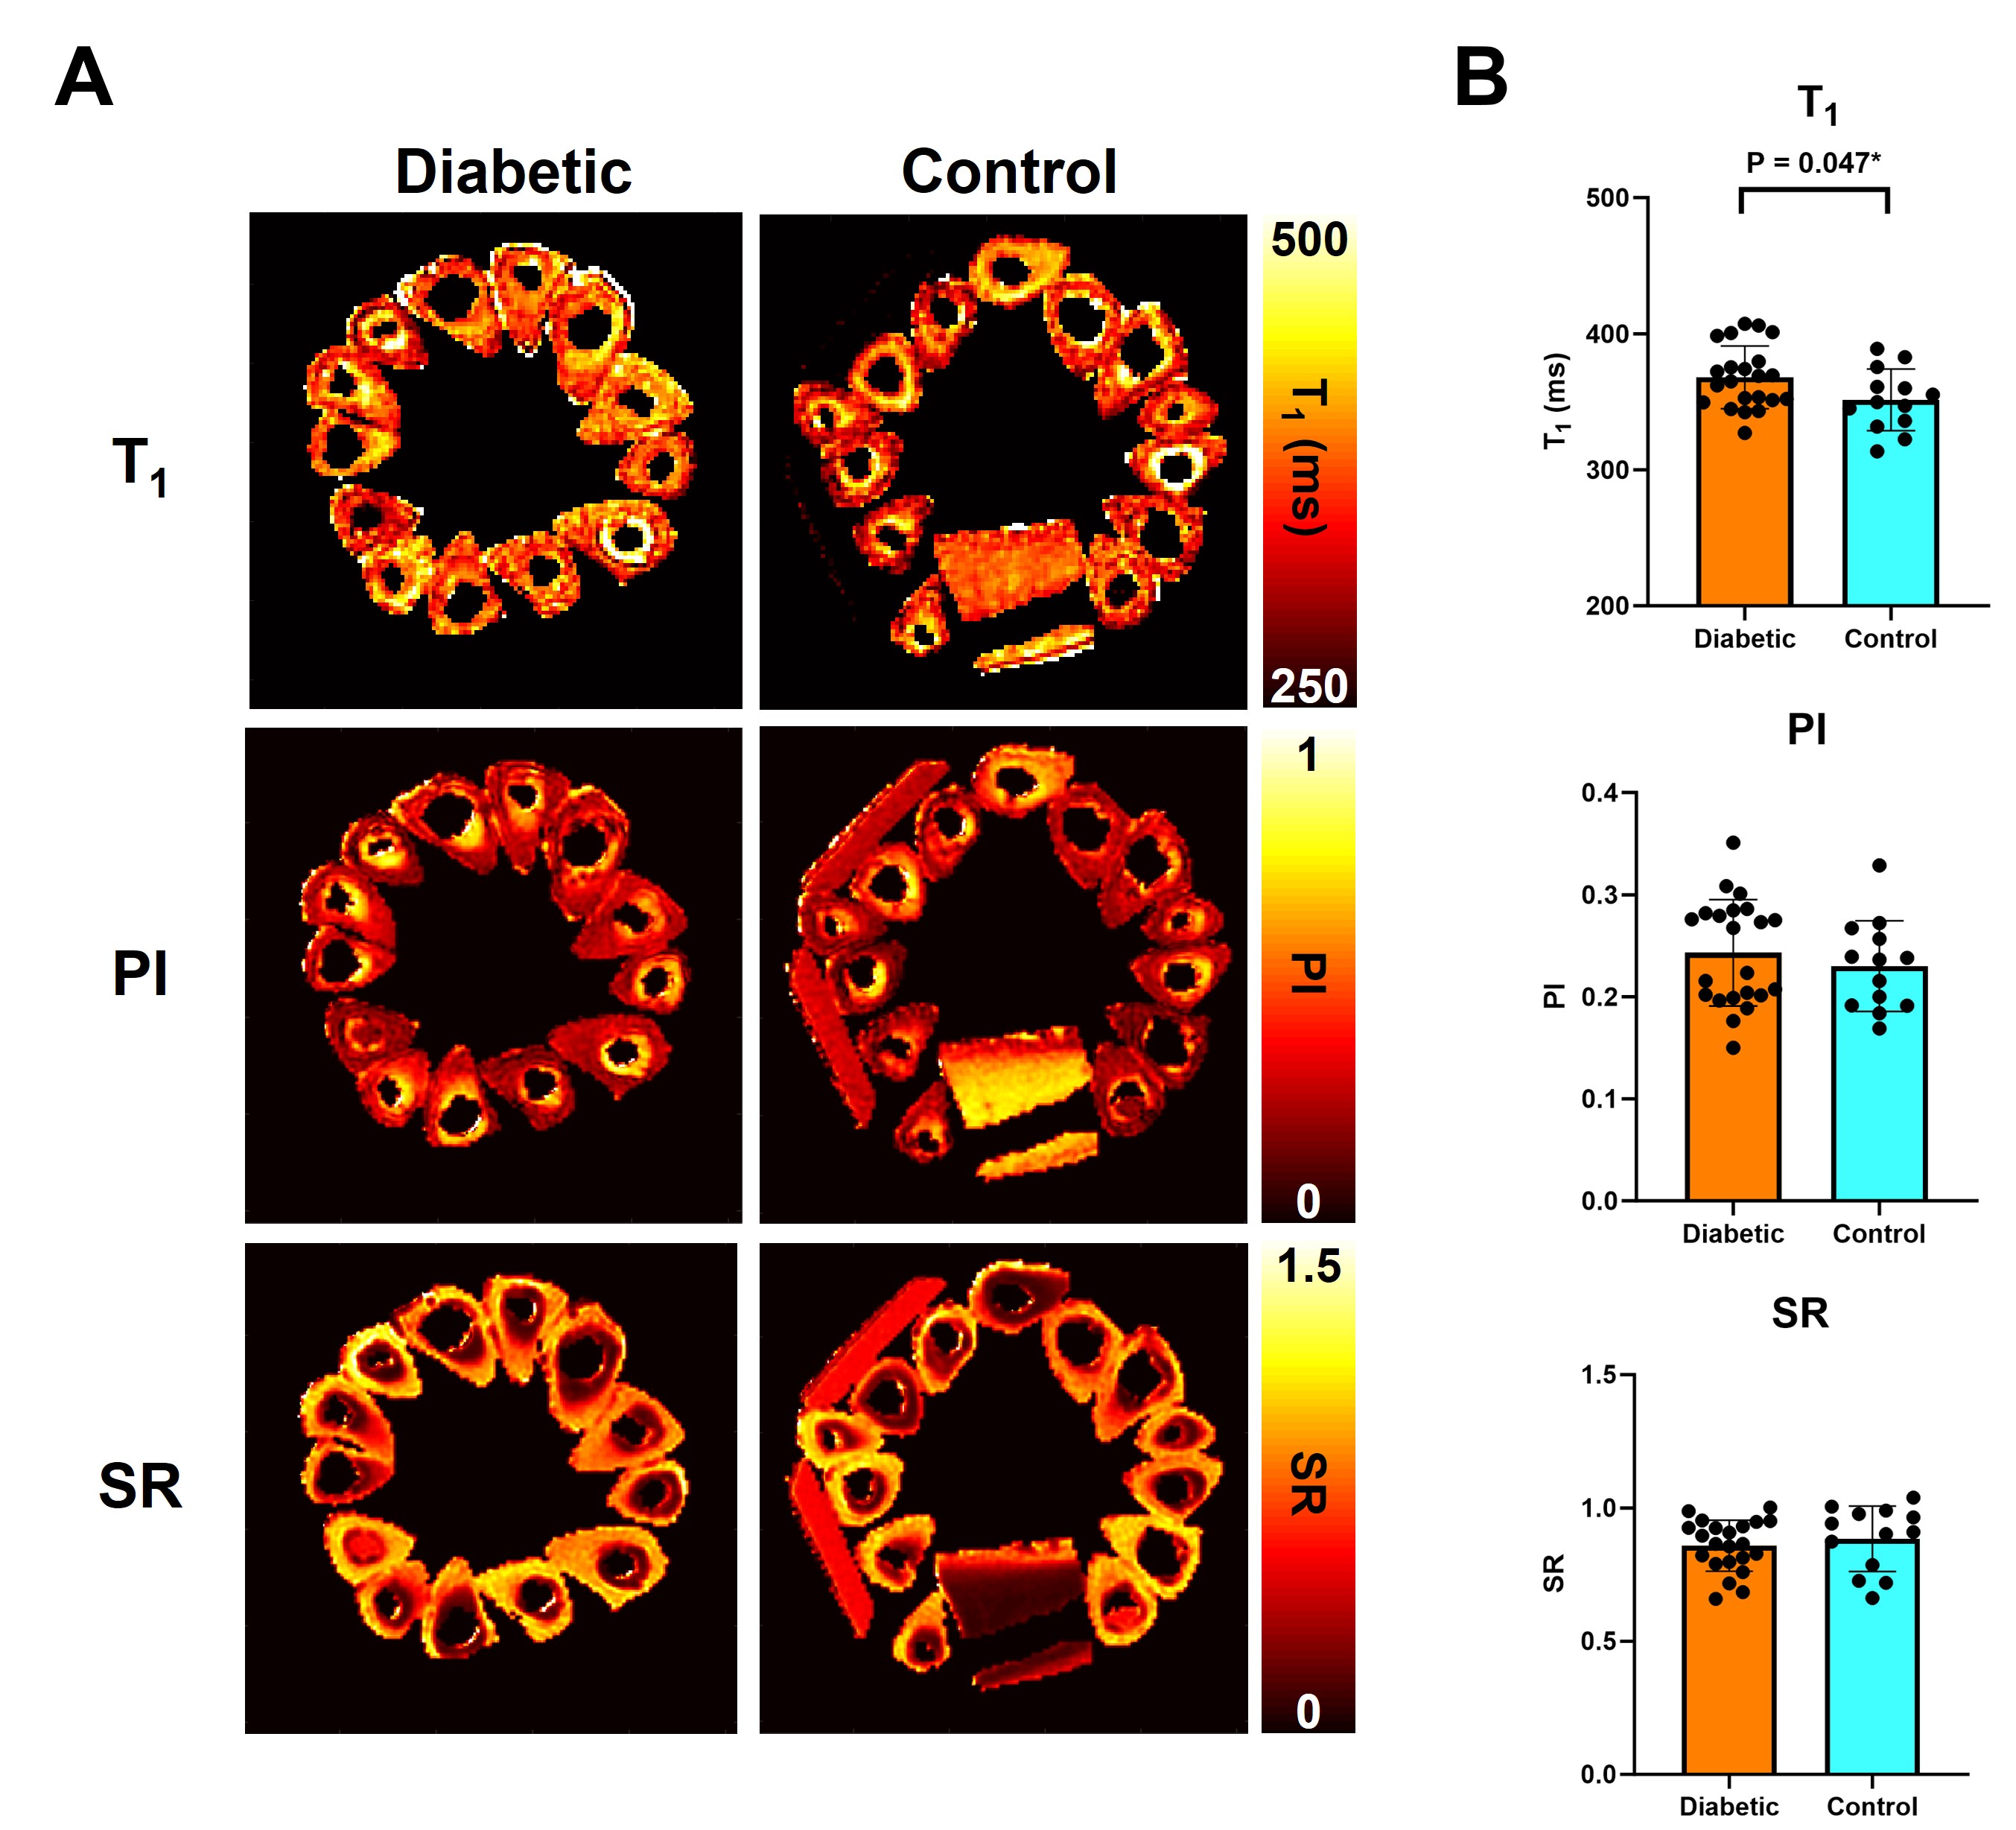
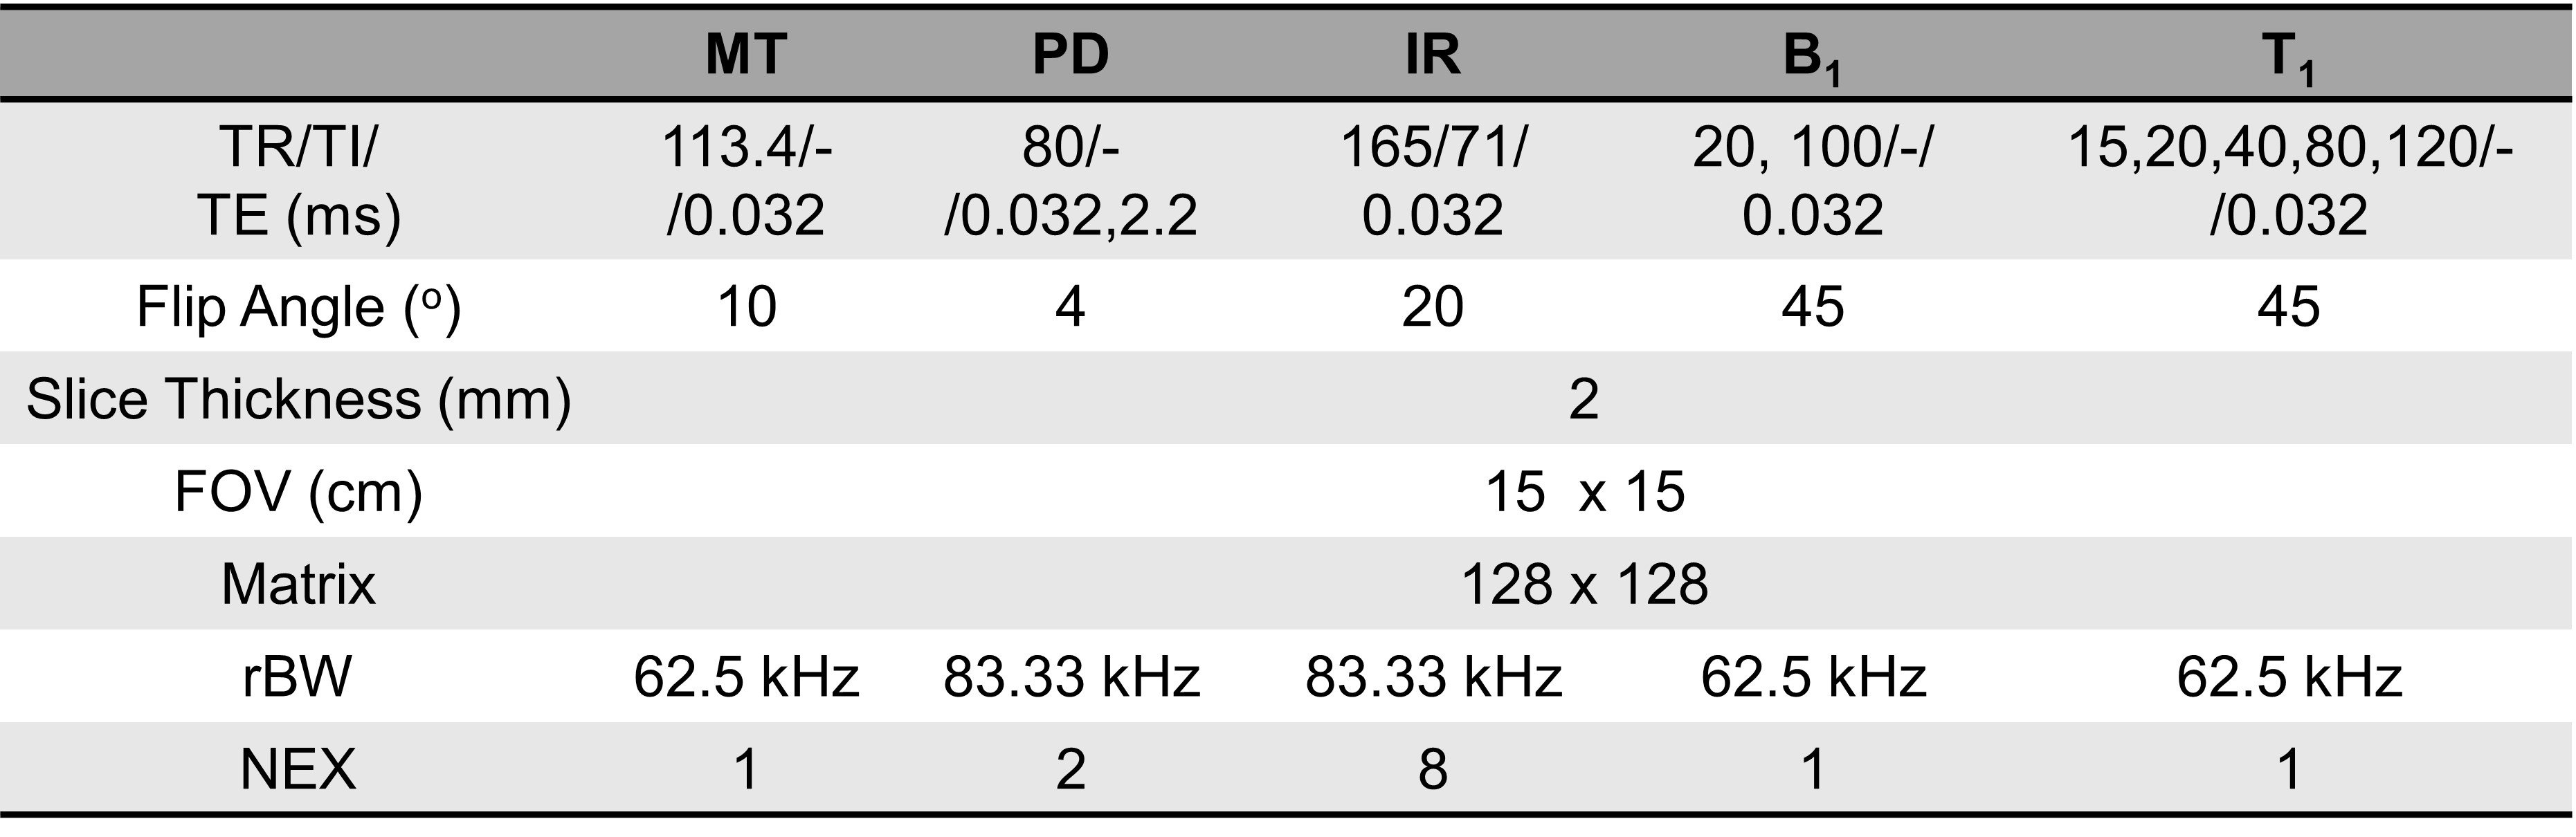
A total of 43 human ex vivo femoral and tibial bone samples were scanned at 3T (MR750, GE Healthcare), of which 8 samples were excluded from analysis due to other confounding complications reported (control: n = 13, age = 46.4±10.9; type 2 diabetic: n = 22, age = 69.4±13.8). The bone samples were placed in Fomblin for a susceptibility-matching purpose (Figure 1). An 8-channel head coil was used for scans, and MT-weighted images, dual-echo proton density images, and inversion recovery (IR) images were acquired. B1 maps and T1 maps were also acquired via actual flip angle with variable repetition time (AFI-VTR) method for qMT analysis6. Detailed scan parameters are summarized in Table 1. Region of interest (ROI)-based UTE-qMT fitting was applied to a series of MT-weighted images for measuring qMT parameters for each bone sample7. Porosity index (PI) and suppression ratio (SR) were calculated by normalizing the PD-UTE image by the second echo of the PD image (PI) and normalizing the IR image by the PD-UTE image (SR), respectively8-10. A two-tailed t-test was performed for statistical comparison between two groups with a significance level of 0.05. The normality of the data was confirmed via the Shapiro-Wilk test.Results
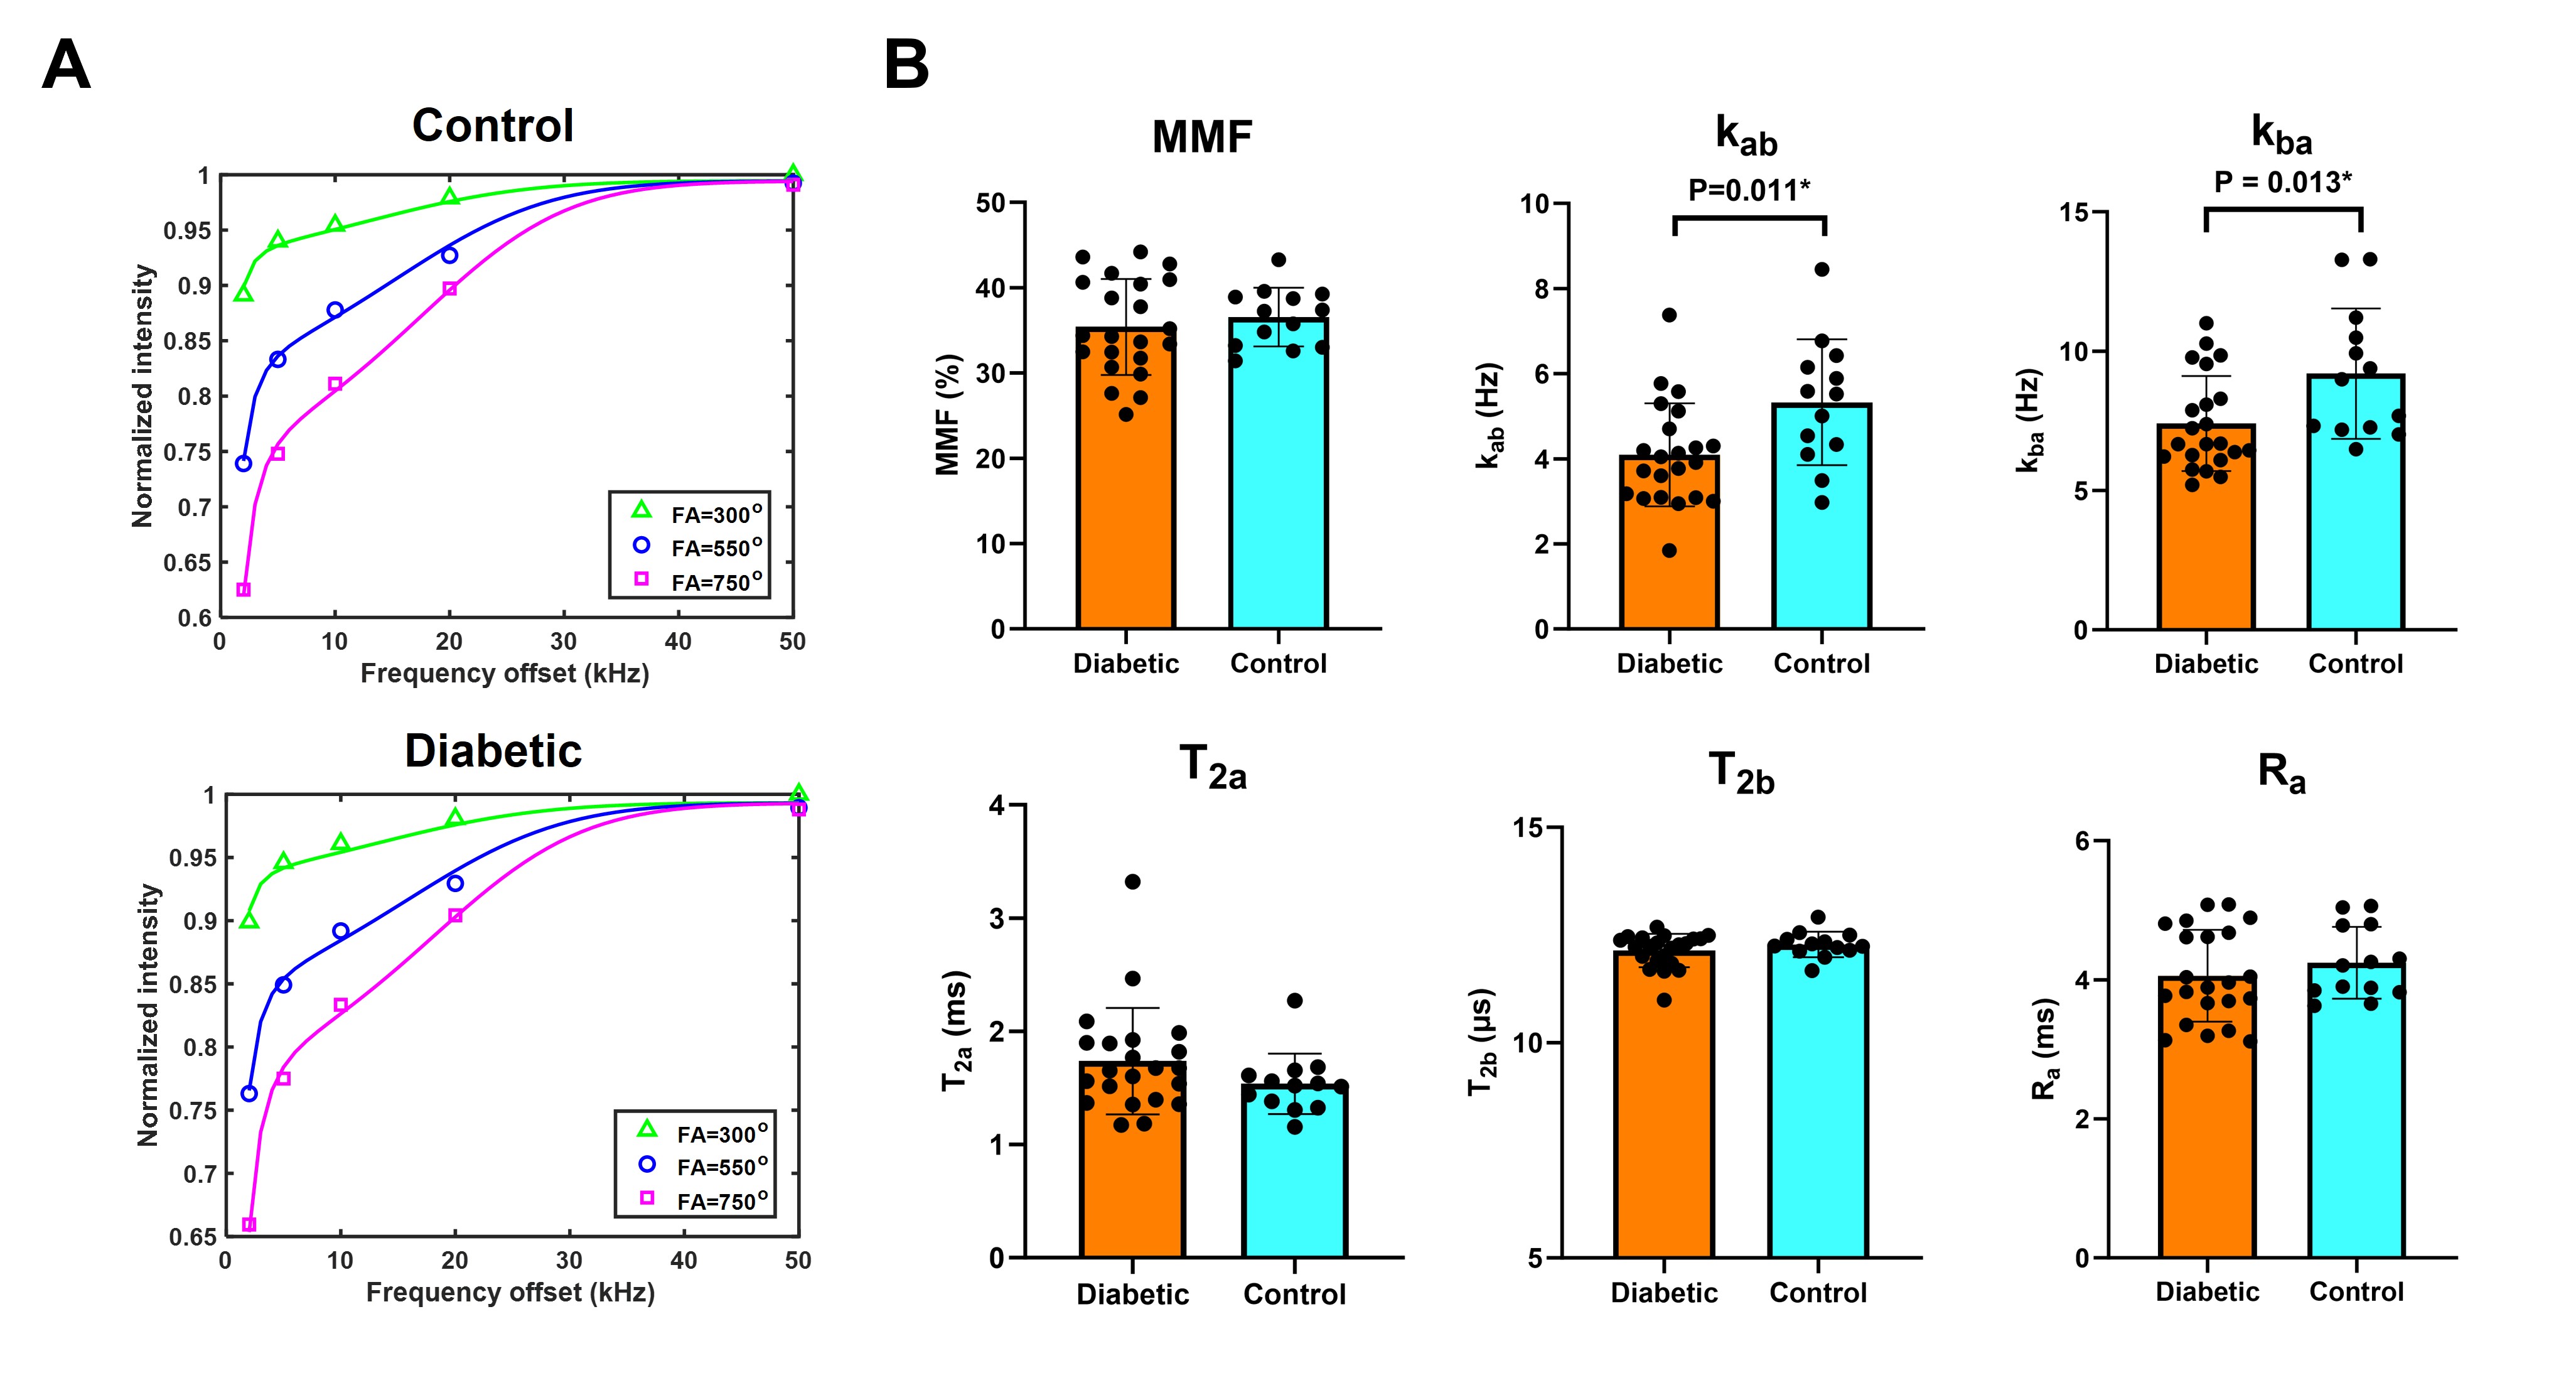
All the UTE scans generated images with sufficient signal-to-noise ratio for quantitative analysis (Figure 1). IR images effectively suppressed the long T2 signals from residual trabecular bones and fat. MT-weighted images generated reliable ROI-based UTE-qMT fitting (normalized mean squared error < 1%, Figure 2A) and subsequent qMT parameter measurements (Figure 2B). While other qMT parameters did not show a significant difference between diabetic and control bones, magnetization exchange rates showed a substantial difference between the two groups (kab: 4.09±1.21 vs. 5.33±1.48 Hz, P = 0.011; kba: 7.40±1.71 vs. 9.19±2.34 Hz, P = 0.013). While there were no differences in PI and SR, T1 relaxation time showed a significant, but not substantial difference between diabetic and control bones (368.05±23.08 vs. 351.48±22.58 ms, P = 0.047).Discussion
UTE-qMT, PD, and IR sequences generated images with sufficient qualities for accurate quantitative analysis. UTE-qMT analysis showed a reduced proton exchange rate between the water pool and macromolecular pool in diabetic bones while MMF was preserved. The unchanged MMF may be explained by the similar body mass index (BMI) of tissue donors between the two groups (Diabetic: 24.8±5.2 vs. Control: 25.7±8.1, P = 0.686) in this study, as BMI has been shown to be positively correlated with BMD11. The preserved MMF also aligns with the unchanged PI and SR. The decreased exchange rates in diabetic bones may be due to the glycation-associated collagen crosslinking, as proton exchange rates are affected by the degree of crosslinking of macromolecules12,13. The small increase of T1 relaxation time in diabetic bones despite the preserved PI and SR may be due to altered water distribution after collagen crosslinking, but further systematic investigation is needed to correlate these observations with underlying pathology14. The UTE-qMT and water pool measurements should also be compared with BMD in the future.Conclusion
The proton exchange rate between water and macromolecular pool measured by UTE-qMT is a potential imaging marker for assessing the quality of diabetic bones, which cannot be achieved by currently available diagnostic tools.Acknowledgements
The authors acknowledge grant support from National Institutes of Health (R01AR062581, R01AR068987, R01AR075825, K01AR080257 and R01AR079484, and RF1AG075717), VA Research and Development Services (Merit Awards I01CX001388, I01CX002211, and I01BX005952), DFG (SE 3272/1-1) and GE Healthcare.References
1. Leslie WD, Rubin MR, Schwartz Ann et al., Type 2 diabetes and bone. J Bone Miner Res. 2012;27:2231-2237.
2. Vestergarrd P. Discrepancies in bone mineral density and fracture risk in patients with type 1 and type 2 diabetes—a meta-analysis. Osteoporos Int. 2007;18:427-444.
3. Dhaliwal R, Cibula D, Ghosh C et al., Bone quality assessment in type 2 diabetes mellitus. Osteoporos Int. 2014;25:1969-1973.
4. Louie EA, Gochberg DF, Does MD et al., Transverse relaxation and magnetization transfer in skeletal muscle: Effect of pH. Magn Reson Med. 2009;61:560-569.
5. Jerban S, Ma Y, Dorthe EW et al., Assessing cortical bone mechanical properties using collagen proton fraction from ultrashort echo time magnetization transfer (UTE-MT) MRI modeling. Bone Reports. 2019;11:100220.
6. Ma Y, Lu X, Carl M et al., Accurate T1 mapping of short T2 tissues using a three-dimensional ultrashort echo time cones actual flip angle imaging-variable repetition time (3D UTE-Cones AFI-VTR) method. Magn Reson Med. 2018;80:598-608.
7. Ma Y, Chang EY, Carl M et al., Quantitative magnetization transfer ultrashort echo time imaging using a time‐efficient 3D multispoke Cones sequence. Magn Reson Med. 2018;79:692-700.
8. Jerban S, Ma Y, Alenezi S et al., Ultrashort echo time (UTE) MRI porosity index (PI) and suppression ratio (SR) correlate with the cortical bone microstructural and mechanical properties: Ex vivo study. Bone. 2023;169:116676.
9. Rajapakse S, Bashoor-Zadeh M, Li C et al., Volumetric Cortical Bone Porosity Assessment with MR Imaging: Validation and Clinical Feasibility. Radiology, 2015; 276:526–535.
10. Li C, Seifert AC, Rad HS, et al. Cortical bone water concentration: dependence of MR imaging measures on age and pore volume fraction. Radiology, 2014; 272:796–806.
11. Ma L, Oei L, Jiang L, et al., Association between bone mineral density and type 2 diabetes mellitus: a meta-analysis of observational studies. Eur J Epidemiol. 2012;27:319-332.
12. Saito M, Marumo K. Collagen cross-links as a determinant of bone quality: a possible explanation for bone fragility in aging, osteoporosis, and diabetes mellitus. Osteoporos Int. 2010;21:195-214.
13. Fishbein KW, Gluzband YA, Kaku M et al., Effects of formalin fixation and collagen cross-linking on T2 and magnetization transfer in bovine nasal cartilage. Magn Reson Med. 2007;57:1000-1011.
14. Nishad Fathima M, Baias M, Blumich B et al., Structure and dynamics of water in native and tanned collagen fibers: Effect of crosslinking. Int J Biol Macromol. 2010;47:590-596.
Figures