0484
Improving Accuracy and Repeatability of Cartilage T2 Mapping in the OAI Dataset through Extended Phase Graph Modeling1Department of Radiology, Stanford University, Stanford, CA, United States
Synopsis
Keywords: Osteoarthritis, Osteoarthritis, Cartilage, MSK, Quantitative Imaging, Data Processing
Motivation: Current methods for T2 fitting in the OAI dataset are based on exponential models, which are inherently sub-optimal as they do not account for stimulated echoes and B1 inhomogeneities.
Goal(s): To study whether EPG-Model fitting methods improve accuracy and repeatability of T2 mapping in the OAI dataset compared to conventional methods.
Approach: We set up three EPG modelling approaches: nonlinear-least-square, dictionary matching, and deep learning. We used simulations and data from the OAI dataset to evaluate accuracy, repeatability.
Results: We found that EPG-based methods had higher accuracy and repeatability than exponential-based methods commonly used to compute T2 maps in the OAI dataset.
Impact: We have demonstrated that EPG-based methods improved accuracy and repeatability of T2 mapping in the OAI dataset over the commonly used mono-exponential fitting methods. This permits more robust analysis of T2 information in the OAI dataset, especially in longitudinal analyses.
Introduction
The Osteoarthritis Initiative (OAI) collected extensive longitudinal data from ~4000 participants1 to try to understand the onset and pathogenesis of OA. Quantitative MRI in the OAI utilized a Multi-Echo Spin-Echo (MESE) sequence for knee cartilage T2 relaxation time measurement. Although not fully exploited, this dataset has been used to gauge T2 sensitivity to osteoarthritis2-4 (OA). Current MESE fitting methods in the OAI predominantly utilize mono-exponential models for T2 mapping2-4, which is inherently sub-optimal as it does not account for stimulated echoes produced by RF slice-profile, B1 inhomogeneities and often fails to account for low SNR in longer TEs. To mitigate errors due to stimulated echoes, the first echo is often discarded sacrificing valuable data and diminishing SNR efficiency. T2 fitting exploiting the Extended Phase Graph (EPG) formalism5 has been shown to improve accuracy in MESE T2 mapping in multiple body regions6,7. However, such an approach has not been investigated for the OAI dataset. This study investigates the effectiveness of EPG modeling for accurate and robust T2 mapping within the OAI. We propose three EPG-based techniques: nonlinear least squares (NLSQ), dictionary matching (DM), and deep learning (DL), evaluating their accuracy, and repeatability, and comparing their performance to conventional mono-exponential approaches.Methods
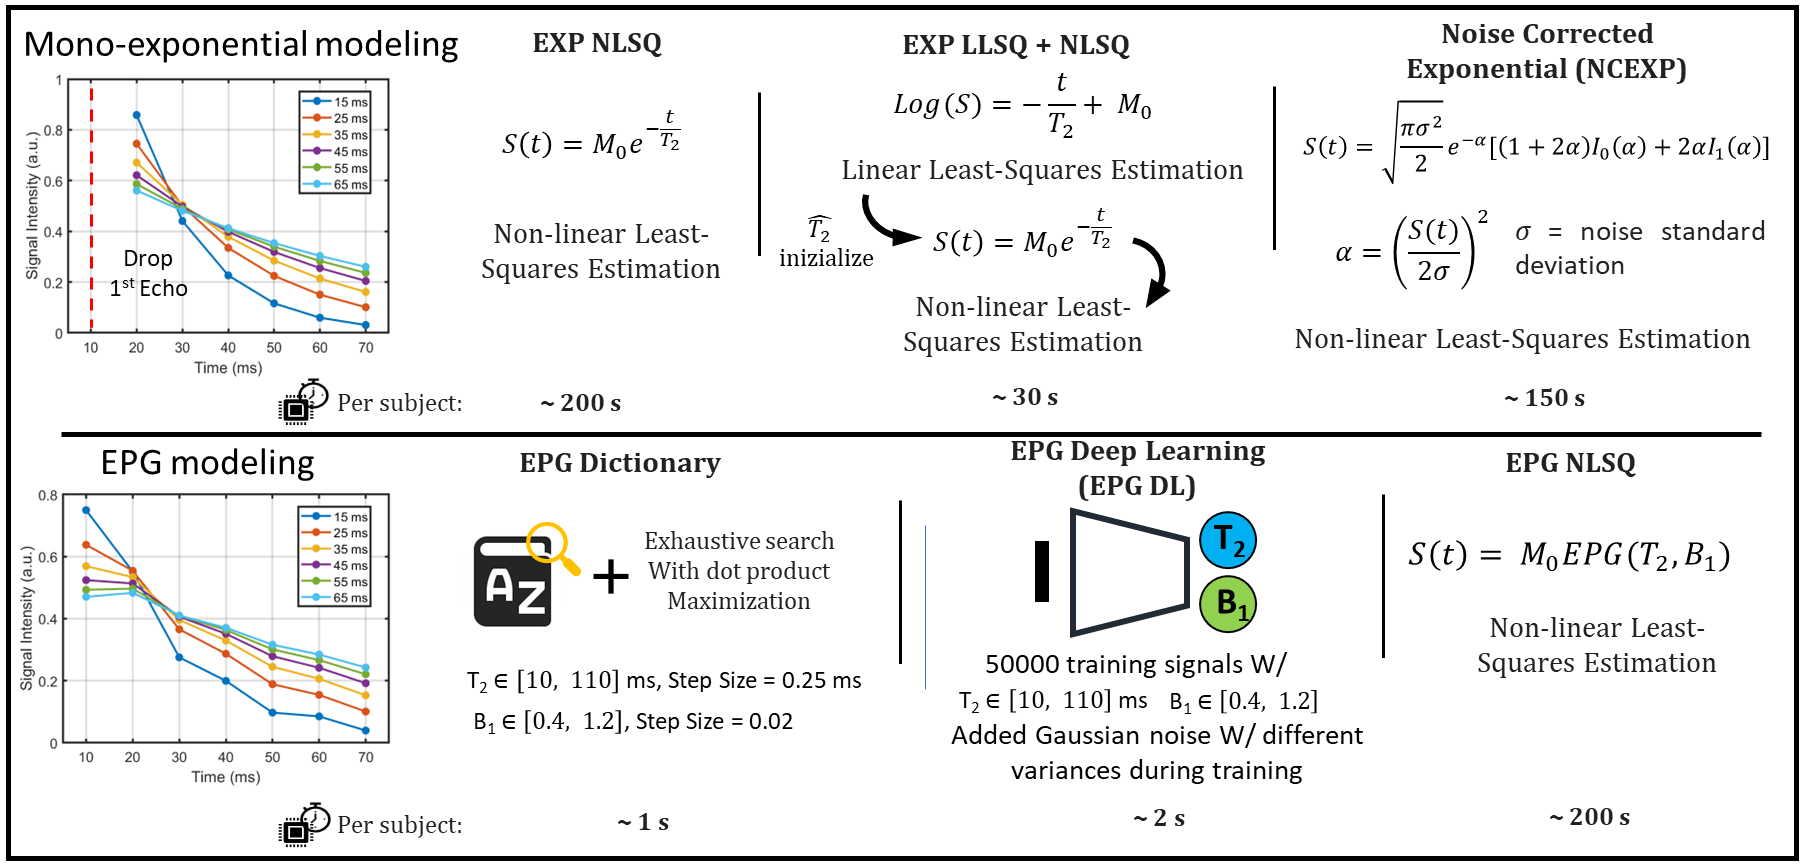
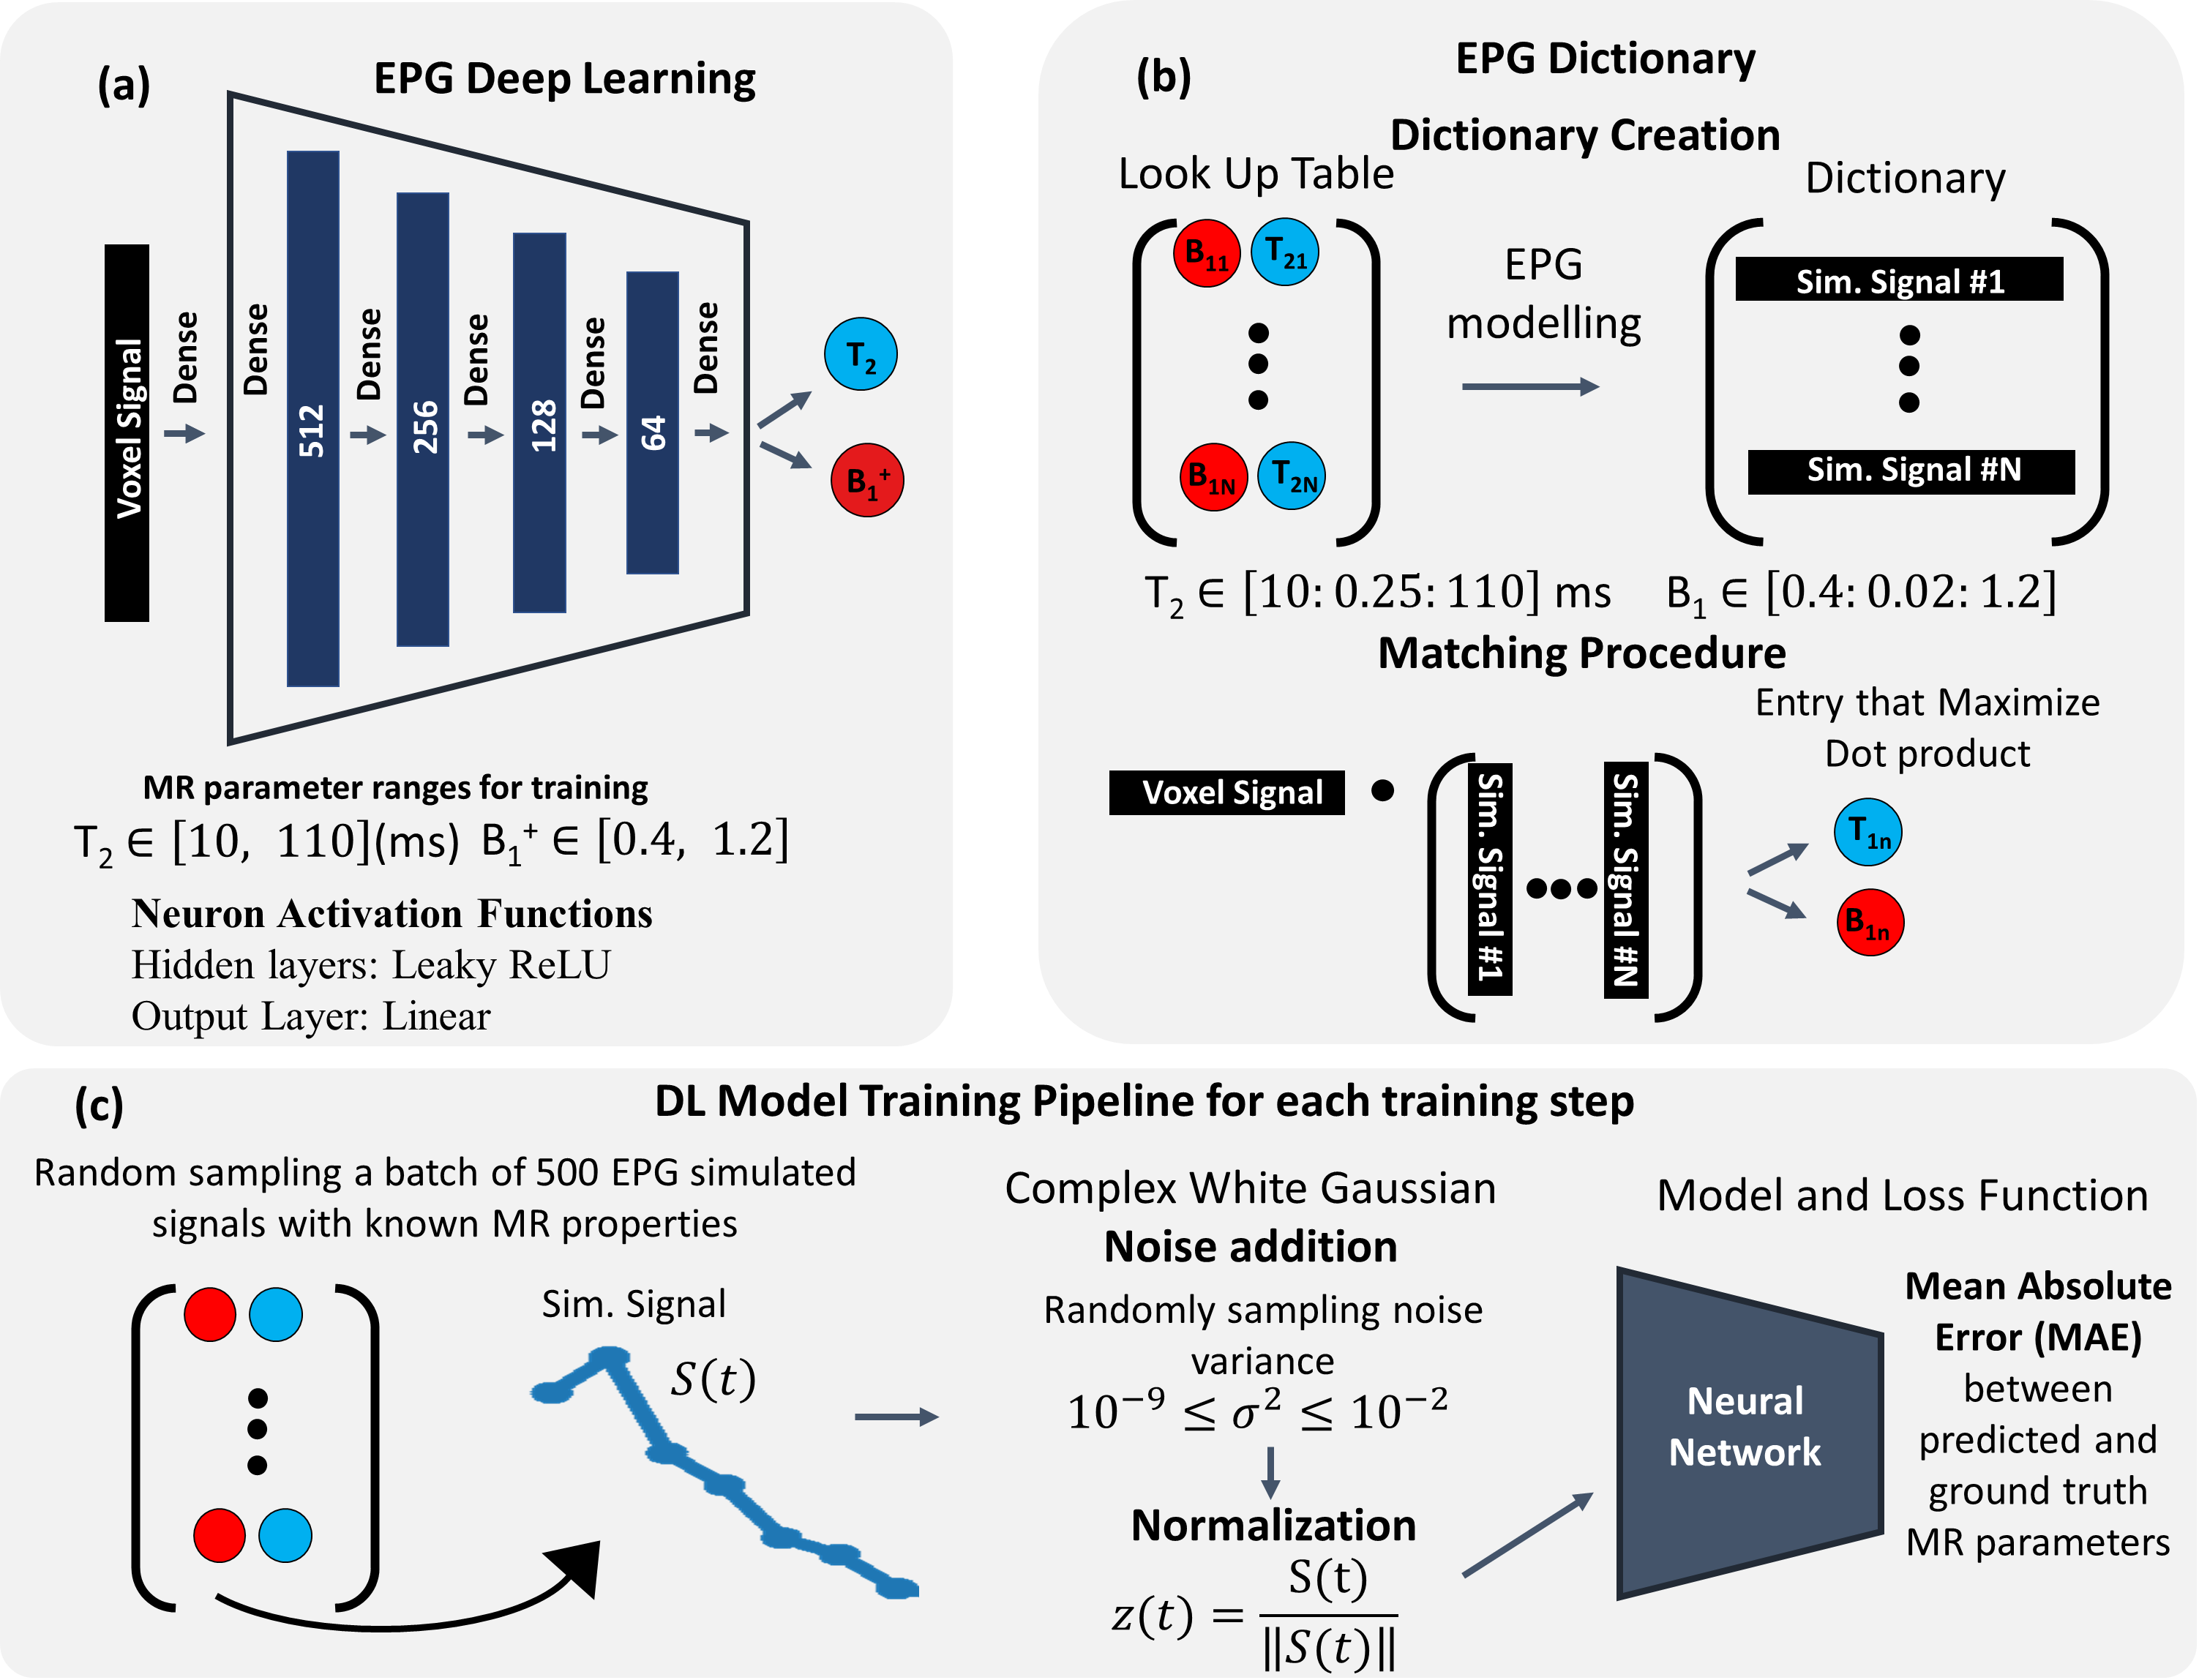
MESE simulations were performed in Matlab (R2022b) using the EPG formalism. Hanning-windowed Sinc pulses were used for slice-profile simulations. Three EPG-based fitting methods and three exponential (EXP)-based methods used in prior OAI literature were considered and are summarized in Figure 1 and Figure 2.2000 MESE signals were simulated with T2 ranging from 20 to 80 ms and B1 ranging from 0.9 to 1.1. Each method was used to fit T2 values after adding increasing levels of Gaussian noise. For each SNR, the procedure was repeated 10 times with re-sampling of noise. Accuracy was assessed using mean percentage error (MPE) and mean absolute percentage error (MAPE), while repeatability was assessed with coefficient of variation (CV).
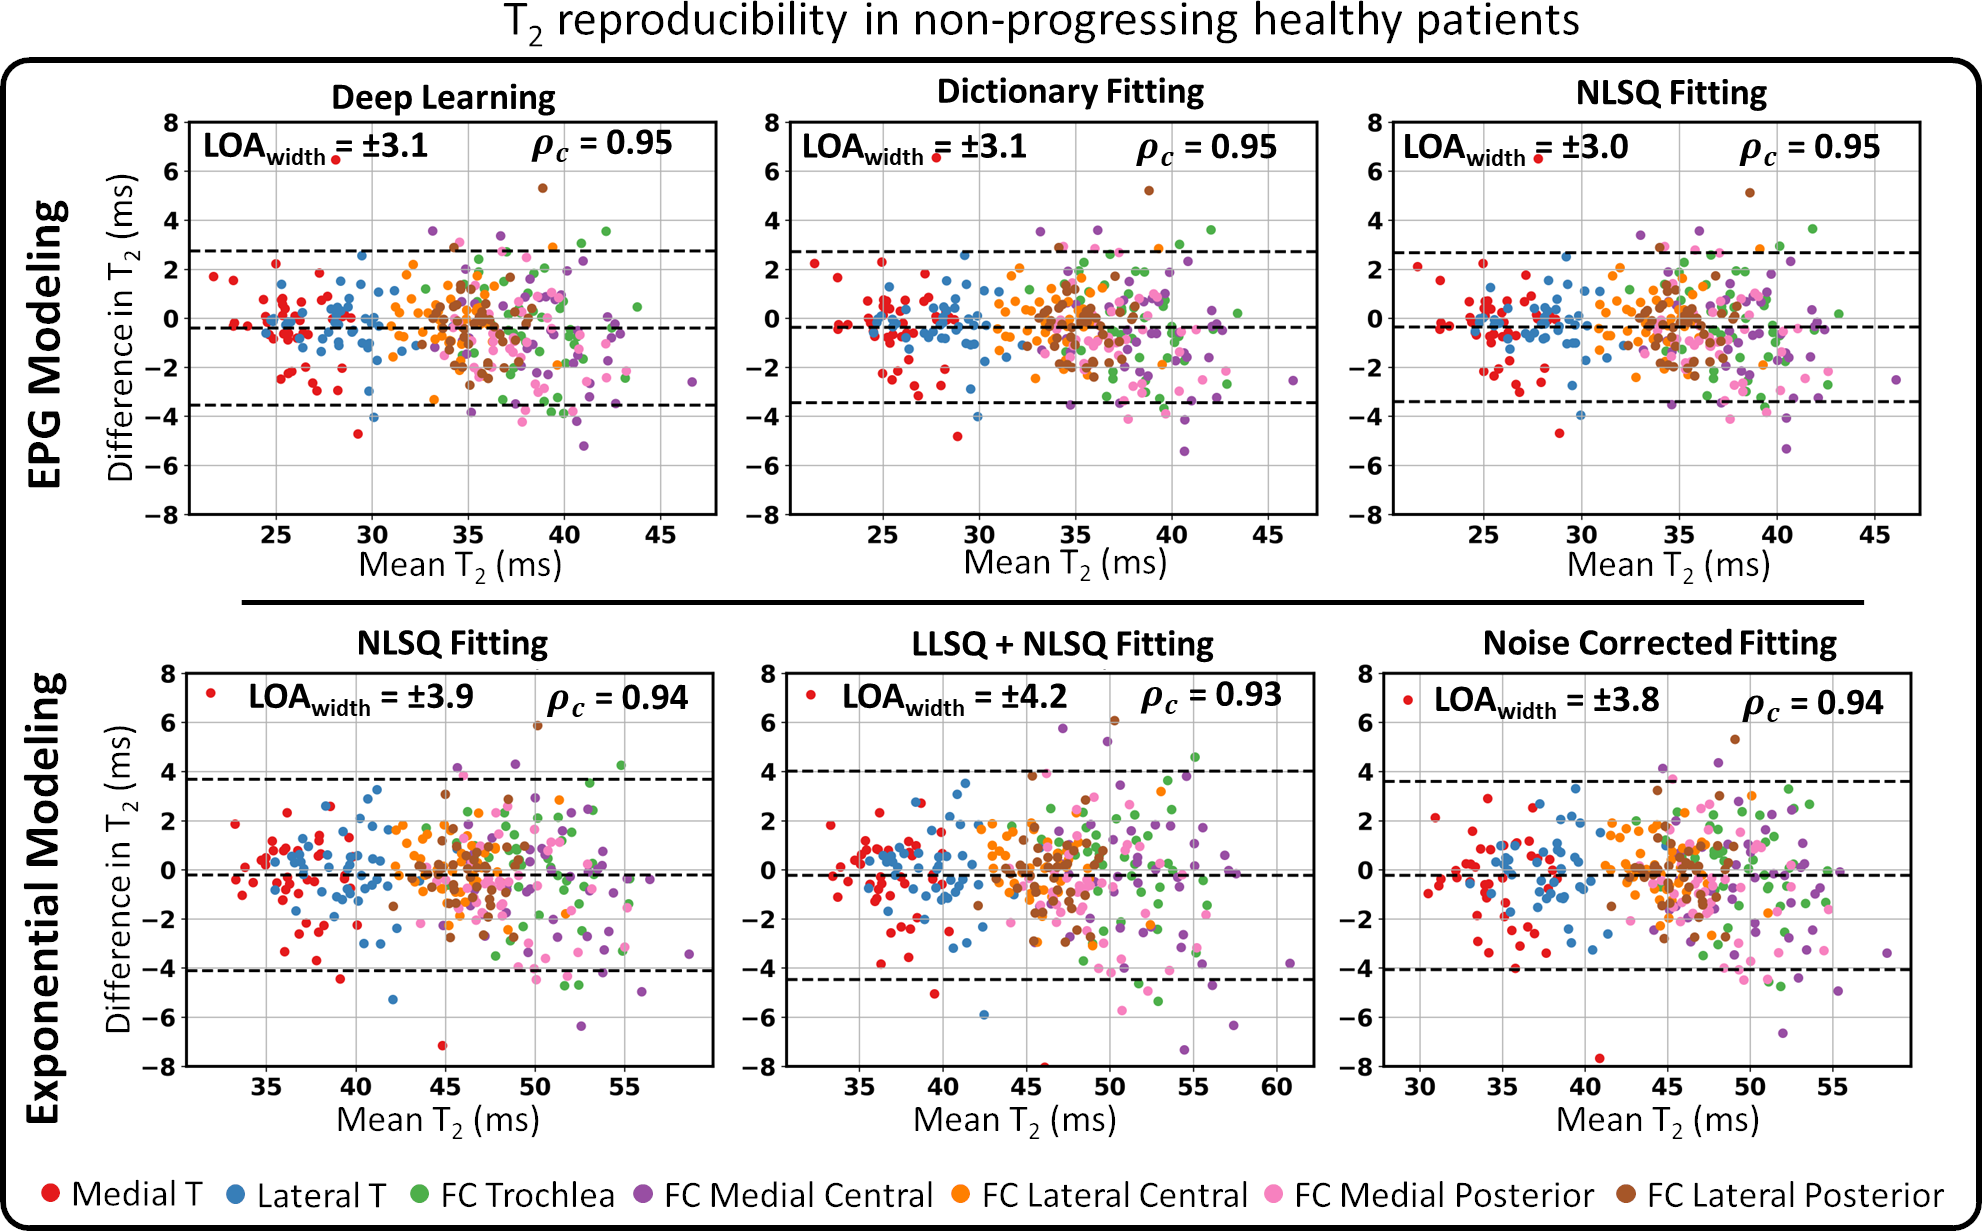
To assess agreement among fitting methods, 50 subjects were randomly selected from the OAI dataset: 10 subjects (5F & 5M) per OA Severity grade [KLG 0/1/2/3/4]. Patellar (P) and Tibiofemoral (TF) cartilage T2 maps were computed pixel-wise with all the described fitting methods. Mean T2 was computed in 7 ROIs (P, MT, LT, central and posterior regions for the MF and LF), automatically segmented on DESS images, and applied to registered MESE images. BA analysis was used to assess pair-wise agreement in mean T2 values using Limits of Agreement (LOA) and mean bias. Lin’s concordance coefficient (ρc) and CV were also used as metrics of agreement. To assess repeatability and reproducibility in the OAI, MESE data from 5 subjects in the OAI database (1 in each KLG) were corrupted by injecting Gaussian noise into the MESE images twice with increasing variance. Method repeatability was assessed through Bland-Altman (BA) analysis. Baseline and 12 monthly follow-up data of 50 healthy subjects (KLG = 0) that did experience OA onset throughout the entire duration of the study were randomly selected to assess method reproducibility in mean TF cartilage T2 values using BA analysis.
Results
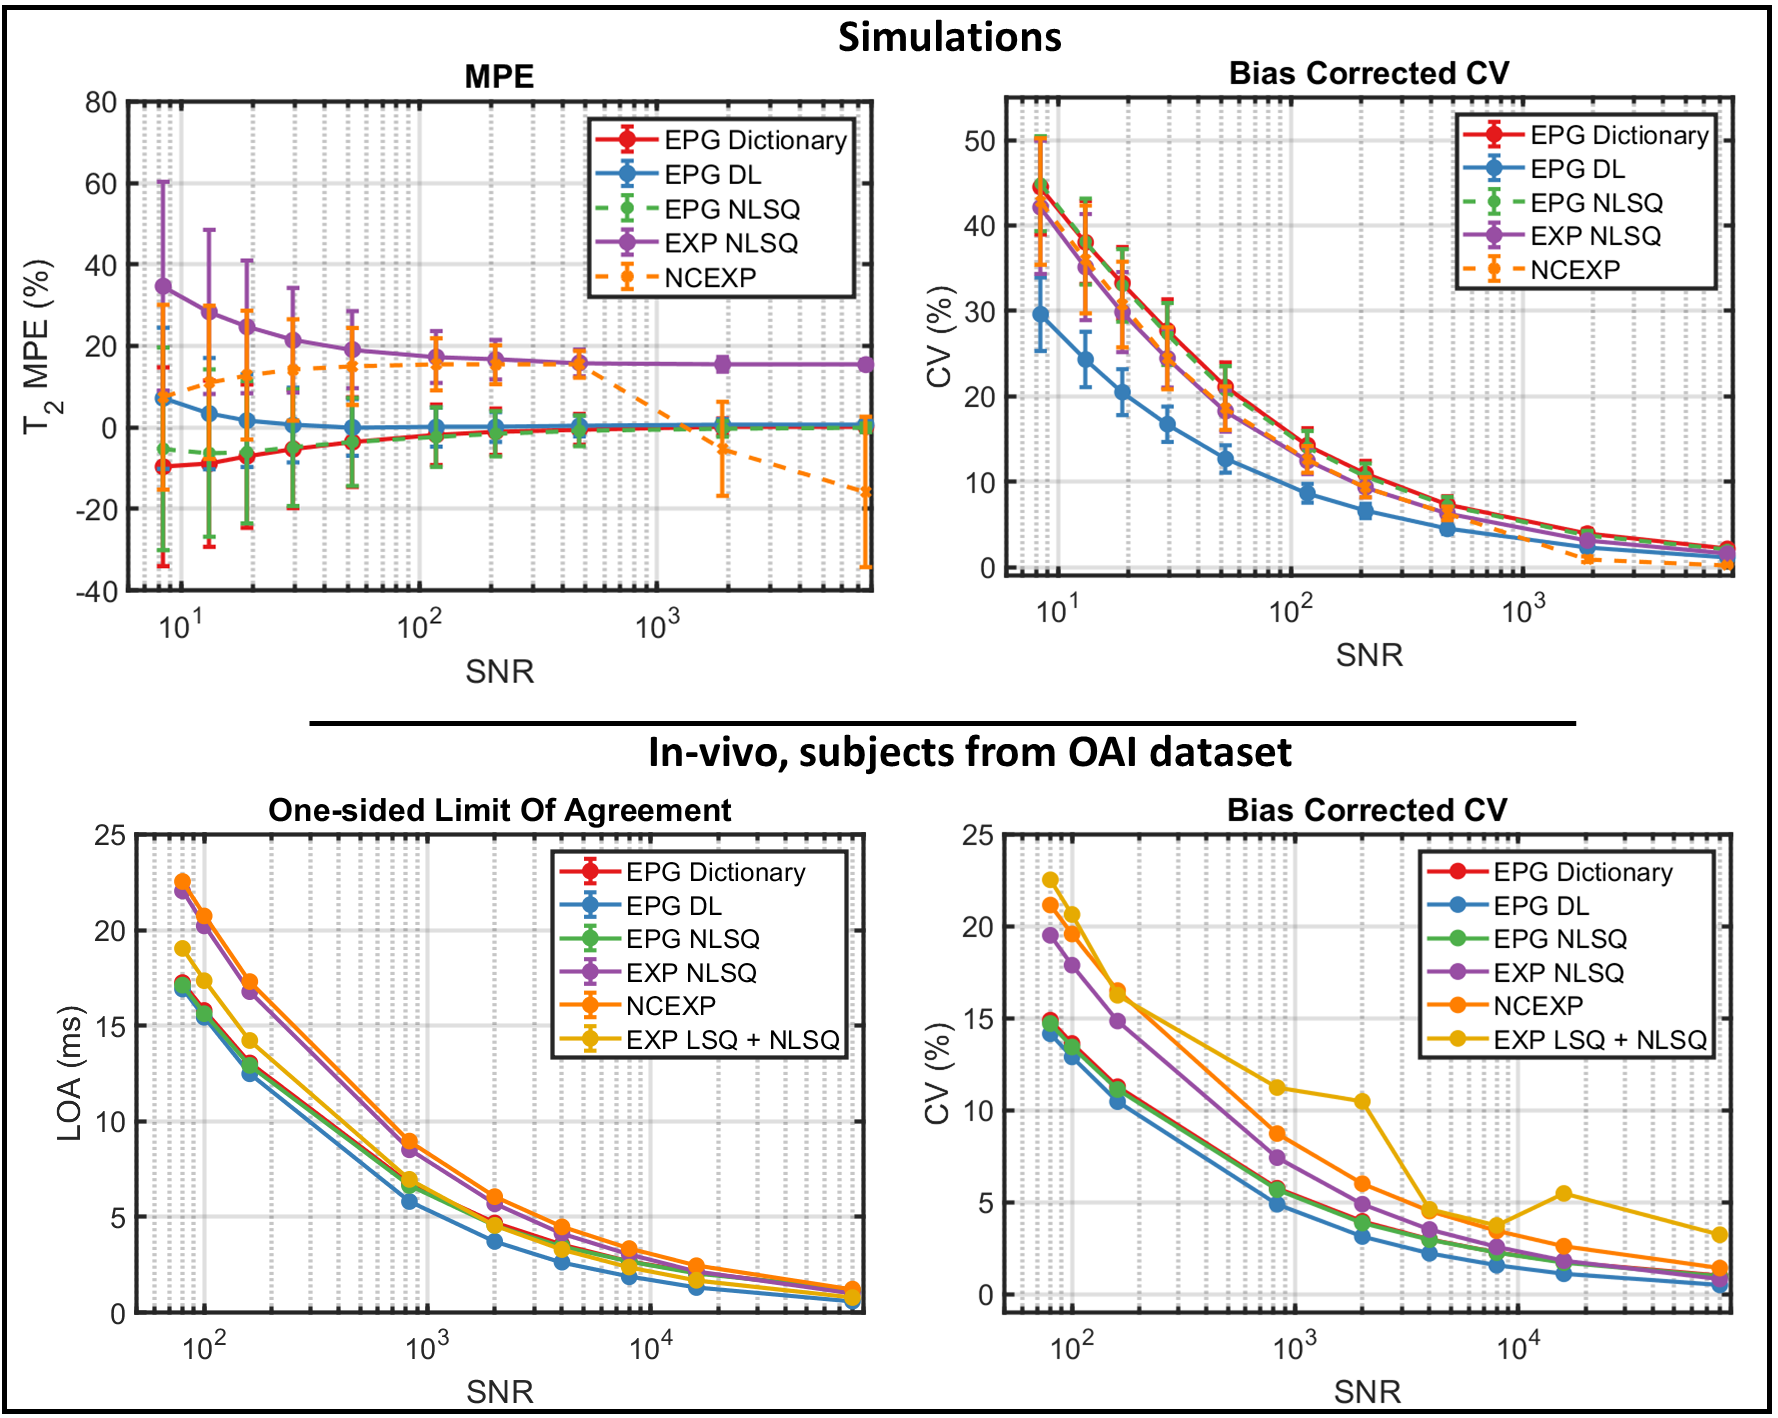
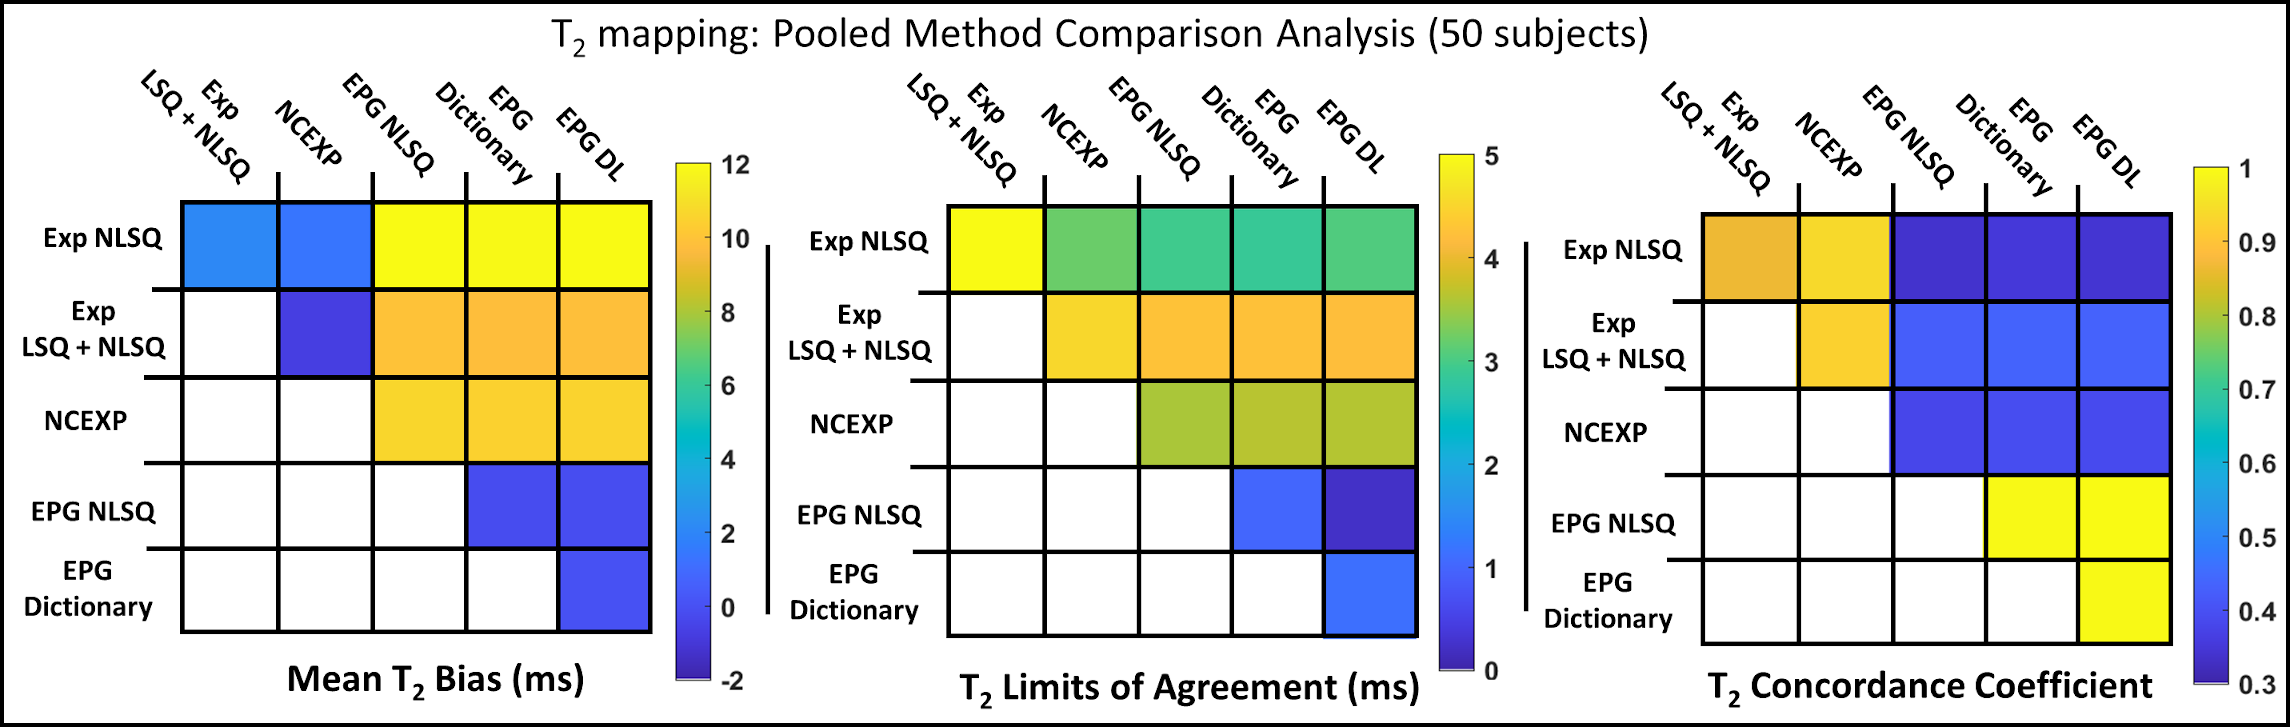
MPE, and CV for different fitting methods from the simulation experiment are reported in Fig. 2 (top panel) as a function of SNR. The EPG methods outperformed the exponential-based methods in terms of accuracy at all SNR levels. The EPG DL approach had the best overall performance in terms of accuracy and repeatability. In-vivo analysis of LOA and CV as a function of SNR (Fig. 2, bottom panel) showed that the EPG-based methods had higher repeatability than EXP-based procedures. T2 pair-wise method comparison in-vivo (Fig. 3) showed that EPG-based methods had a higher inter-method agreement (- 0.1ms<Bias<0.05ms, 0.2<LOA<1.13ms, ρc~0.99) compared to EXP-based methods (-0.7ms< Bias<2 ms, 3.2ms<LOA<5.3ms, 0.86<ρc<0.94). Poor agreement was found between EPG-based and exponential-based methods (0.34<ρc< 0.44, Bias~10ms and LOA~4ms). The EPG-based methods also showed higher reproducibility in a population of healthy non-progressing patients (Fig. 3): LOAs width of EPG-based methods (3.0ms≤ LOAwidth≤3.1ms) were about 1ms lower than those of EXP-based methods (3.8ms≤ LOAwidth≤4.2 ms).Discussion and Conclusion
EPG-based fitting methods resulted in more accurate and repeatable T2 estimation than EXP-based approaches in simulations and in-vivo experiments. Particularly, EPG T2 LOAs were 1 ms lower than those observed using conventional approaches, which can positively impact longitudinal studies as the observed mean change in T2 associated with knee OA is in the order of 2 ms8,9. Exploiting the computational efficiency of DL- and Dictionary-based EPG procedures, we plan to compute T2 maps of the entire OAI dataset and make it publicly available.Acknowledgements
NIH (R01AR079431, R21EB030180, R01AR077604, R01EB002524), Wu Tsai Human Performance Alliance, CIHR Postdoctoral FellowshipReferences
1. Branch NSC and O. National Institute of Arthritis and Musculoskeletal and Skin Diseases. NIAMS; 2017 [cited 2023 Nov 8]. Osteoarthritis Initiative. Available from: https://www.niams.nih.gov/grants-funding/funded-research/osteoarthritis-initiative
2. Zhong H, Miller DJ, Urish KL. T2 Map Signal Variation Predicts Symptomatic Osteoarthritis Progression: Data from the Osteoarthritis Initiative. Skeletal Radiol. 2016 Jul;45(7):909–13.
3. Pedoia V, Lee J, Norman B, Link TM, Majumdar S. Diagnosing osteoarthritis from T2 maps using deep learning: an analysis of the entire Osteoarthritis Initiative baseline cohort. Osteoarthritis Cartilage. 2019 Jul 1;27(7):1002–10.
4. Fuerst D, Wirth W, Gaisberger M, Hunter DJ, Eckstein F. Association of Superficial Cartilage Transverse Relaxation Time With Osteoarthritis Disease Progression: Data From the Foundation for the National Institutes of Health Biomarker Study of the Osteoarthritis Initiative. Arthritis Care Res. 2022;74(11):1888–93.
5. Weigel M. Extended phase graphs: Dephasing, RF pulses, and echoes - Pure and simple. J Magn Reson Imaging. 2015;41(2).
6. Prasloski T, Mädler B, Xiang QS, MacKay A, Jones C. Applications of stimulated echo correction to multicomponent T2 analysis. Magn Reson Med. 2012;67(6):1803–14.
7. Marty B, Baudin PY, Reyngoudt H, Azzabou N, Araujo ECA, Carlier PG, et al. Simultaneous muscle water T2 and fat fraction mapping using transverse relaxometry with stimulated echo compensation. NMR Biomed. 2016 Apr 1;29(4):431–43.
8. Pan J, Pialat JB, Joseph T, Kuo D, Joseph GB, Nevitt MC, et al. Knee cartilage T2 characteristics and evolution in relation to morphologic abnormalities detected at 3-T MR imaging: A longitudinal study of the normal control cohort from the osteoarthritis initiative. Radiology. 2011 Nov;261(2):507–15.
9. Kretzschmar M, Heilmeier U, Yu A, Joseph GB, Liu F, Solka M, et al. Longitudinal analysis of cartilage T2 relaxation times and joint degeneration in African American and Caucasian American women over an observation period of 6 years- Data from the Osteoarthritis Initiative. Osteoarthr Cartil OARS Osteoarthr Res Soc. 2016 Aug 1;24(8):1384.
10. Barbieri M, Lee PK, Brizi L, Giampieri E, Solera F, Castellani G, et al. Circumventing the curse of dimensionality in magnetic resonance fingerprinting through a deep learning approach. NMR Biomed. 2022 Apr 1;35(4).
Figures