0482
Whole brain mapping of NAD at 7T using a 31P 32-channel array coil1CIBM Center for Biomedical Imaging (CIBM), Ecublens, Switzerland, 2Animal Imaging and Technology, Ecole Polytechnique Fédérale de Lausanne (EPFL), Ecublens, Switzerland, 3School of Health Sciences, College of Health and Human Sciences, Purdue University, West Lafayette, IN, United States
Synopsis
Keywords: Spectroscopy, Spectroscopy, 31P MRSI, NAD+, NADH
Motivation: Nicotinamide adenine dinucleotide (NAD) is vital in cellular metabolism, existing in an oxidized (NAD+) and reduced (NADH) form. Its submillimolar concentration in the human brain makes its whole brain mapping challenging.
Goal(s): To explore the feasibility of whole-brain NAD mapping in human.
Approach: 31P MRSI data were acquired from two volunteers using a 31P 32-channel array coil at 7T. Metabolites were quantified with LCModel.
Results: 3D whole-brain NAD maps were acquired with decent SNR within 45min. The measured NAD level and NAD+/NADH ratio were stable across two subjects and aligned with previous single-voxel studies.
Impact: Our preliminary data demonstrated the feasibility of whole-brain NAD mapping in humans at 7T, which offers the potential to study regional-specific bioenergetics under different pathological conditions.
Introduction
Nicotinamide adenine dinucleotide (NAD) is a cofactor involved in glycolysis and the tricarboxylic acid cycle, playing an important role in brain bioenergetics1. Besides, it is a key substrate for various enzymes involved in critical processes such as genomic stability and mitochondrial homeostasisl2. It manifests in an oxidized state (NAD+) and a reduced state (NADH), with the redox ratio (NAD+/NADH) being crucial for maintaining metabolic balance3. However, due to its submillimolar concentration in the human brain, quantifying NAD levels proves to be challenging. Recent advancements in 31P-MRS at high magnetic field strengths have now made it feasible to measure NAD levels within a single large voxel4. When it comes to multi-voxel measurements, limited studies have been reported5–7, where only total NAD maps were reported with intricate denoising methods. In this study, we explored the feasibility of mapping NAD+ and NADH in the human brain with 31P FID MRSI using a 32-channel 31P array coil at 7T.Methods
Two volunteers participated in this study and provided informed consent in accordance with the Swiss cantonal ethics committee. In vivo 31P FID MRSI data were acquired at a 7T/68cm MR scanner (Siemens Medical Solutions, Erlangen, Germany). A 31P/1H phased-array head coil with 32 31P receiver elements (Rapid Biomedical, Rimpar, Germany) was used. A 3D FID CSI sequence (matrix size = 12x12x8, TR = 260ms, flip angle = 33°, bandwidth = 6000Hz, vector size = 1024, 160 averages) with Hamming-weighted k-space sampling was acquired. A field of view of 200x200x80 mm3 with TE = 2.3ms and a rotated field of view of 200x200x100mm3 covering the whole brain with TE = 1.7ms were implemented for subject 1 and 2, respectively. The total acquisition took 45:22min, including the acquisition of a noise image for coil combination. 3D T1-weighted 1H anatomical images were acquired using a GRE sequence (TR =6.5ms, TE = 2.82ms, α =4° , 1mm3 isotropic resolution ) and an MP2RAGE sequence (TE/TR =1.54/5500ms, TI1/TI2 = 750/2350ms, α1/ α2 = 4°/5°,3.8mm3 isotropic resolution) for subject 1 and 2, respectively. The datasets were processed using customized scripts in Matlab. First, the multi-channel 31P MRSI data were combined with the whitened SVD algorithm8. Then, first order phase correction (determined from the TE) and a 5-Hz exponential filter were applied to the averaged data Multi-voxel 31P MR spectra were analyzed by LCModel for metabolite quantification using g-ATP as an internal reference. To minimize the effect of B1 inhomogeneity on NAD quantification, a-ATP (3mM) was used as the internal reference for NAD quantification. T1 saturation effect was corrected based on the metabolite T1 relaxation time8. The brain masks were generated using Freesurfer, and the metabolite maps were generated within the masks. Voxels with CRLB values larger than 50% for NAD+ and 100% for NADH or 20% for other metabolites were excluded from the corresponding maps.Results
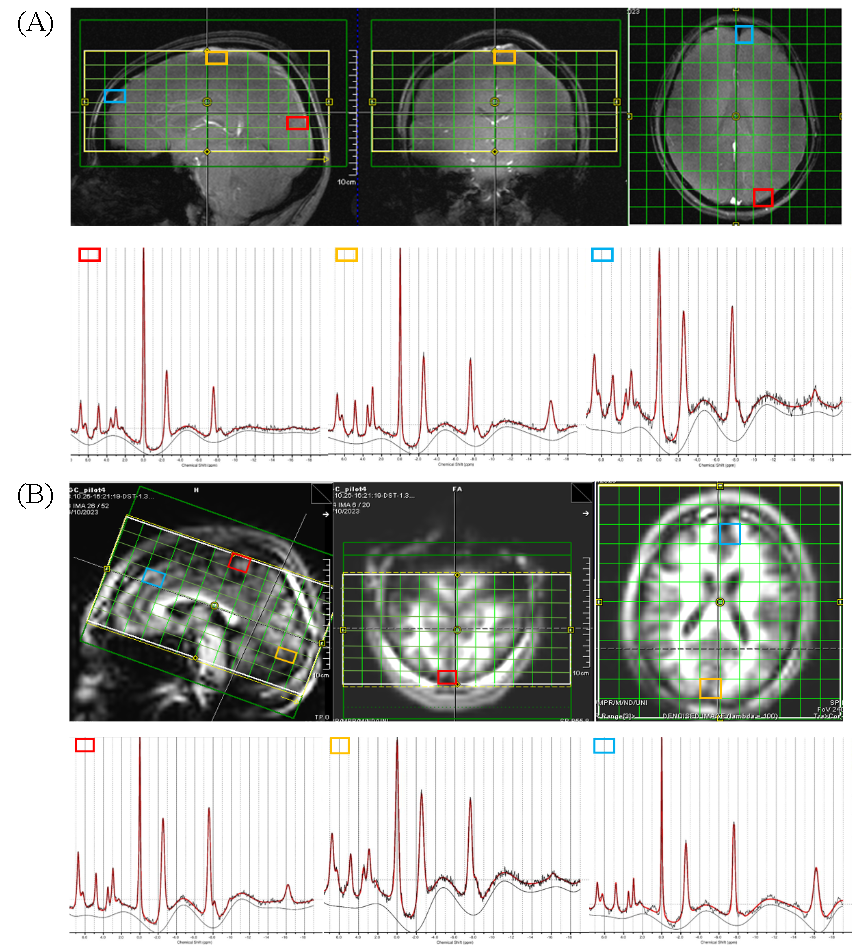
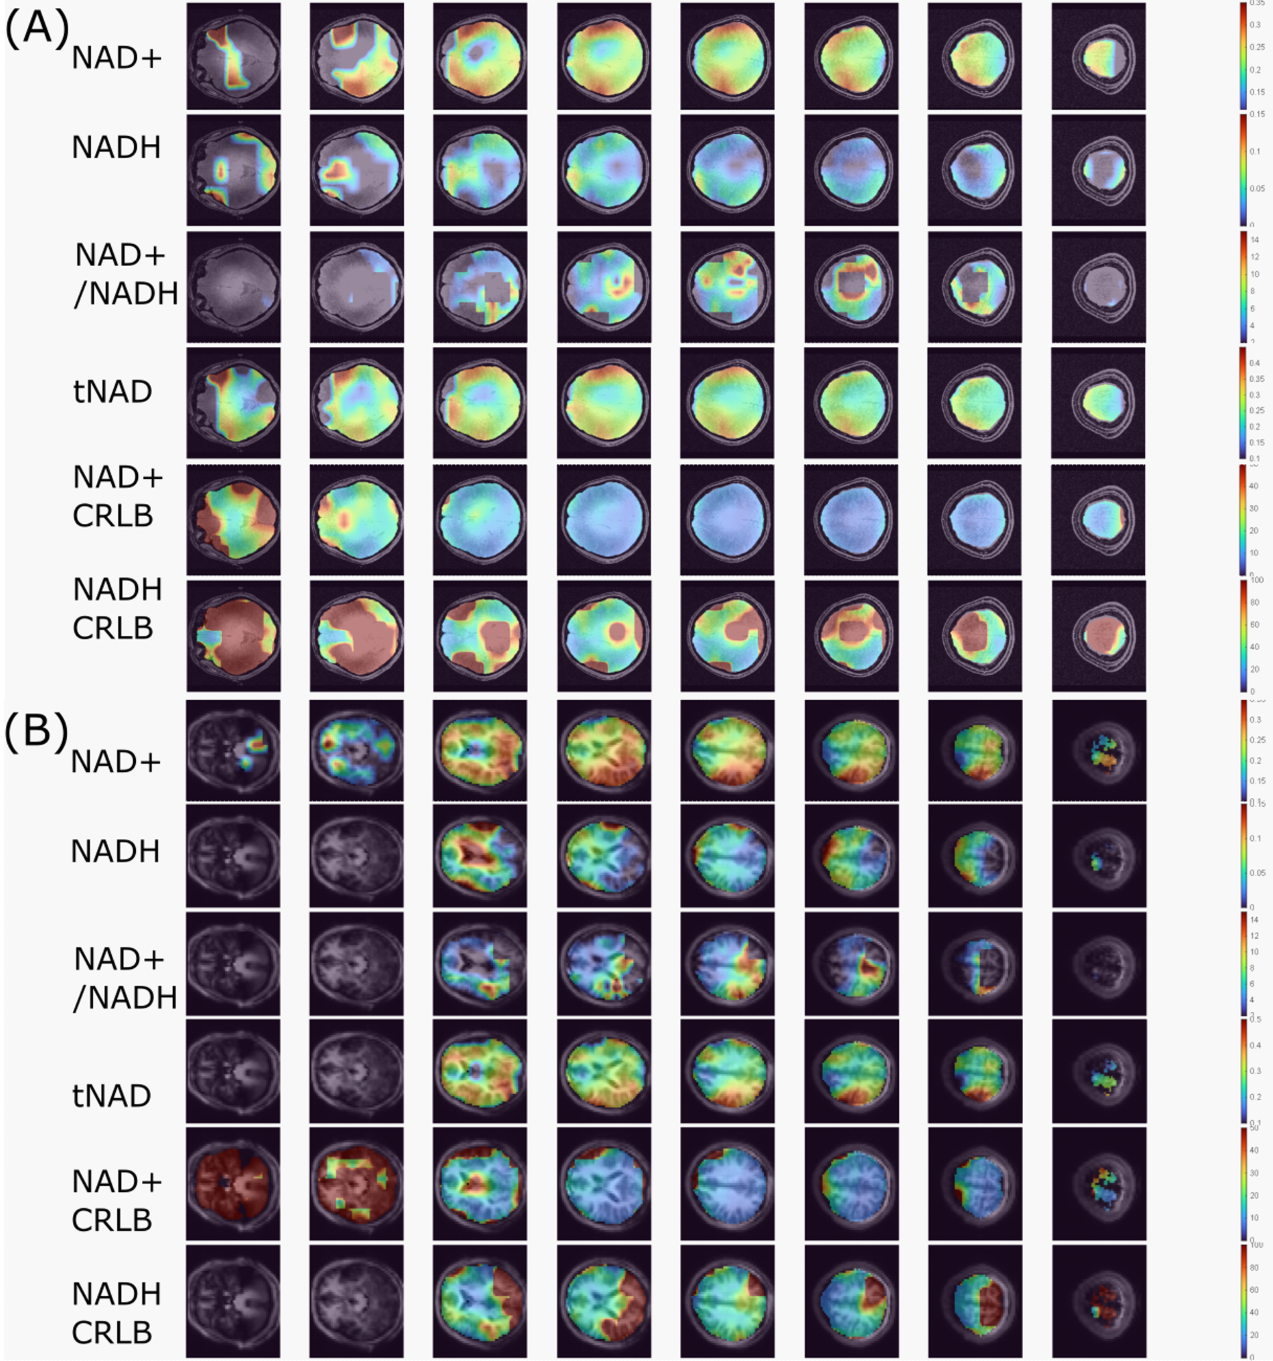
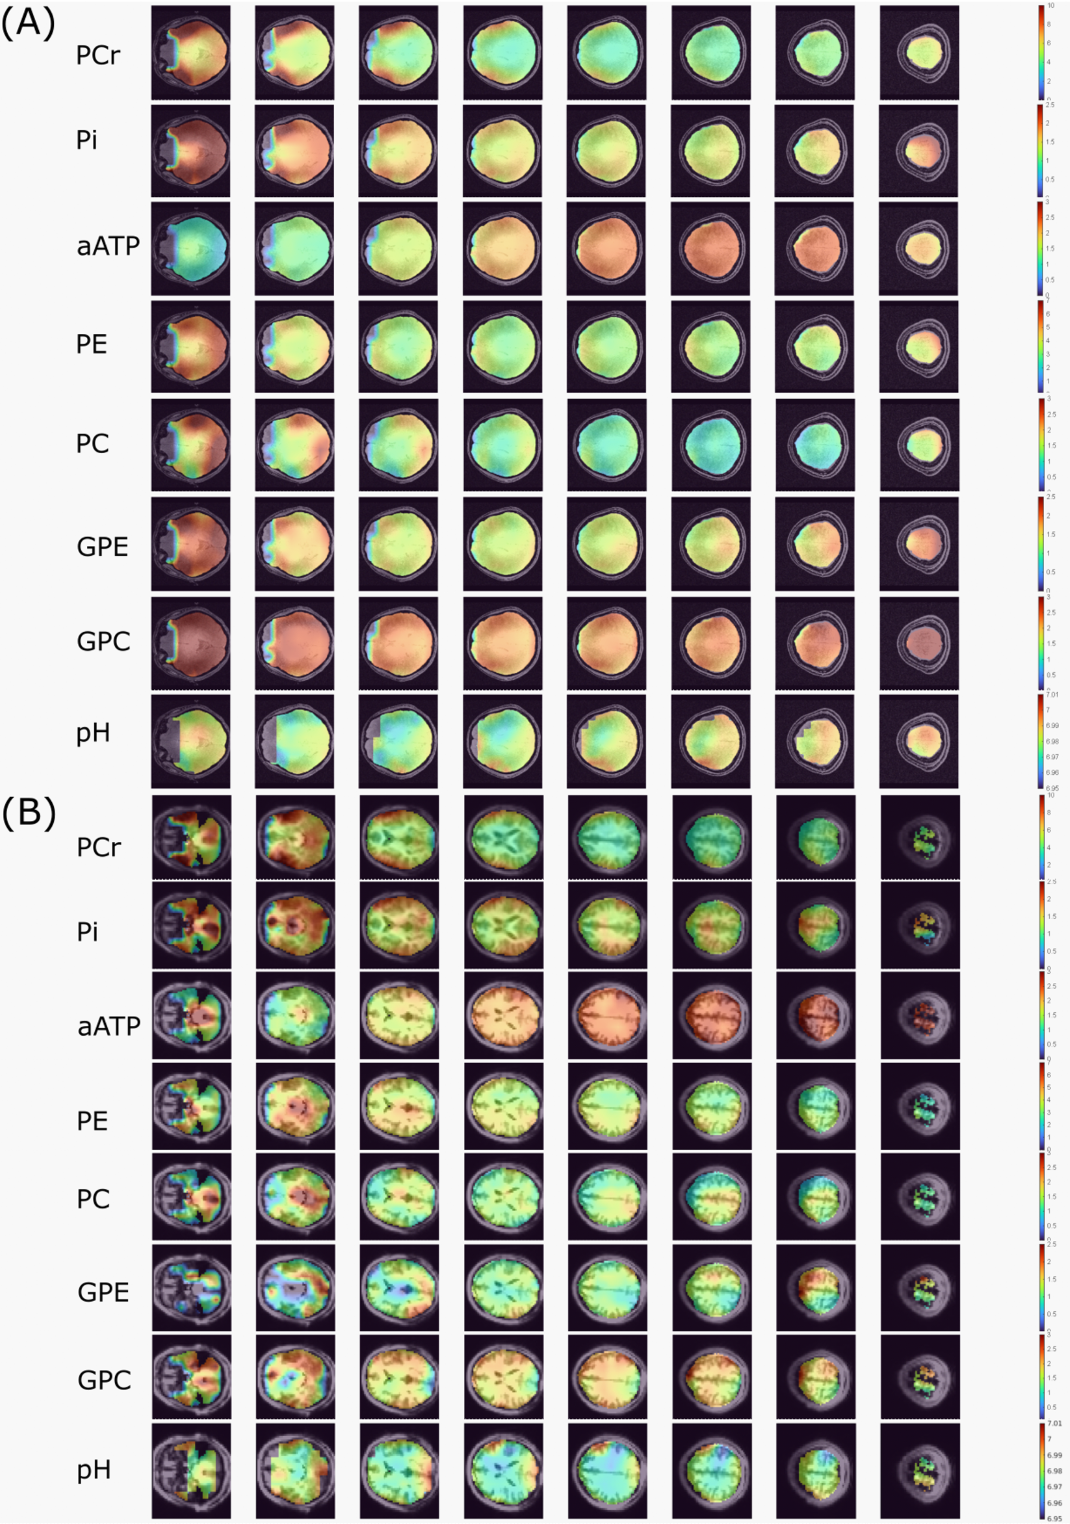
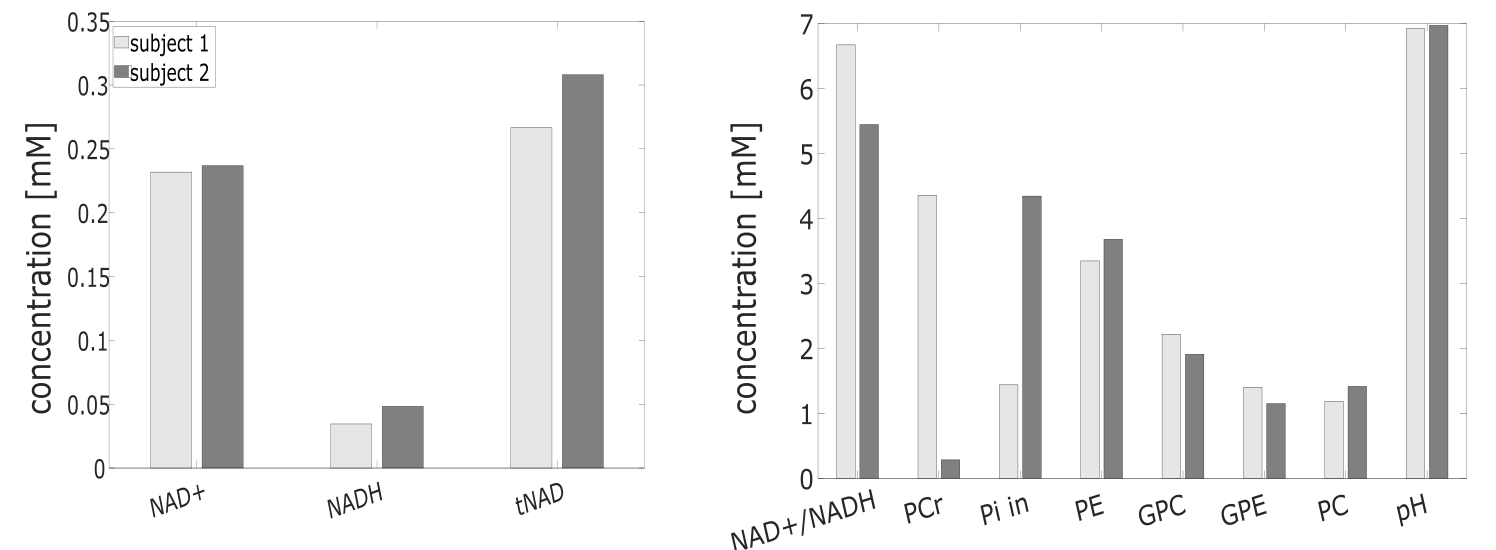
Figure 1 presents the field of view and exemplary spectra with LCModel fits. The spectral SNR (LCModel output) within the brain were 72.2±36.9 and 57.2±27.8, for subject 1 and 2. Figure 2 and 3 show the 31P metabolites and pH maps. All presented metabolites, except for NADH, exhibited an mean CRLB below 20%, with that of PCr being less than 5%, and NAD+ being 19%. The mean metabolite concentrations were shown in figure 4.Discussion
With the sensitivity enhancement from the 32 channel 31P array coil, we were able to obtain 3D 31P MRSI data covering the entire human brain within 45 minutes and report 31P metabolic maps including NAD content. The SNRs of multivoxel 31P spectra with the current spatial resolution were comparable to previous single-loop coil localized 31P spectra (mean SNR of 87+/-21)9. The mean concentration and pH levels exhibited stability across the two subjects. The mean values of NAD+, NADH, redox ratio, and total NAD (tNAD) were in line with previously reported values from single voxel experiments5,9. The levels of NAD+ appear to be higher in grey matter dominated regions similar as that reported at 9.4T5. Other 31P metabolites also showed consistent concentrations and demonstrated coherent spatial distribution patterns in gray and white matter, in line with previous studies5.Conclusion
In conclusion, our preliminary data demonstrated the feasibility of whole-brain NAD mapping at 7T using a 31P 32-channel array coil, which offers the potential for investigating regional NAD related bioenergetic dysfunction in neuropsychiatric disorders. This work will be extended with the inclusion of compressed sensing, denoising methods, as well as B0 and B1 field correction to further shorten the acquisition time and to facilitate clinical applications.Acknowledgements
This work was supported by the Swiss National Science Foundation (grants n° 320030_189064). We acknowledge the CIBM Center for Biomedical Imaging for providing expertise and resources to conduct this study.References
1. Lautrup S, Sinclair DA, Mattson MP, Fang EF. NAD+ in Brain Aging and Neurodegenerative Disorders. Cell Metabolism. 2019;30(4):630-655. doi:10.1016/j.cmet.2019.09.001
2. Katsyuba E, Romani M, Hofer D, Auwerx J. NAD+ homeostasis in health and disease. Nat Metab. 2020;2(1):9-31. doi:10.1038/s42255-019-0161-5
3. Dienel GA. Brain Glucose Metabolism: Integration of Energetics with Function. Physiological Reviews. 2019;99(1):949-1045. doi:10.1152/physrev.00062.2017
4. Zhu XH, Lu M, Lee BY, Ugurbil K, Chen W. In vivo NAD assay reveals the intracellular NAD contents and redox state in healthy human brain and their age dependences. Proc Natl Acad Sci U S A. 2015;112(9):2876-2881. doi:10.1073/pnas.1417921112
5. Ruhm L, Dorst J, Avdievitch N, Wright AM, Henning A. 3D 31P MRSI of the human brain at 9.4 Tesla: Optimization and quantitative analysis of metabolic images. Magnetic Resonance in Medicine. 2021;86(5):2368-2383. doi:10.1002/mrm.28891
6. Korzowski A, Weckesser N, Franke VL, et al. Mapping an Extended Metabolic Profile of Gliomas Using High-Resolution 31P MRSI at 7T. Front Neurol. 2021;12:735071. doi:10.3389/fneur.2021.735071
7. Zhu XH, Rong Guo, et al. Feasibility of Mapping Intracellular NAD Content in Entire Human Brain at 7T. Proceedings of the 31ST Annual Meeting of ISMRM, Toronto, Canada, 2023. Abstract 3291.
8. Rodgers CT, Robson MD. Receive array magnetic resonance spectroscopy: Whitened singular value decomposition (WSVD) gives optimal Bayesian solution. Magnetic Resonance in Medicine. 2010;63(4):881-891. doi:10.1002/mrm.22230
9. Cuenoud, B., Huang, Z., Hartweg, M., Widmaier, M., Lim, S., Wenz, D., & Xin, L. Effect of Circadian Rhythm on NAD and Other Metabolites in Human Brain. Frontiers in Physiology, 2023; 14, 1285776. doi: 10.3389/fphys.2023.1285776
Figures