0480
SAR safety procedure for self-built pTx human head RF array coils at 9.4T1Magnetic Resonance Center, Max Planck Institute for Biological Cybernetics, Tübingen, Germany, 2Department for Biomedical Magnetic Resonance, University of Tübingen, Tübingen, Germany
Synopsis
Keywords: Safety, High-Field MRI, SAR, EM simulation
Motivation: Ensuring subject safety, in particular to limit tissue heating, is a critical aspect of self-developed pTx RF array coils for UHF applications.
Goal(s): Establishing a dependable workflow for accurate simulation, data processing and realization of online supervision of power deposition.
Approach: The workflow relies on cross-comparisons of EM simulation results and intermediate processing steps based on representative excitation modes, and on comparison of measured and simulated field maps.
Results: Consistency was achieved in all cross-comparison steps. Residual discrepancies between measured and simulated B1+ maps require further investigation, but their safety implications can be addressed by an appropriate safety factor.
Impact: A reliable workflow for EM simulation, subsequent data processing, and realization of online SAR monitoring for home-built RF human head array coils at 9.4T is presented. This is an essential building block to ensure subject safety in experimental UHF studies.
Introduction
Parallel transmission1,2 (pTx) is a central tool in ultra-high field MRI to address the inherent issues of B1+ inhomogeneity and increased power deposition (SAR). Research in this context often relies on self-built pTx coil arrays, especially at field strengths above 7T. For these, safe operation in humans, especially compliance with regulatory SAR limits3 must be ensured. To this end, various coil validation strategies have been proposed, e.g.4–7, usually based on extensive electromagnetic (EM) modelling. In the present work, our current workflow for SAR modelling of self-built RF coils at 9.4T is presented, which focuses on faithful generation of Q8- and VOP9-matrices for online SAR monitoring.Methods
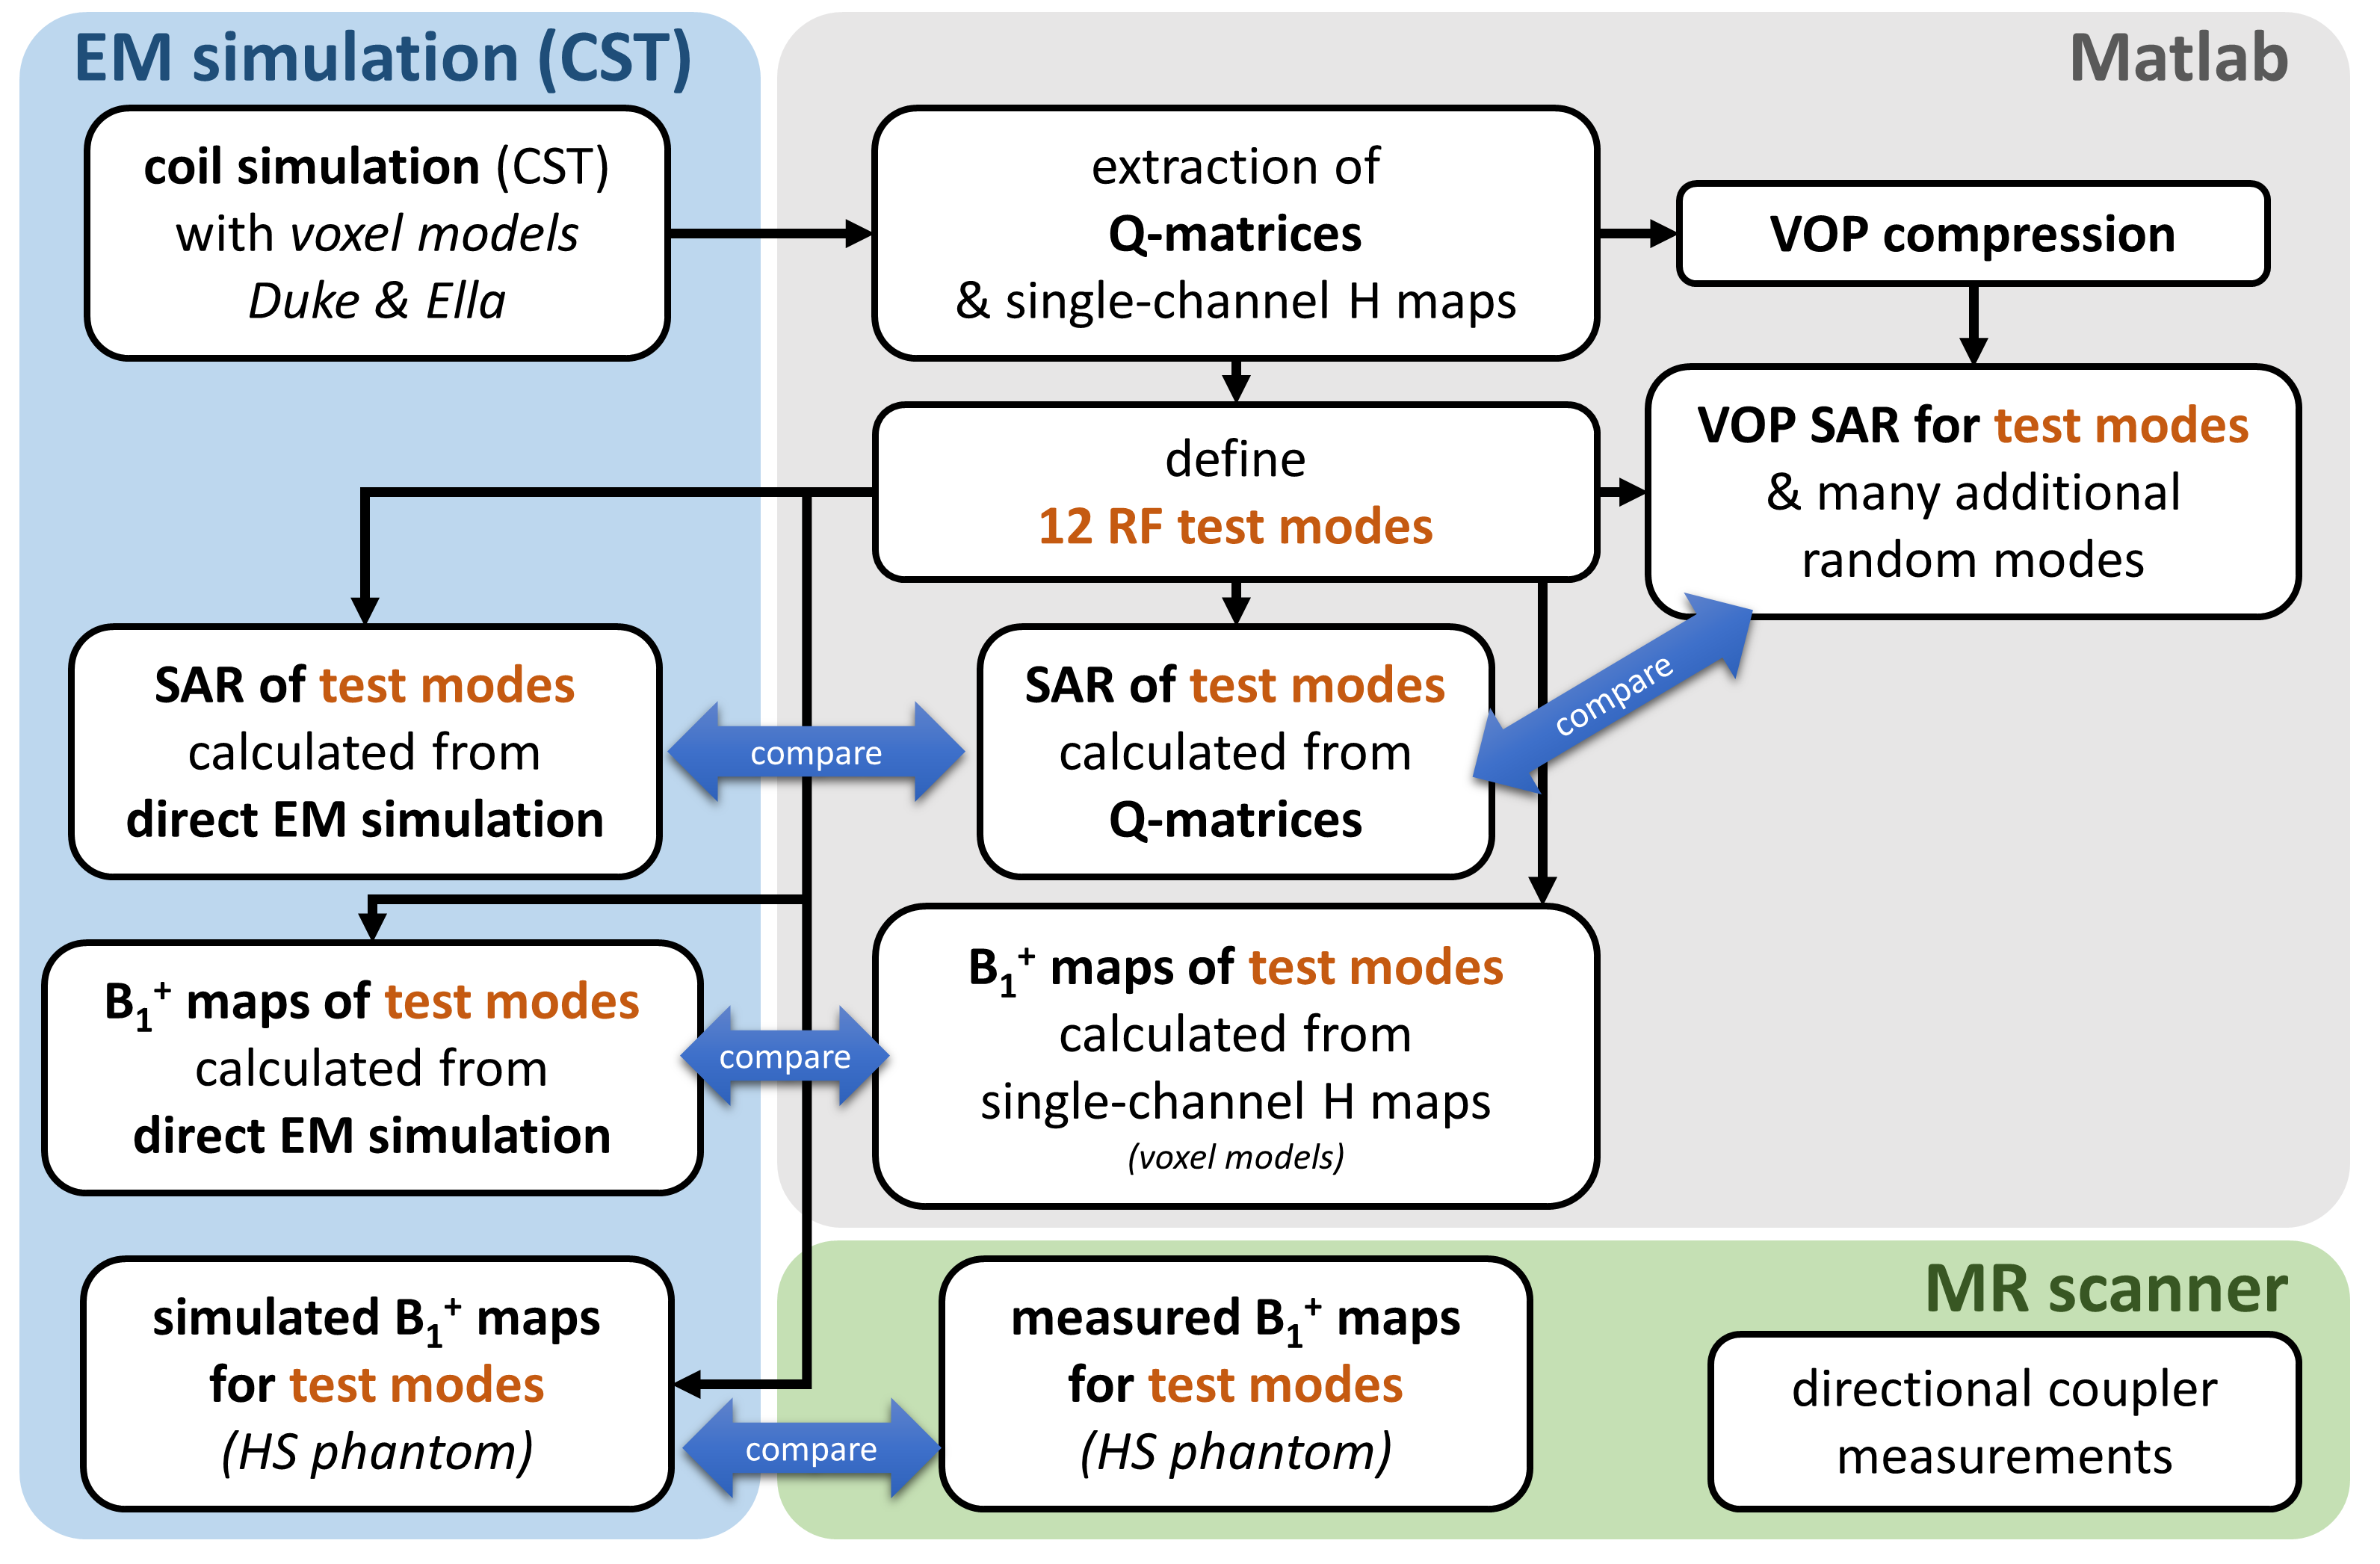
A flowchart of the workflow is shown in Figure 1. First, an EM simulation model of the RF coil under investigation is established in CST Studio Suite 2021 (Dassault Systèmes, Vélizy-Villacoublay, France). To generate Q-matrices, the approach described in 10 is applied based on two voxel models11 (Duke and Ella), which consists of simulating 10g-averaged (CST Legacy averaging method) SAR in CST for a certain set of RF excitation modes and inferring the Q-matrix entries in Matlab (MathWorks, Natick, MA, USA). A set of 12 RF test modes is defined for all further evaluations:1) no phase shift, equal amplitudes in all channels,
2) CP+ mode,
3) CP2+ mode,
4) worst-case SAR mode (obtained as the eigenvector to the largest eigenvalue of all Q-matrices12),
5) mode 4 but with inverted phase, and
6)-12) additional 7 random modes (magnitude and phase drawn from the uniform random distribution [0,1] and [-π,+π], respectively).
SAR10g maps for these modes are both simulated directly in CST and computed from the extracted Q-matrices, and the resulting maps are compared for both voxel models. Similarly, B1+ maps are generated in Matlab from single-channel H-field maps exported from CST, and compared to B1+ maps simulated by applying the modes directly in CST. VOP compression9,13 is performed with an additional safety factor SF=2.2 used to scale up the resulting VOP-matrices. The maximum local SAR10g for the RF test modes calculated from the Q-matrices and the VOP-matrices are compared. In addition, the same comparison is performed for 1000 additional random test modes.
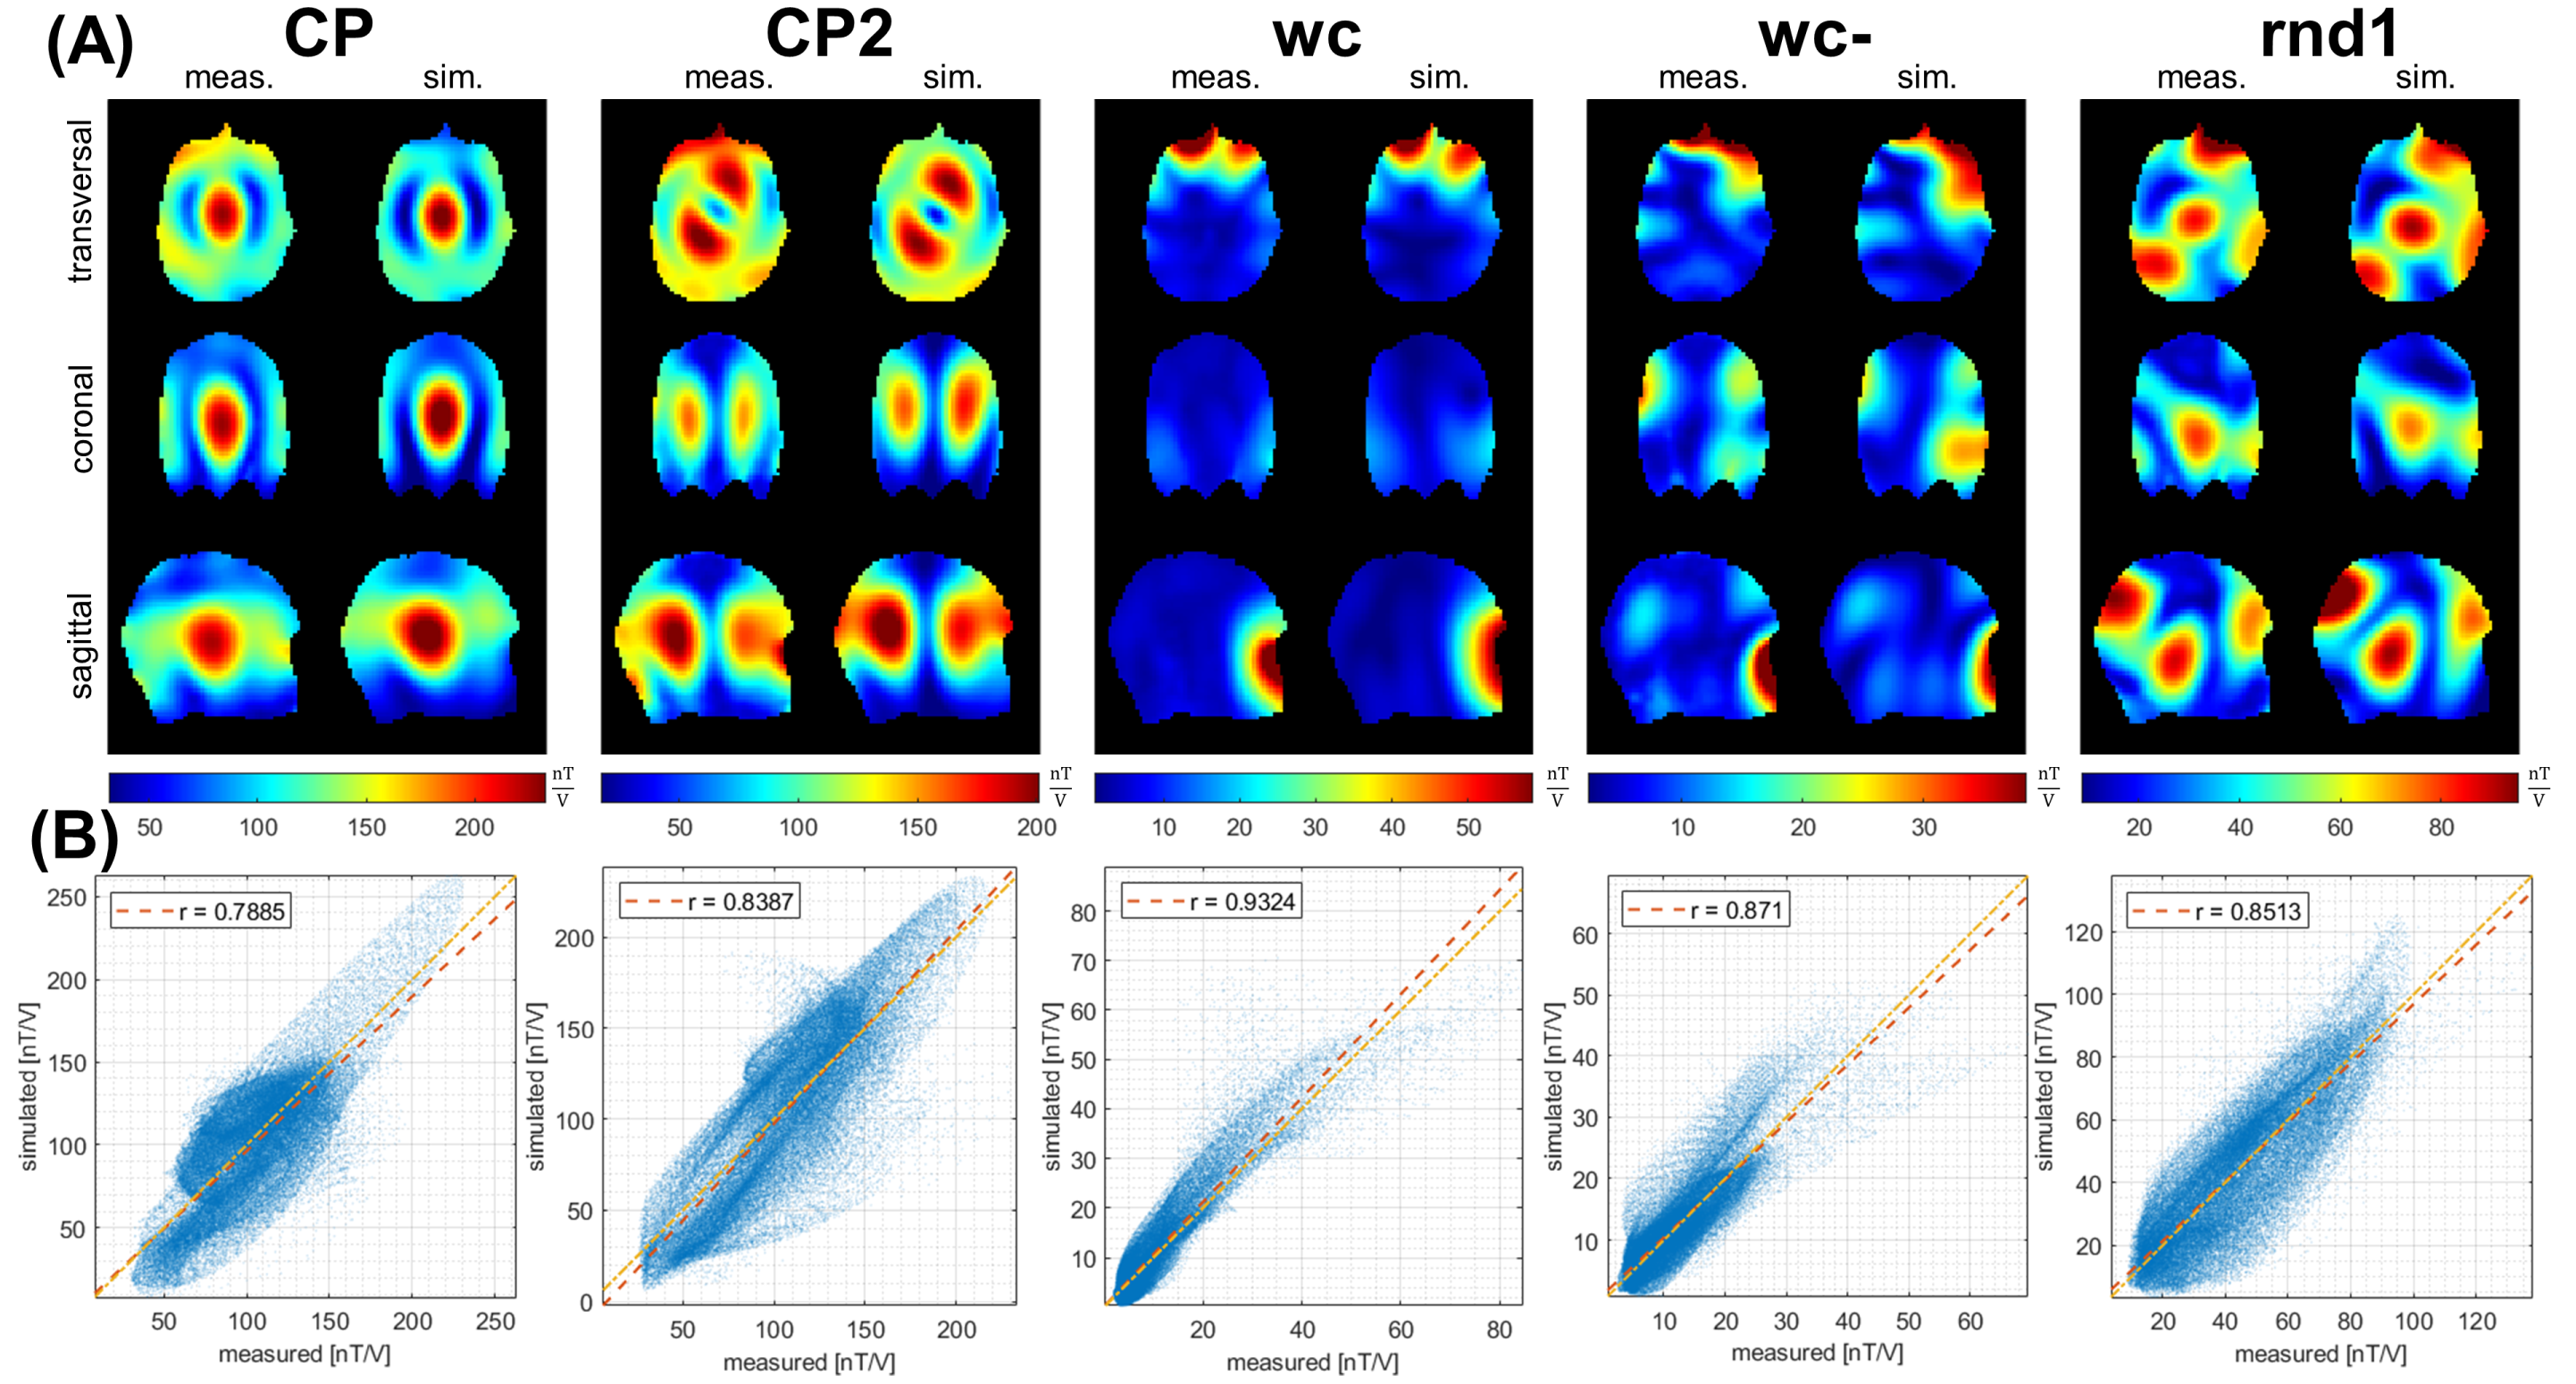
MR measurements are performed on a 9.4T scanner (Siemens Healthineers) using a homogeneous head-and-shoulder phantom (ε=58.6, σ=0.64 S/m). B1+ maps are acquired using a 3D pre-saturated turboFLASH sequence14. Simulated B1+ maps are obtained in CST from a voxel model mimicking the real head-shoulder phantom. For a quantitative comparison of simulated and measured B1+ maps, co-registration onto the same voxel space is performed based on the respective object masks, allowing the generation of voxel-wise scatter plots and the Pearson correlation coefficient.
Results
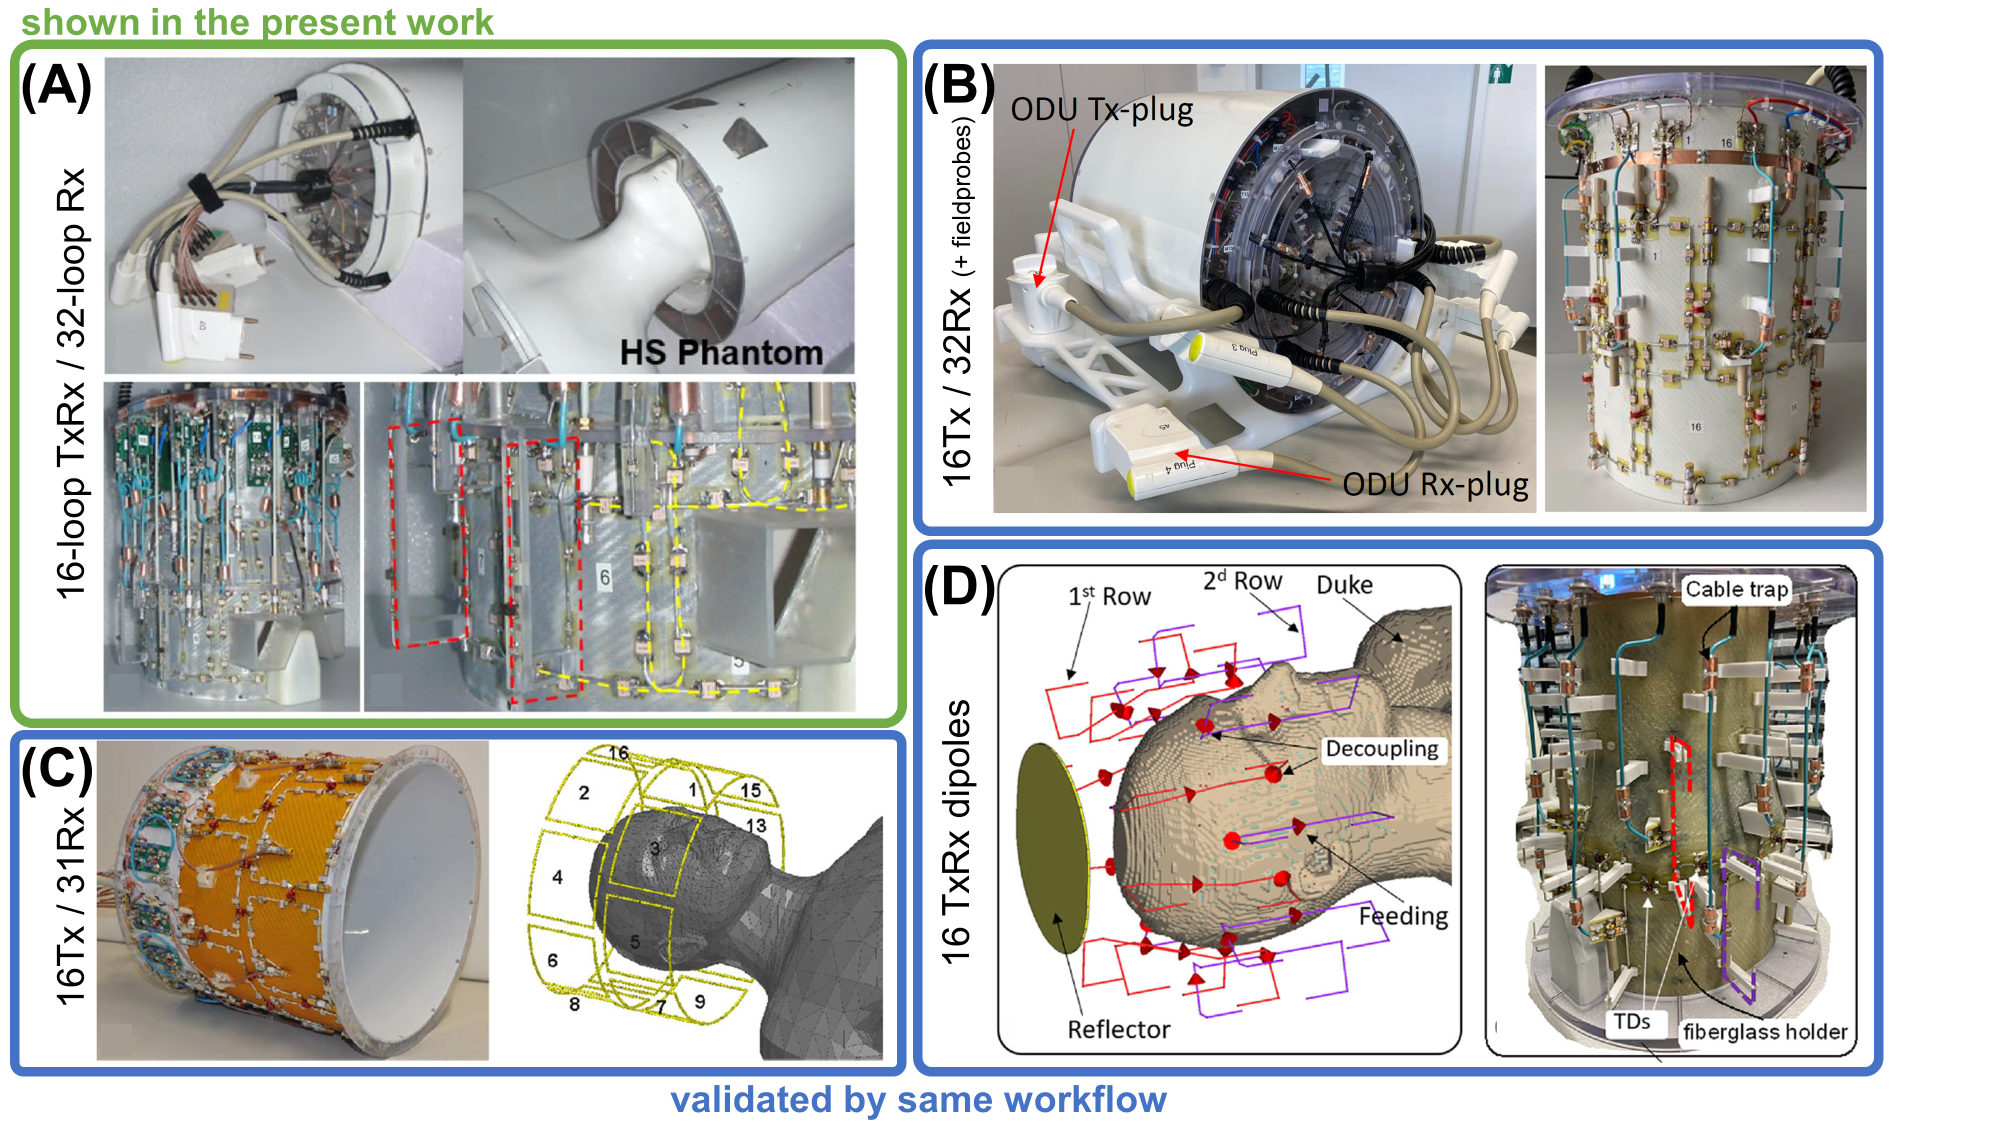
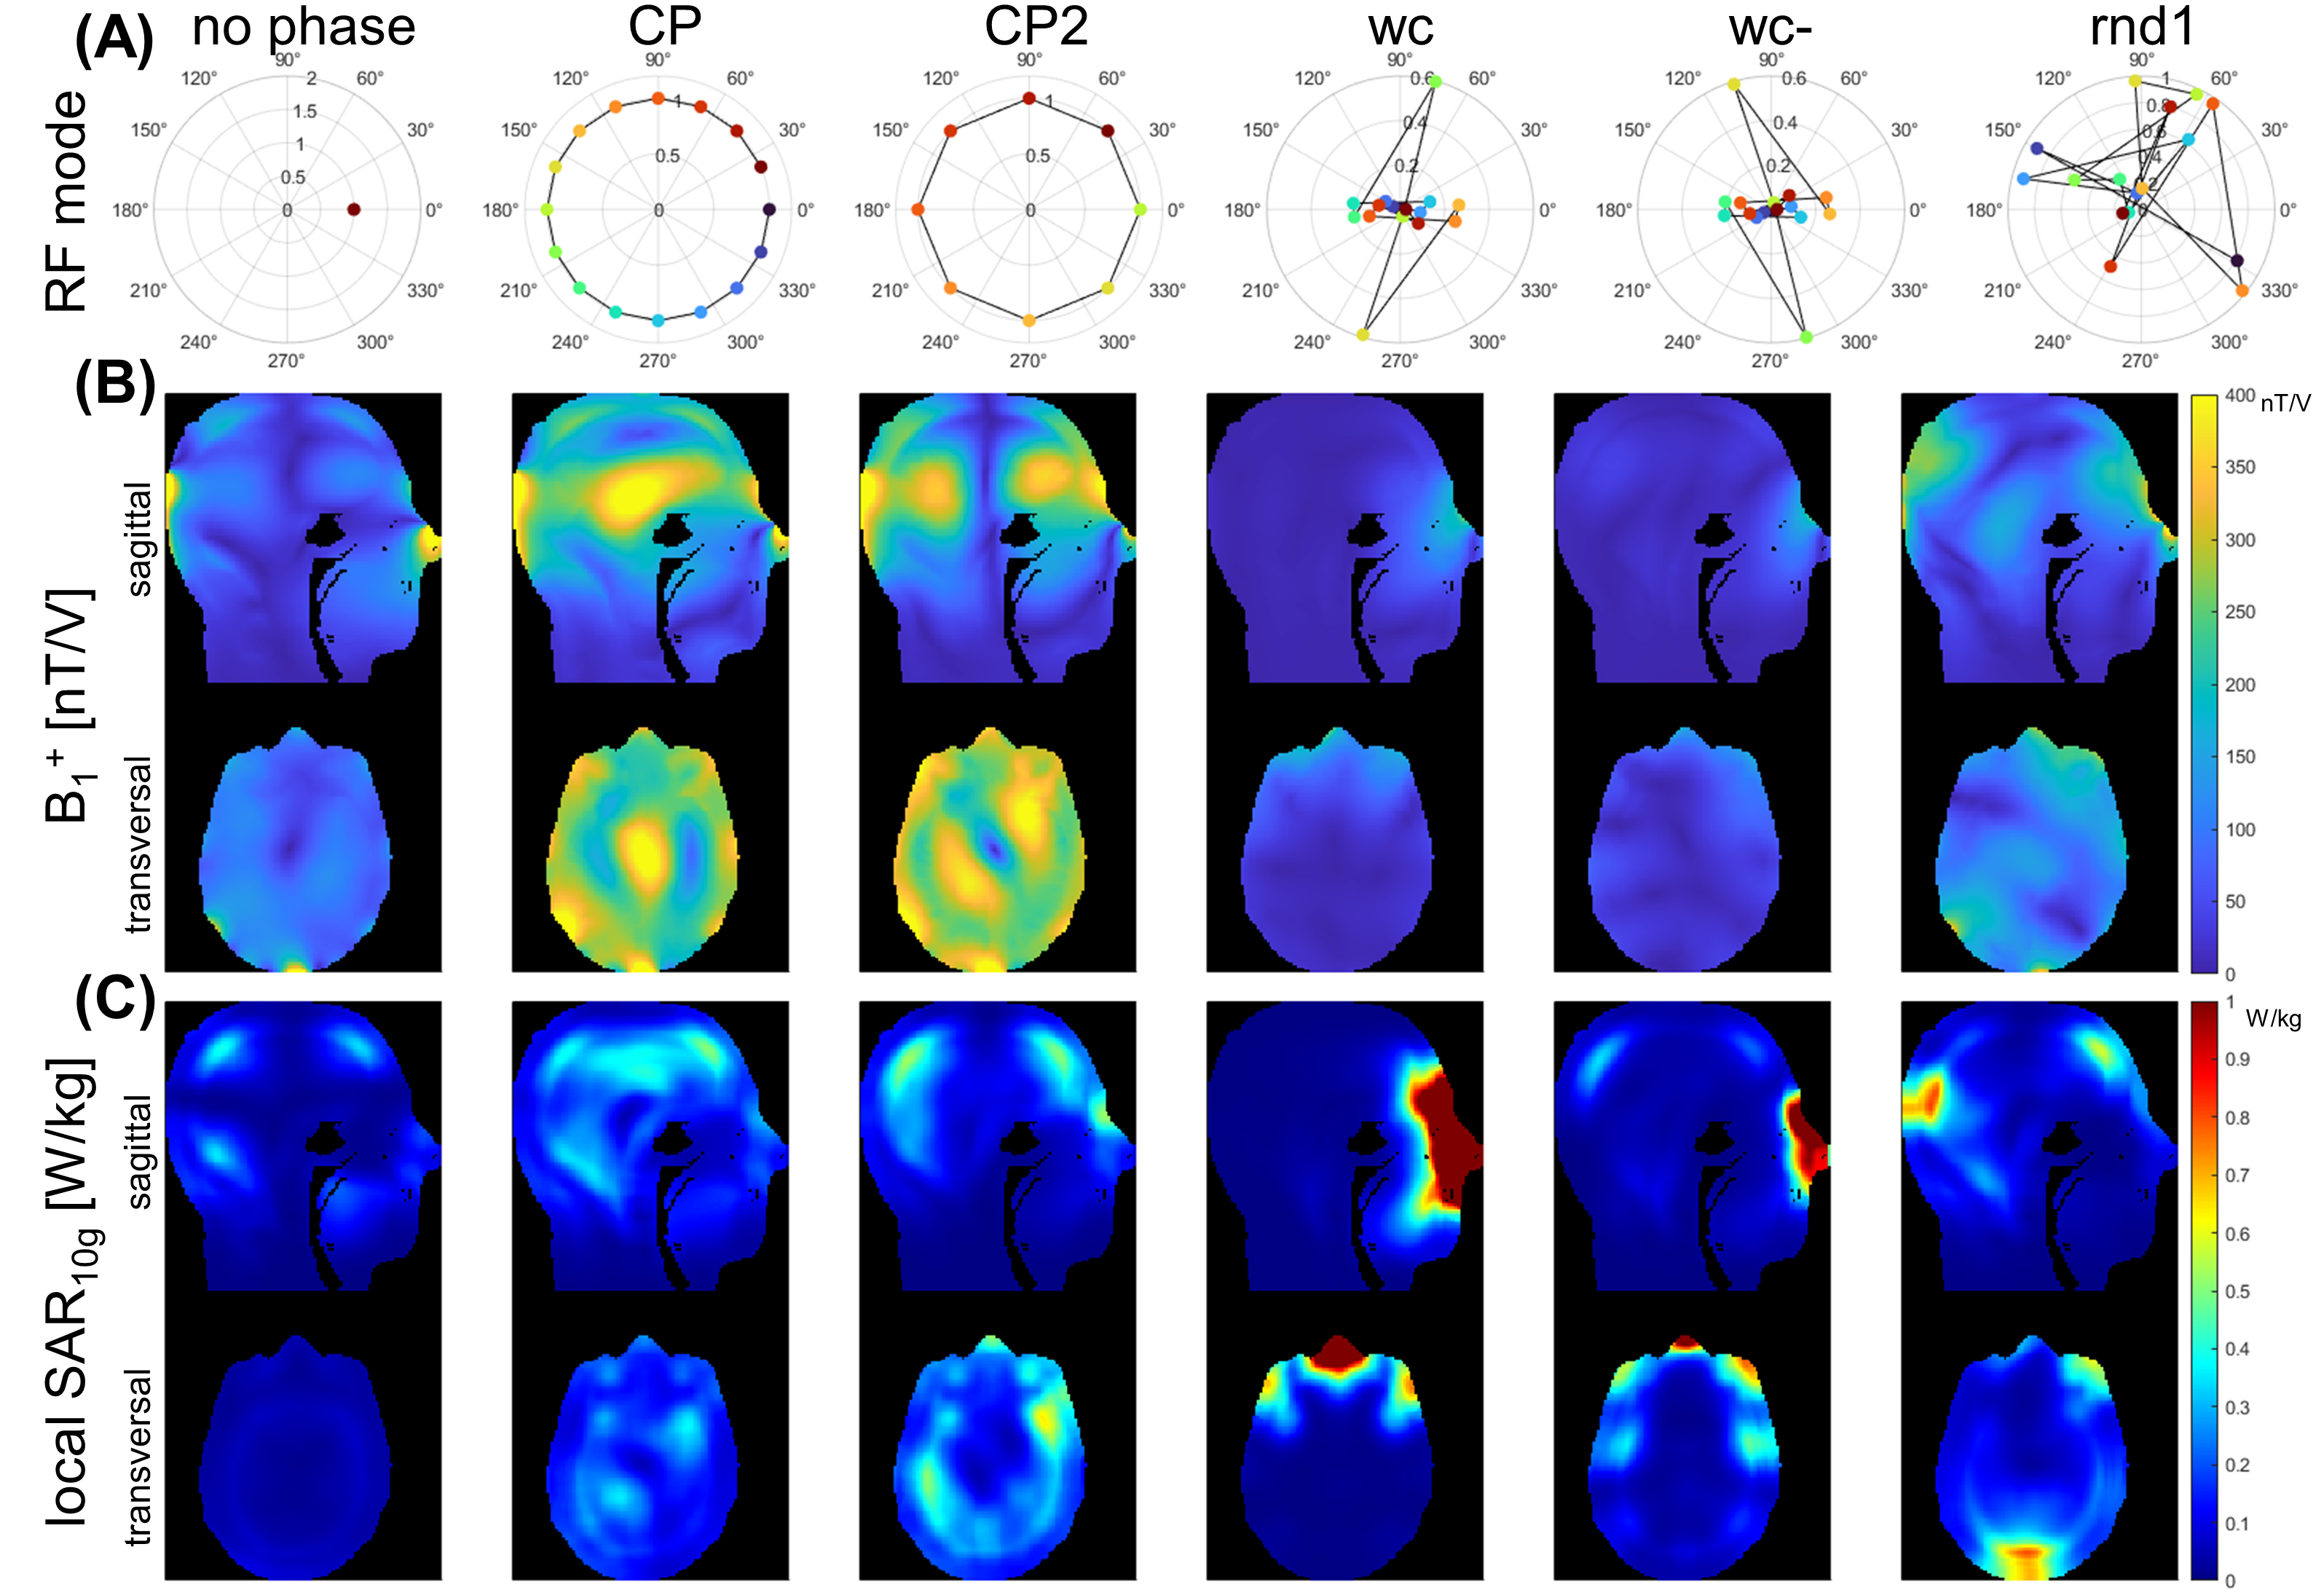
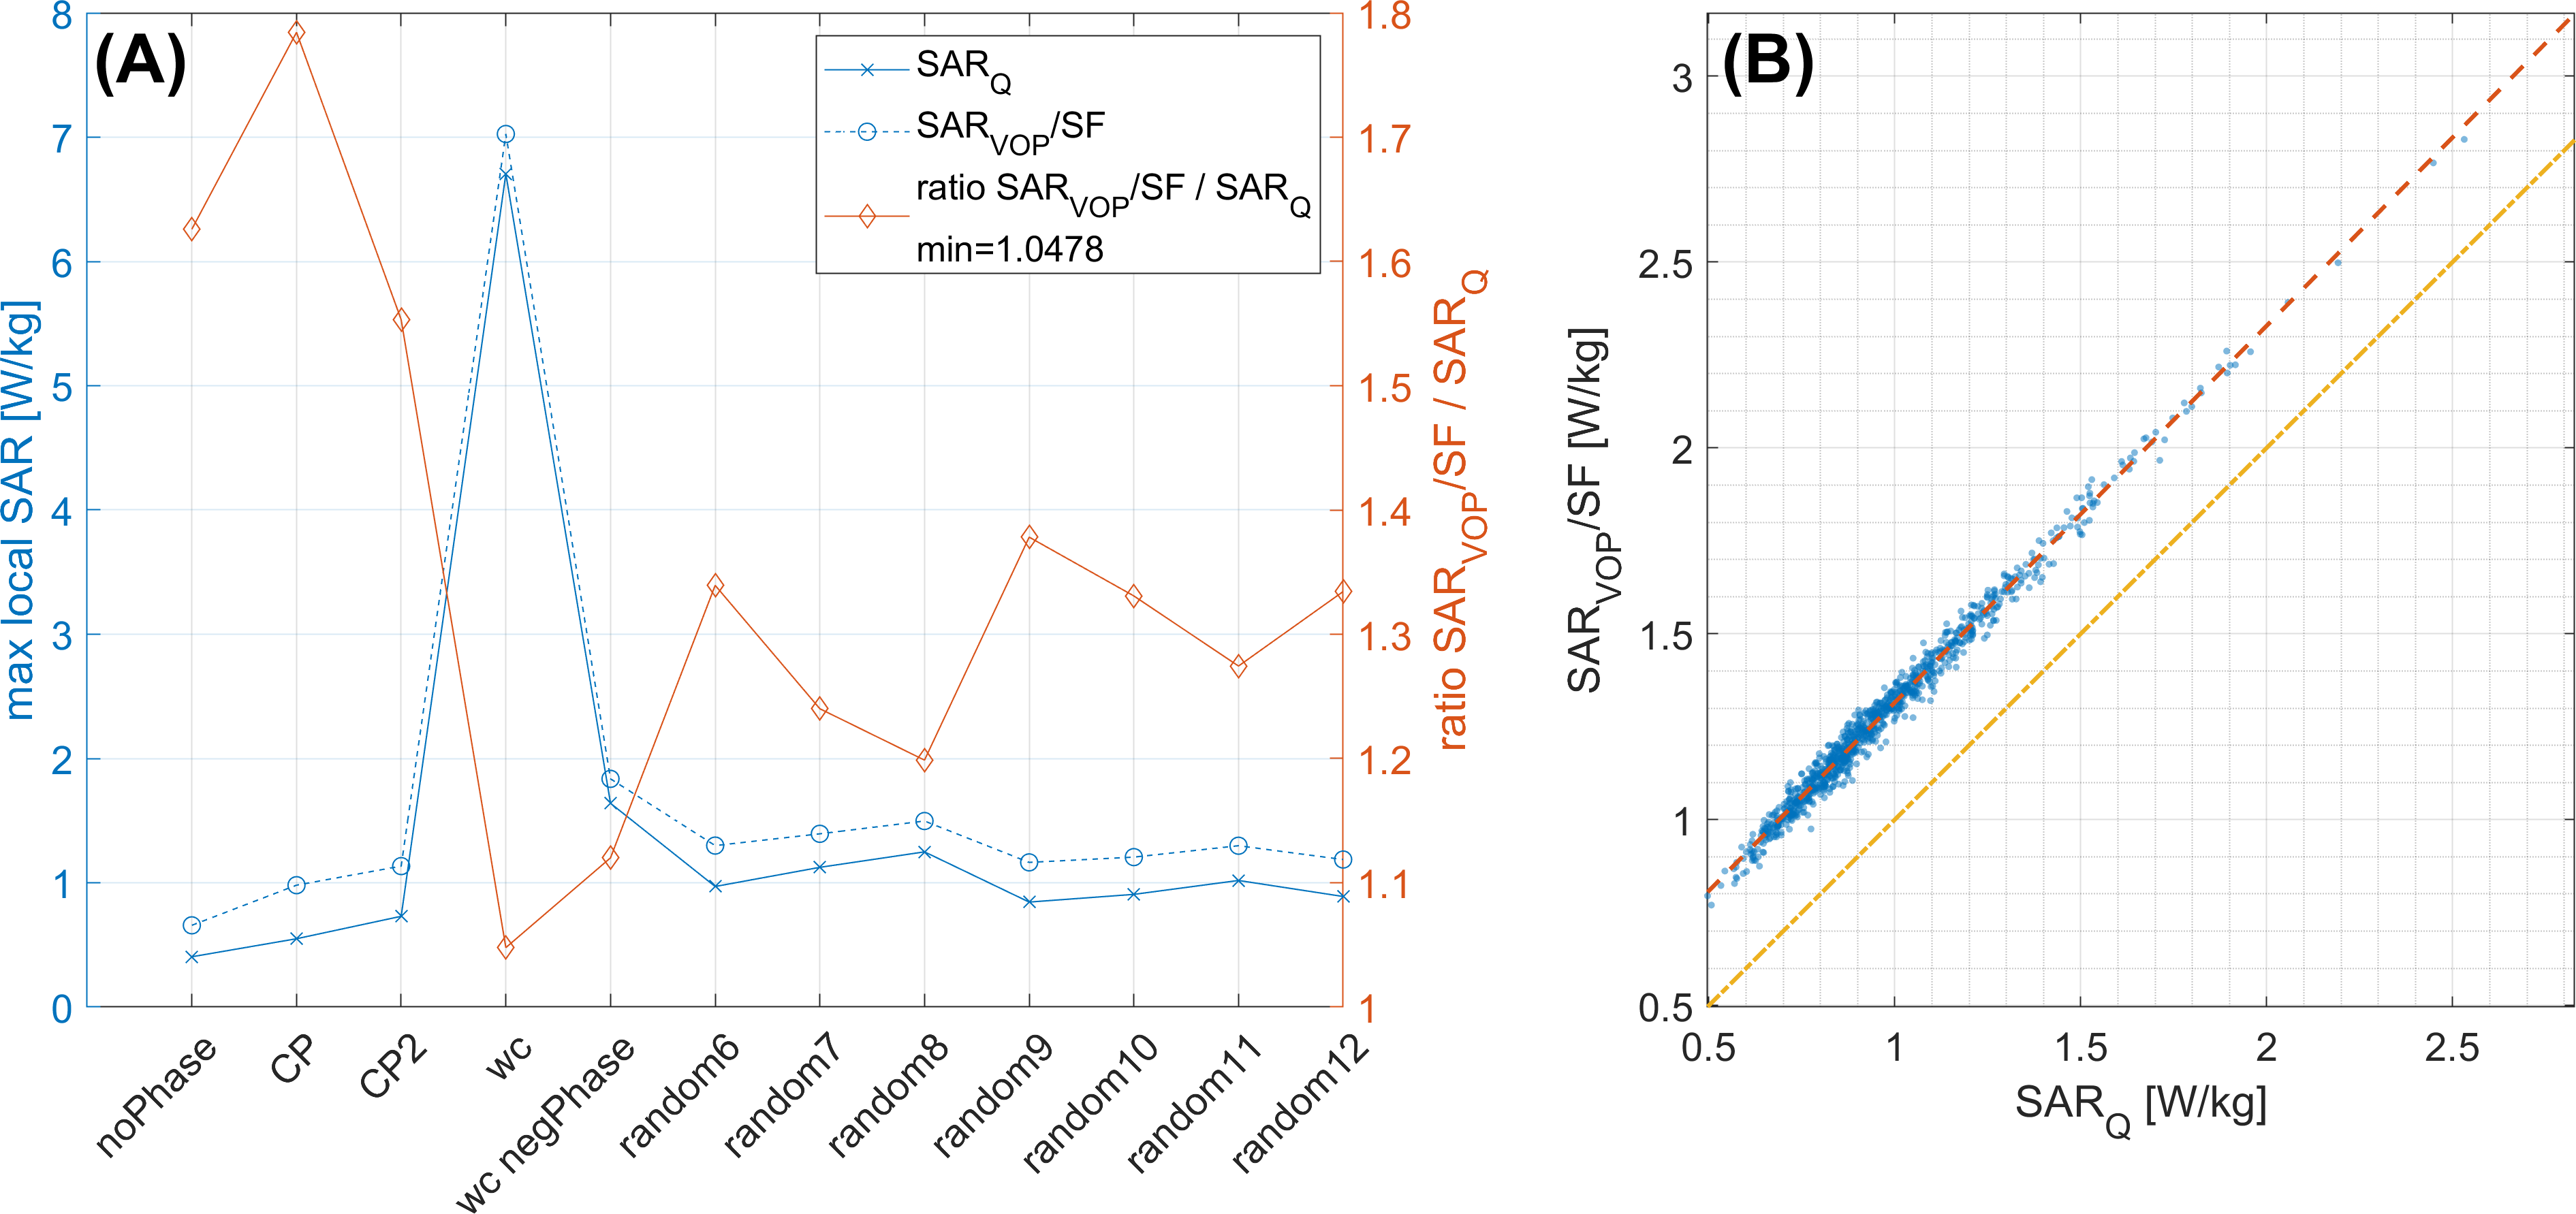
Results are shown for an in-house developed 16-loop TxRx / 32-loop Rx array15 (Figure 2A) as an example. Figure 3 shows simulated B1+ and SAR10g maps from CST for the defined RF test modes. Typical patterns of CP and CP2 modes can be observed in the B1+ maps, and it can be verified that the worst-case mode indeed results in the highest local SAR10g values. The corresponding SAR10g maps obtained from the Q-matrices in Matlab match up to numerical precision with the CST results, confirming correct generation of Q-matrices. Same holds for the comparison of B1+ maps from CST and Matlab. Figure 4 shows a comparison of maximum local SAR10g predicted by Q-matrices and VOP-matrices, where it can be verified that, in addition to the safety factor, the VOPs still overestimate local SAR10g by 4.78% at minimum. Figure 5 compares simulated and measured B1+ maps. Correlation coefficients range from 0.79 (CP mode) to 0.93 (worst-case mode), reflecting a good overall qualitative agreement, but also some visible discrepancies.Discussion and Conclusion
The proposed workflow has so far been applied for four self-built pTx coils15–18 (Fig. 2). The degree of agreement between simulated and measured B1+ was found similar for all of these coils. Possible reasons for remaining discrepancies include- interaction with structures affecting the RF field not included in the simulations (e.g., Rx coils)
- discrepancies between the tissue properties assumed for simulation and the real phantom
- inaccuracies of the experimental B1+ mapping procedure especially in low-intensity regions
- imperfect coregistration of experimental and simulated data.
Acknowledgements
Financial support of the Max-Planck-Society, ERC Advanced Grant “SpreadMRI”, No 834940 and DFG Grant SCHE 658/12 is gratefully acknowledged.References
1. Katscher U, Börnert P, Leussler C, Brink JS van den. Transmit SENSE. Magn Reson Med. 2003;49(1):144-150. doi:https://doi.org/10.1002/mrm.10353.
2. Zhu Y. Parallel excitation with an array of transmit coils. Magn Reson Med. 2004;51(4):775-784. doi:10.1002/mrm.20011.
3. IEC 60601-2-33. Medical Electrical Equipment – Part 2-33: Particular Requirements for the Basic Safety and Essential Performance of Magnetic Resonance Equipment for Medical Diagnosis, Edition 3.1. Geneva: International Electrotechnical Commission; 2013.
4. Hoffmann J, Henning A, Giapitzakis IA, et al. Safety testing and operational procedures for self-developed radiofrequency coils. NMR Biomed. 2016;29(9):1131-1144. doi:10.1002/nbm.3290.
5. Steensma BR, Sadeghi-Tarakameh A, Meliadò EF, et al. Tier-based formalism for safety assessment of custom-built radio-frequency transmit coils. NMR Biomed. 2023;36(5):e4874. doi:10.1002/nbm.4874.
6. Graesslin I, Vernickel P, Börnert P, et al. Comprehensive RF safety concept for parallel transmission MR. Magn Reson Med. 2015;74(2):589-598. doi:10.1002/mrm.25425.
7. Sadeghi-Tarakameh A, DelaBarre L, Lagore RL, et al. In vivo human head MRI at 10.5T: A radiofrequency safety study and preliminary imaging results. Magn Reson Med. 2020;84(1):484-496. doi:10.1002/mrm.28093.
8. Homann H, Graesslin I, Eggers H, et al. Local SAR management by RF Shimming: a simulation study with multiple human body models. Magn Reson Mater Phy. 2012;25(3):193-204. doi:10.1007/s10334-011-0281-8.
9. Eichfelder G, Gebhardt M. Local specific absorption rate control for parallel transmission by virtual observation points. Magn Reson Med. 2011;66(5):1468-1476. doi:10.1002/mrm.22927.
10. Beqiri A, Hand JW, Hajnal JV, Malik SJ. Local Q-matrix computation for parallel transmit MRI using optimal channel combinations. In: Proc. Intl. Soc. Mag. Reson. Med. 24 (2016). Singapore; 2016
11. Christ A, Kainz W, Hahn EG, et al. The Virtual Family—development of surface-based anatomical models of two adults and two children for dosimetric simulations. Phys Med Biol. 2009;55(2):N23. doi:10.1088/0031-9155/55/2/N01.
12. Neufeld E, Gosselin MC, Murbach M, Christ A, Cabot E, Kuster N. Analysis of the local worst-case SAR exposure caused by an MRI multi-transmit body coil in anatomical models of the human body. Phys Med Biol. 2011;56(15):4649. doi:10.1088/0031-9155/56/15/002.
13. Orzada S, Fiedler TM, Quick HH, Ladd ME. Local SAR compression algorithm with improved compression, speed, and flexibility. Magn Reson Med. 2021;86(1):561-568. doi:10.1002/mrm.28739.
14. Bosch D, Bause J, Geldschläger O, Scheffler K. Optimized ultrahigh field parallel transmission workflow using rapid presaturated TurboFLASH transmit field mapping with a three-dimensional centric single-shot readout. Magn Reson Med. 2023;89(1):322-330. doi:10.1002/mrm.29459.
15. Avdievich NI, Giapitzakis IA, Bause J, Shajan G, Scheffler K, Henning A. Double-row 18-loop transceive–32-loop receive tight-fit array provides for whole-brain coverage, high transmit performance, and SNR improvement near the brain center at 9.4T. Magn Reson Med. 2019;81(5):3392-3405. doi:10.1002/mrm.27602.
16. Shajan G, Kozlov M, Hoffmann J, Turner R, Scheffler K, Pohmann R. A 16-channel dual-row transmit array in combination with a 31-element receive array for human brain imaging at 9.4 T. Magn Reson Med. 2014;71(2):870-879. doi:10.1002/mrm.24726.
17. Nikulin AV, Bosch D, Solomakha GA, Glang F, Scheffler K, Avdievich NI. Double-row 16-element folded-end dipole transceiver array for 3D RF shimming of the whole human brain at 9.4 T. NMR Biomed. 2023;36(10):e4981. doi:10.1002/nbm.4981.
18. Avdievich NI, Walzog J, Glang F, Scheffler K. Hardware and Procedure for Testing and Evaluation of a pTx 16-Element Transmit/ 32-Element Receive Array Coils at 9.4T. Submitted to 2024 ISMRM & ISMRT Annual Meeting & Exhibition, Singapur.
19. Gabel F, Solomakha G, Bosch D, Glang F, Scheffler K, Bause J. Impact of individual voxel models on head SAR estimation. Submitted to 2024 ISMRM & ISMRT Annual Meeting & Exhibition, Singapur.
20. Le Ster C, Mauconduit F, Mirkes C, et al. RF heating measurement using MR thermometry and field monitoring: Methodological considerations and first in vivo results. Magn. Reson. Med. 2021;85(3):1282-1293. doi:10.1002/mrm.28501
Figures