0478
Local SAR comparison of leg positioning in 16-channel proton/sodium dipole/loop array for 7T MRI1King's College London, London, United Kingdom, 2Department of Physics, The Royal Marsden NHS Foundation Trust, Sutton, United Kingdom, 3Division of Radiotherapy and Imaging, The Institute of Cancer Research, London, United Kingdom, 4Department of Bioengineering, Imperial College London, London, United Kingdom, 5London Collaborative Ultra high field System (LoCUS), London, United Kingdom
Synopsis
Keywords: Safety, Safety
Motivation: Sodium(23Na)/proton(1H) MRI of the extremities have great potential in diagnosis and treatment of musculoskeletal conditions and oncology applications (e.g.soft-tissue sarcomas).
Goal(s): Assessing the performance of a novel 16-channel 1H/23Na MRI coil across varied leg positions and establish safe RF power limits for clinical applications.
Approach: Electromagnetic simulations to analyse coil performance in four leg positions. SAR10g levels were compared across configurations while maintaining B1+ field efficacy.
Results: The coil showed consistent B1+ performance across all tested positions. The highest SAR levels occurred with calf-to-coil contact, aligning with predictions. Safe RF power limits were established, supporting the coil's clinical potential for extremity imaging
Impact: This study validates an innovative 16-channel 1H/23Na coil, setting benchmarks for safe RF power limits, and enhancing disease characterisation, enabling clinical research in musculoskeletal pathologies and soft-tissue sarcoma in the extremities.
Introduction
Combining sodium(23Na)/proton(1H) MRI enables a non-invasive biomarker for musculoskeletal conditions such as osteoarthritis and oncology applications such as soft-tissue sarcoma located in the extremities1-3. An in-house-developed 16-channel 1H/23Na coil has been presented for head imaging, and its open design allows imaging of lower legs.4 The aim of this study is to evaluate the coil performance for various leg positions with electromagnetic simulations and establish safe RF power limits for subsequent in-vivo experiments.Methods
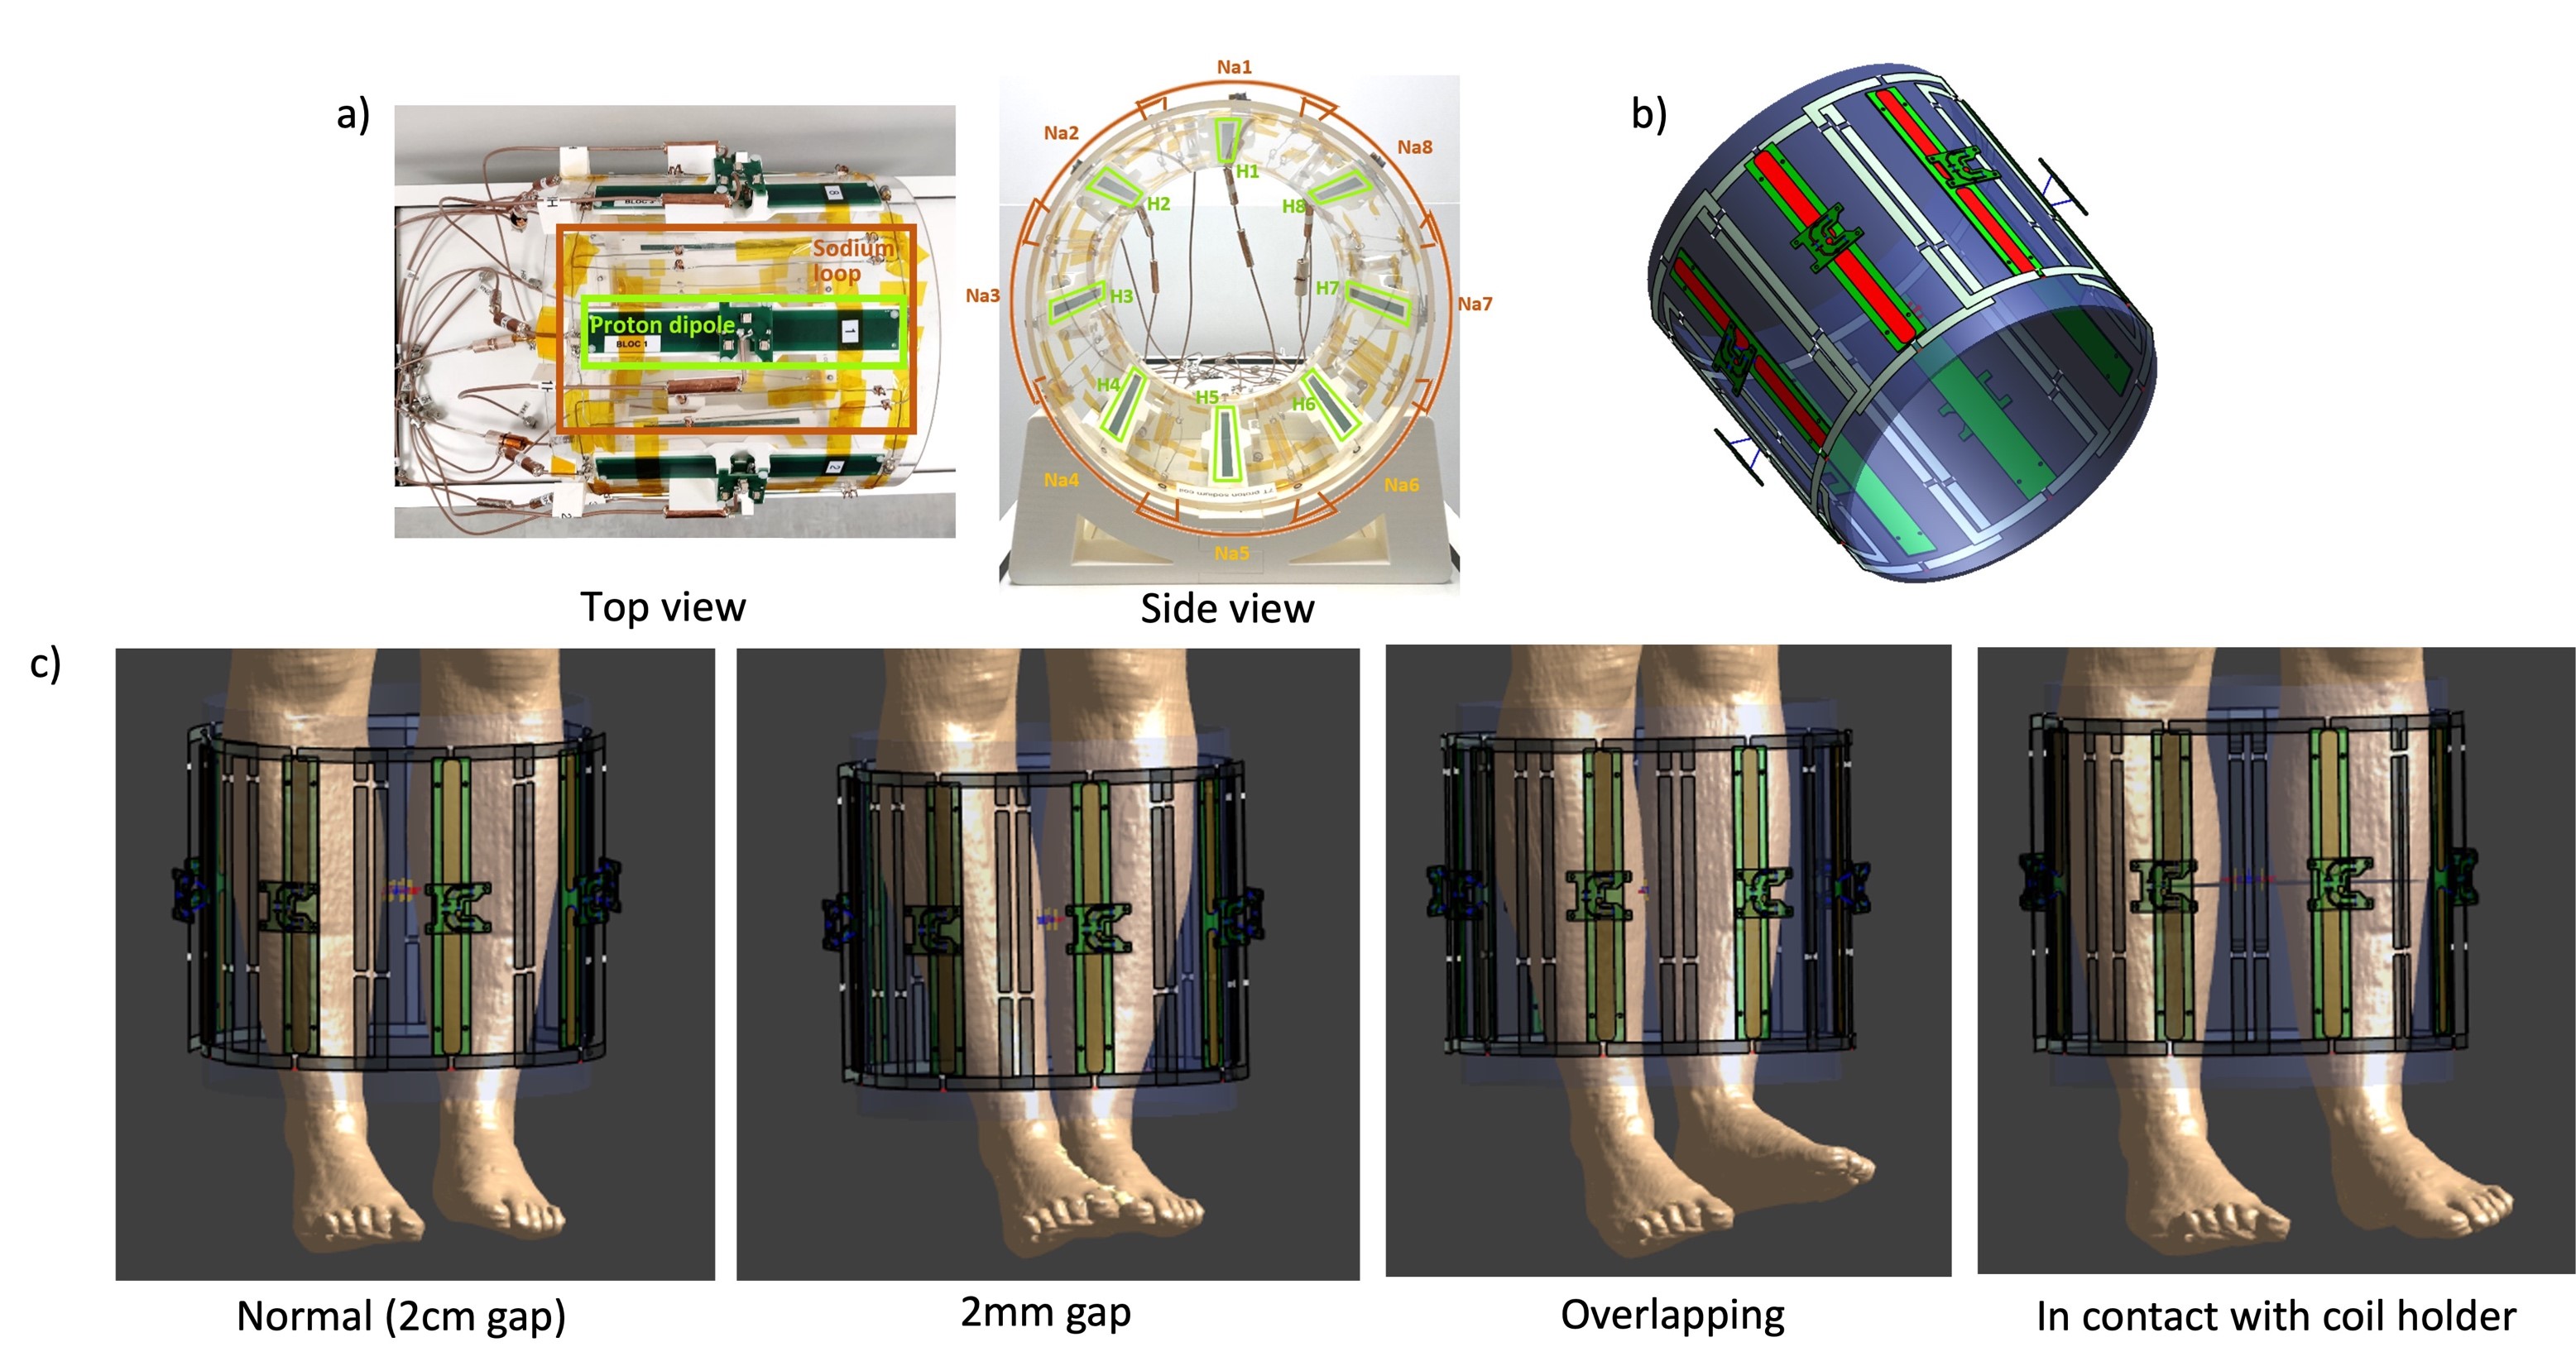
Electromagnetic field simulations The electromagnetic field simulations were performed using a finite-difference time-domain(FDTD) simulation software(Sim4life 7.2,ZMT,Switzerland). A 16-channel proton/sodium dipole/loop array was designed and constructed in house.(Fig.1a) The centre-shortened dipoles were modelled, including the FR-4 substrate (ɛr = 4,α=0 S/m). The conductive parts of the dipoles and loop coils were defined perfect electric conductor(PEC). The coil holder was imported to accurately position the dipoles but not simulated.(Fig.1b)Four simulation setups were carried out for four positions of Ella human model5 centring middles of the calves.(Fig.1c) The positions are chosen to accommodate all possible scenarios in the scanner. The normal position is defined based on the common clinical setup where the patient has a cushion of 2cm thickness between the calves. The second position removes the cushion, leaving a smaller gap of 2mm. The third position mimics a potential worst-case where the calves are overlapping(i.e.touching calves). The fourth position is the second potential worst-case where both calves are in contact with the coil holder and therefore near the array.
The tuning/matching circuit included all lumped elements in the built array for a proper correspondence to measurements. All RF ports were driven individually by a Gaussian excitation centred at 297.2 MHz for proton or 78.6MHz for sodium with a 100 MHz bandwidth for 300 periods with auto-termination when the convergence reaches to -35dB. All conductive elements from both nuclei are modelled and included in the environment of all simulations where only sources for the designated nuclei were driven.
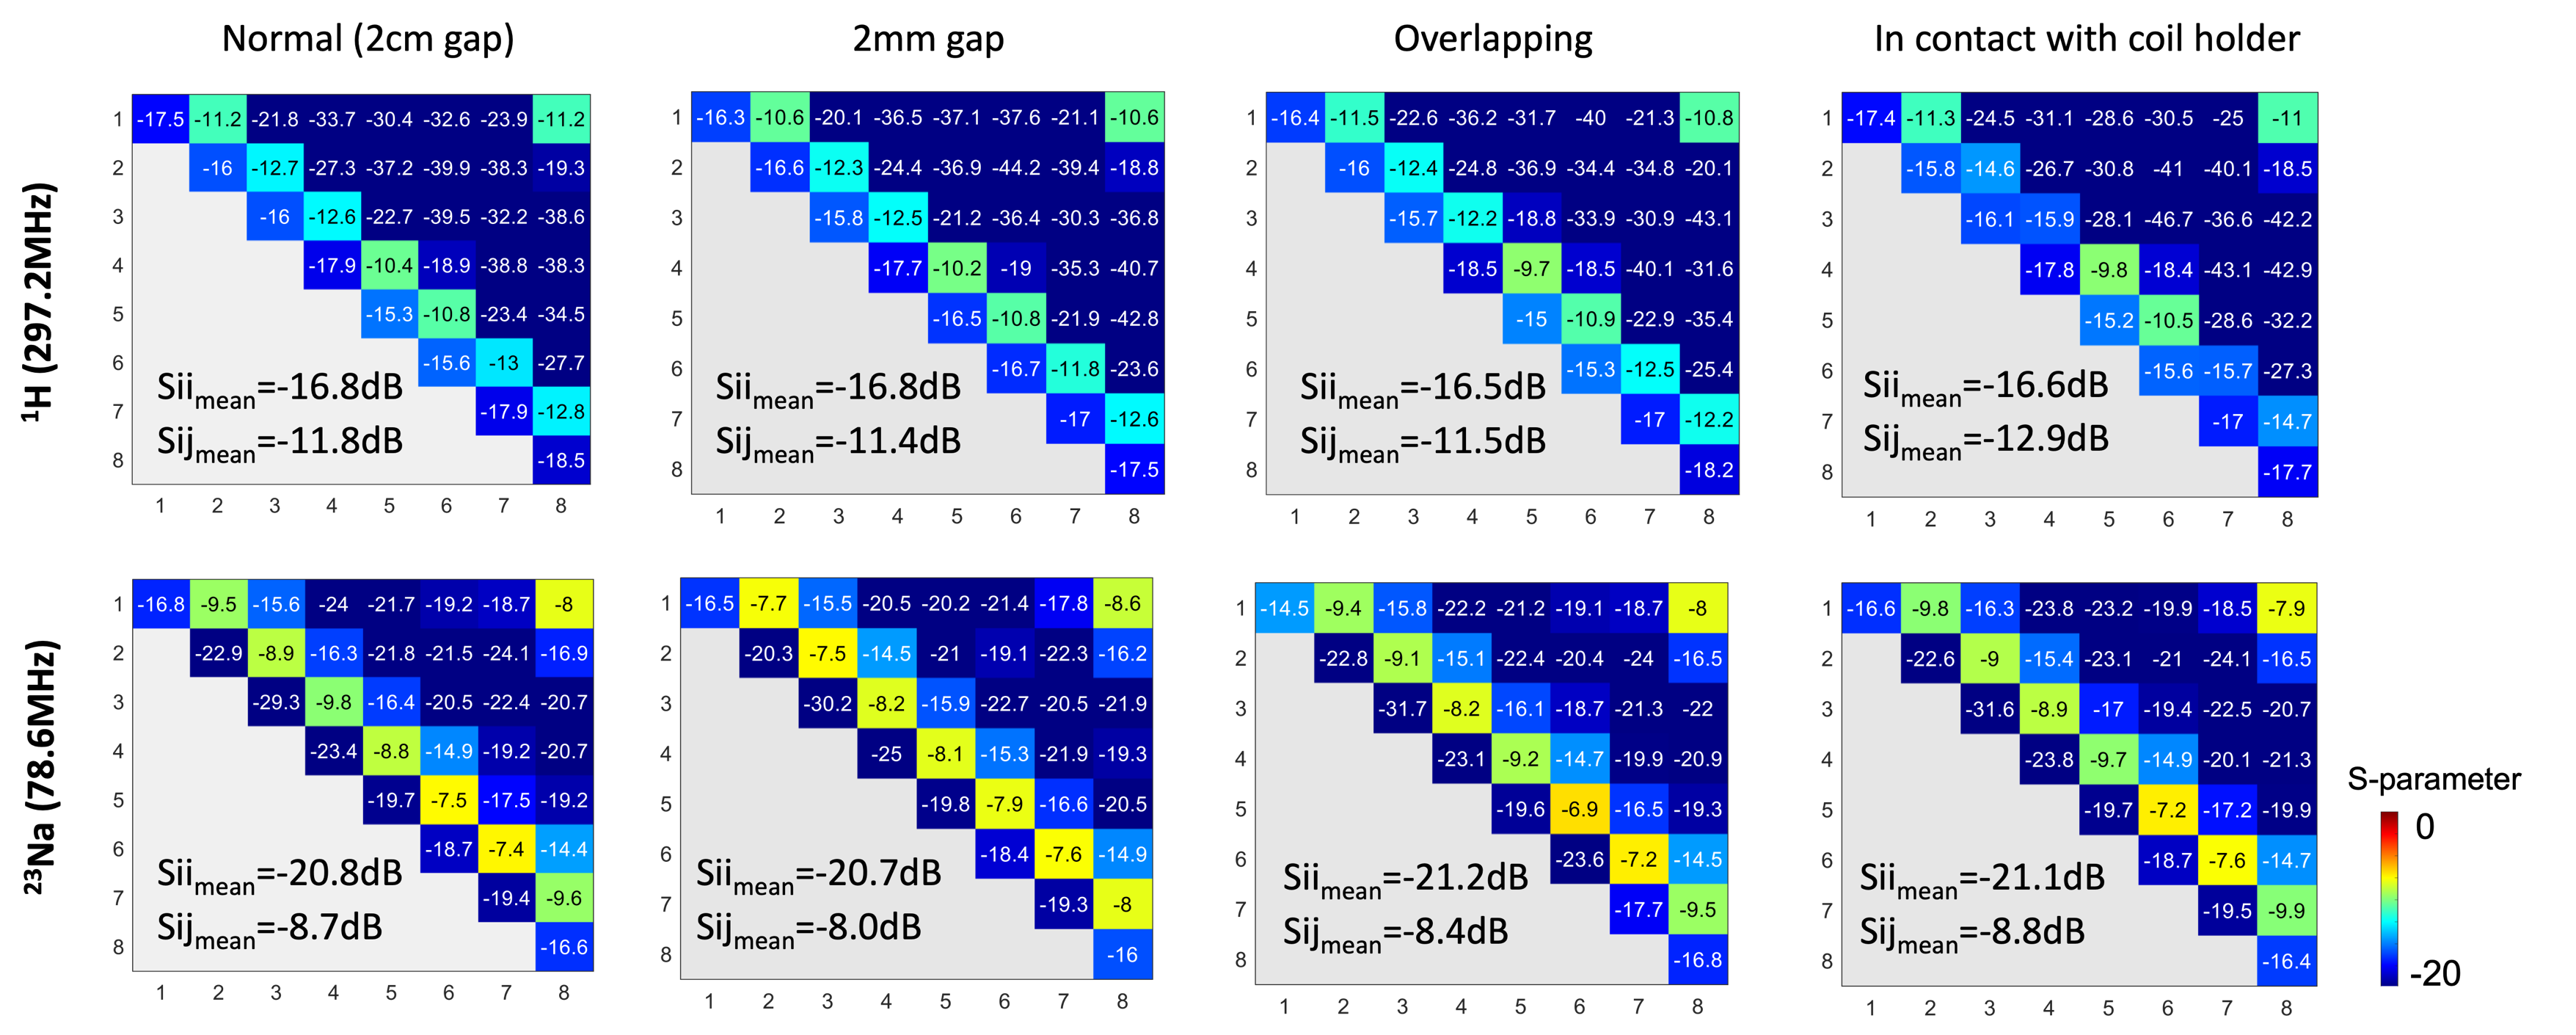
A co-simulation approach(Optenni Ltd,Finland) was used to adjust the lumped elements of the dipoles or loops to tune and match at 297.2 MHz or 78.6MHz and 50 Ohms. The process was done separately for each of the four positions to ensure that the coil array is tuned and matched to similar levels.(Fig.2)
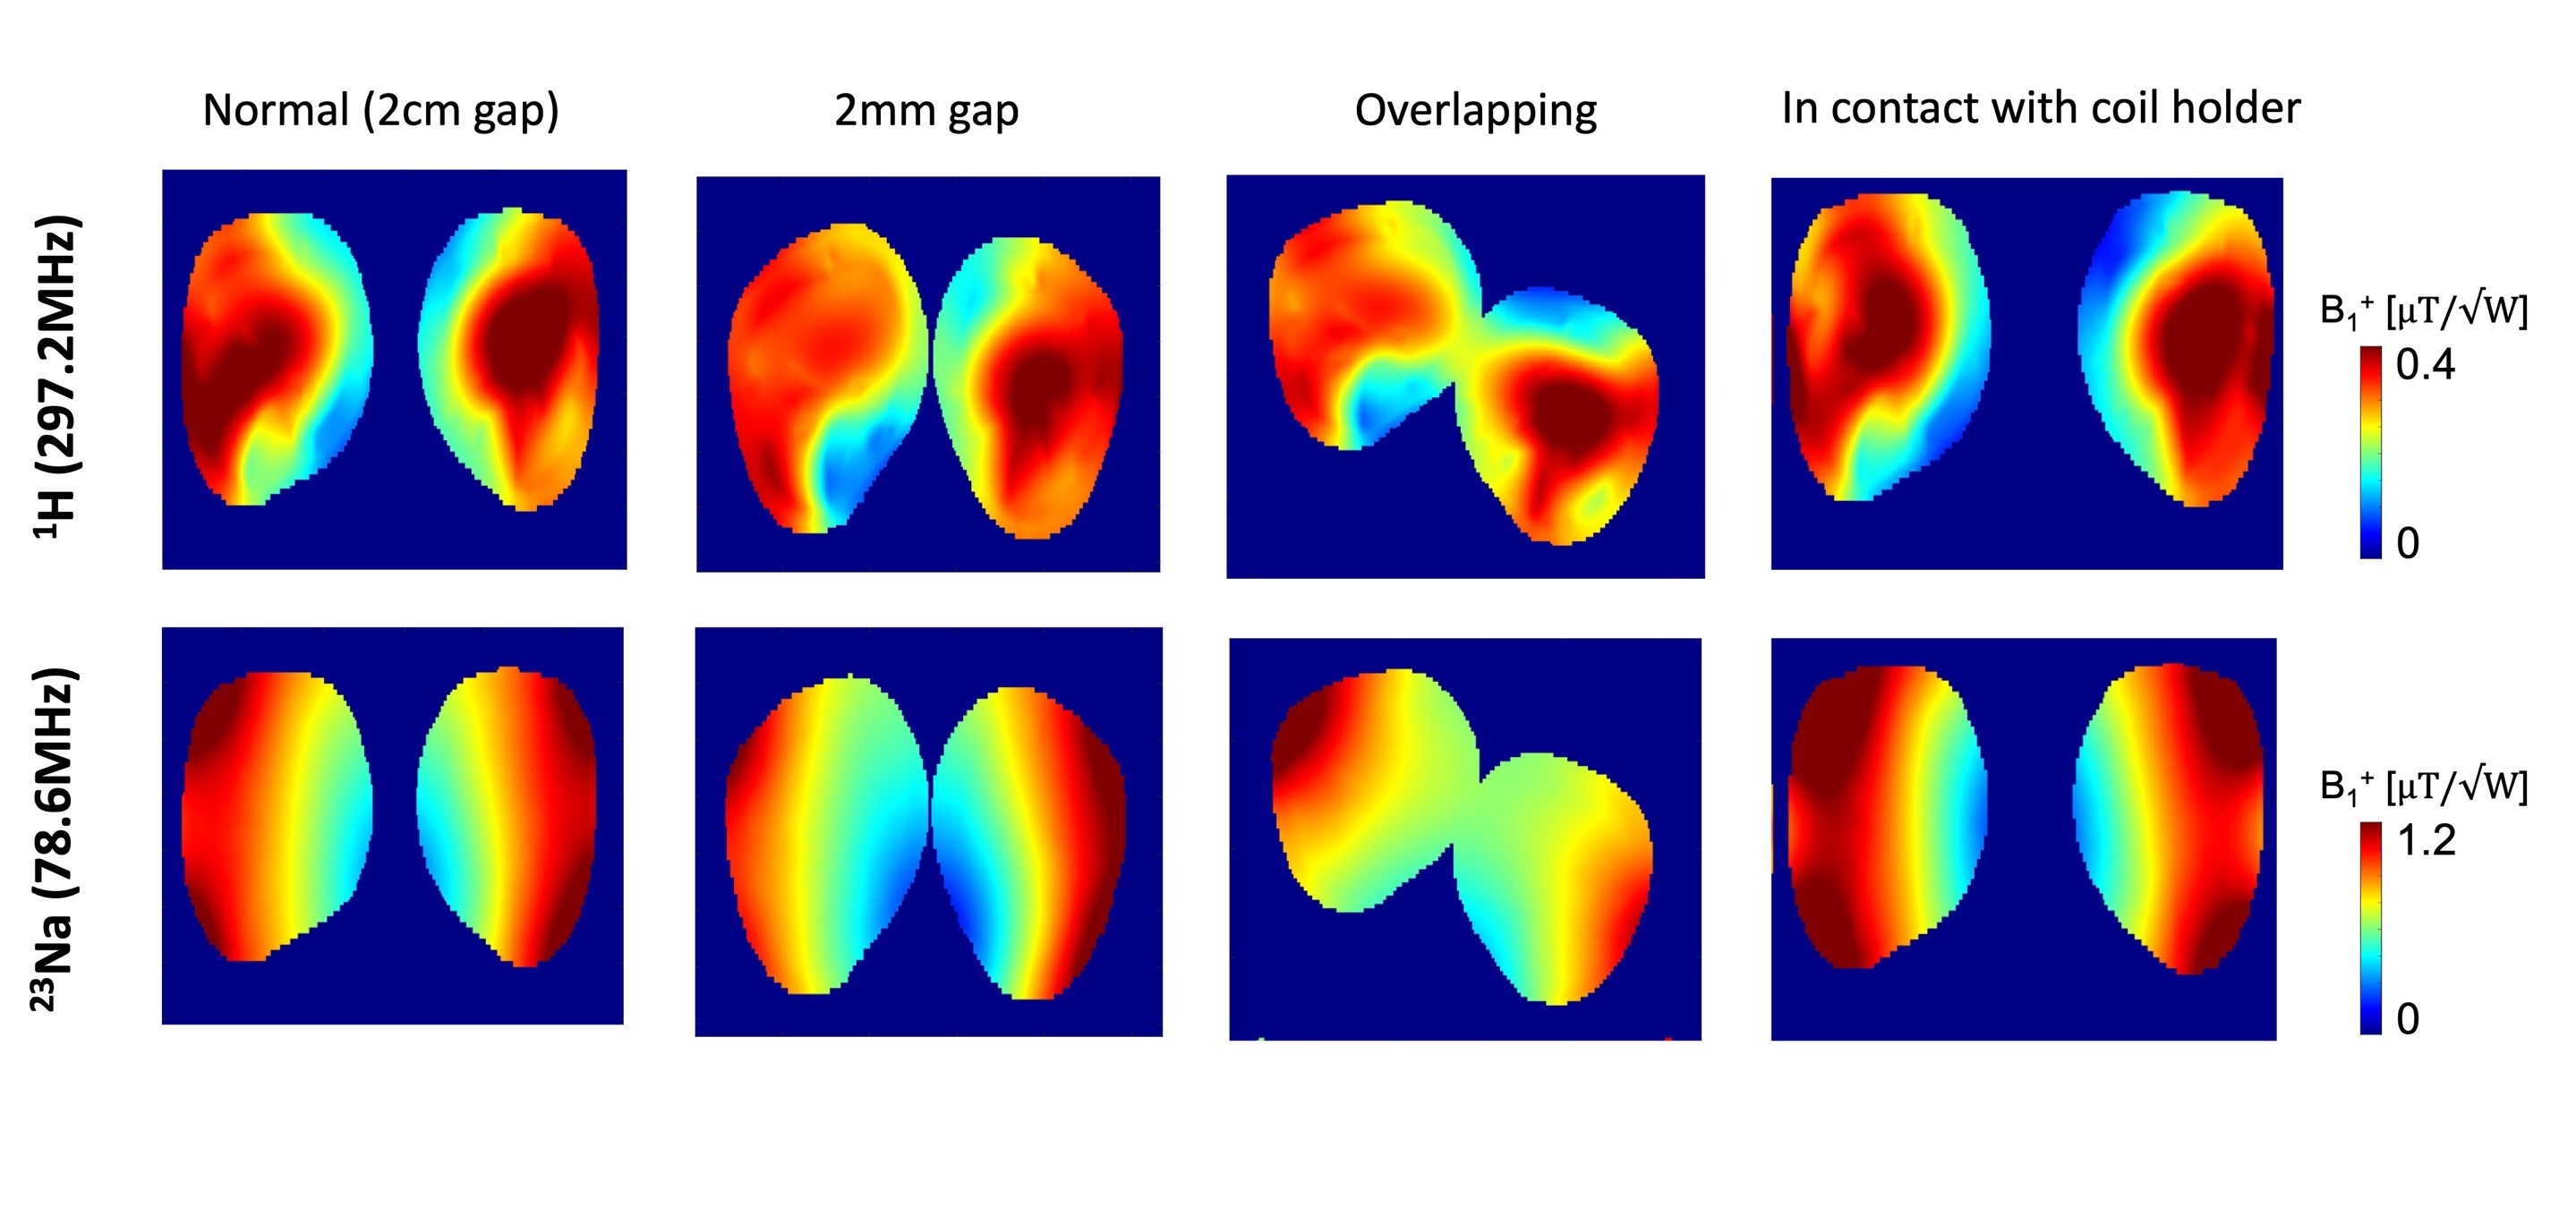
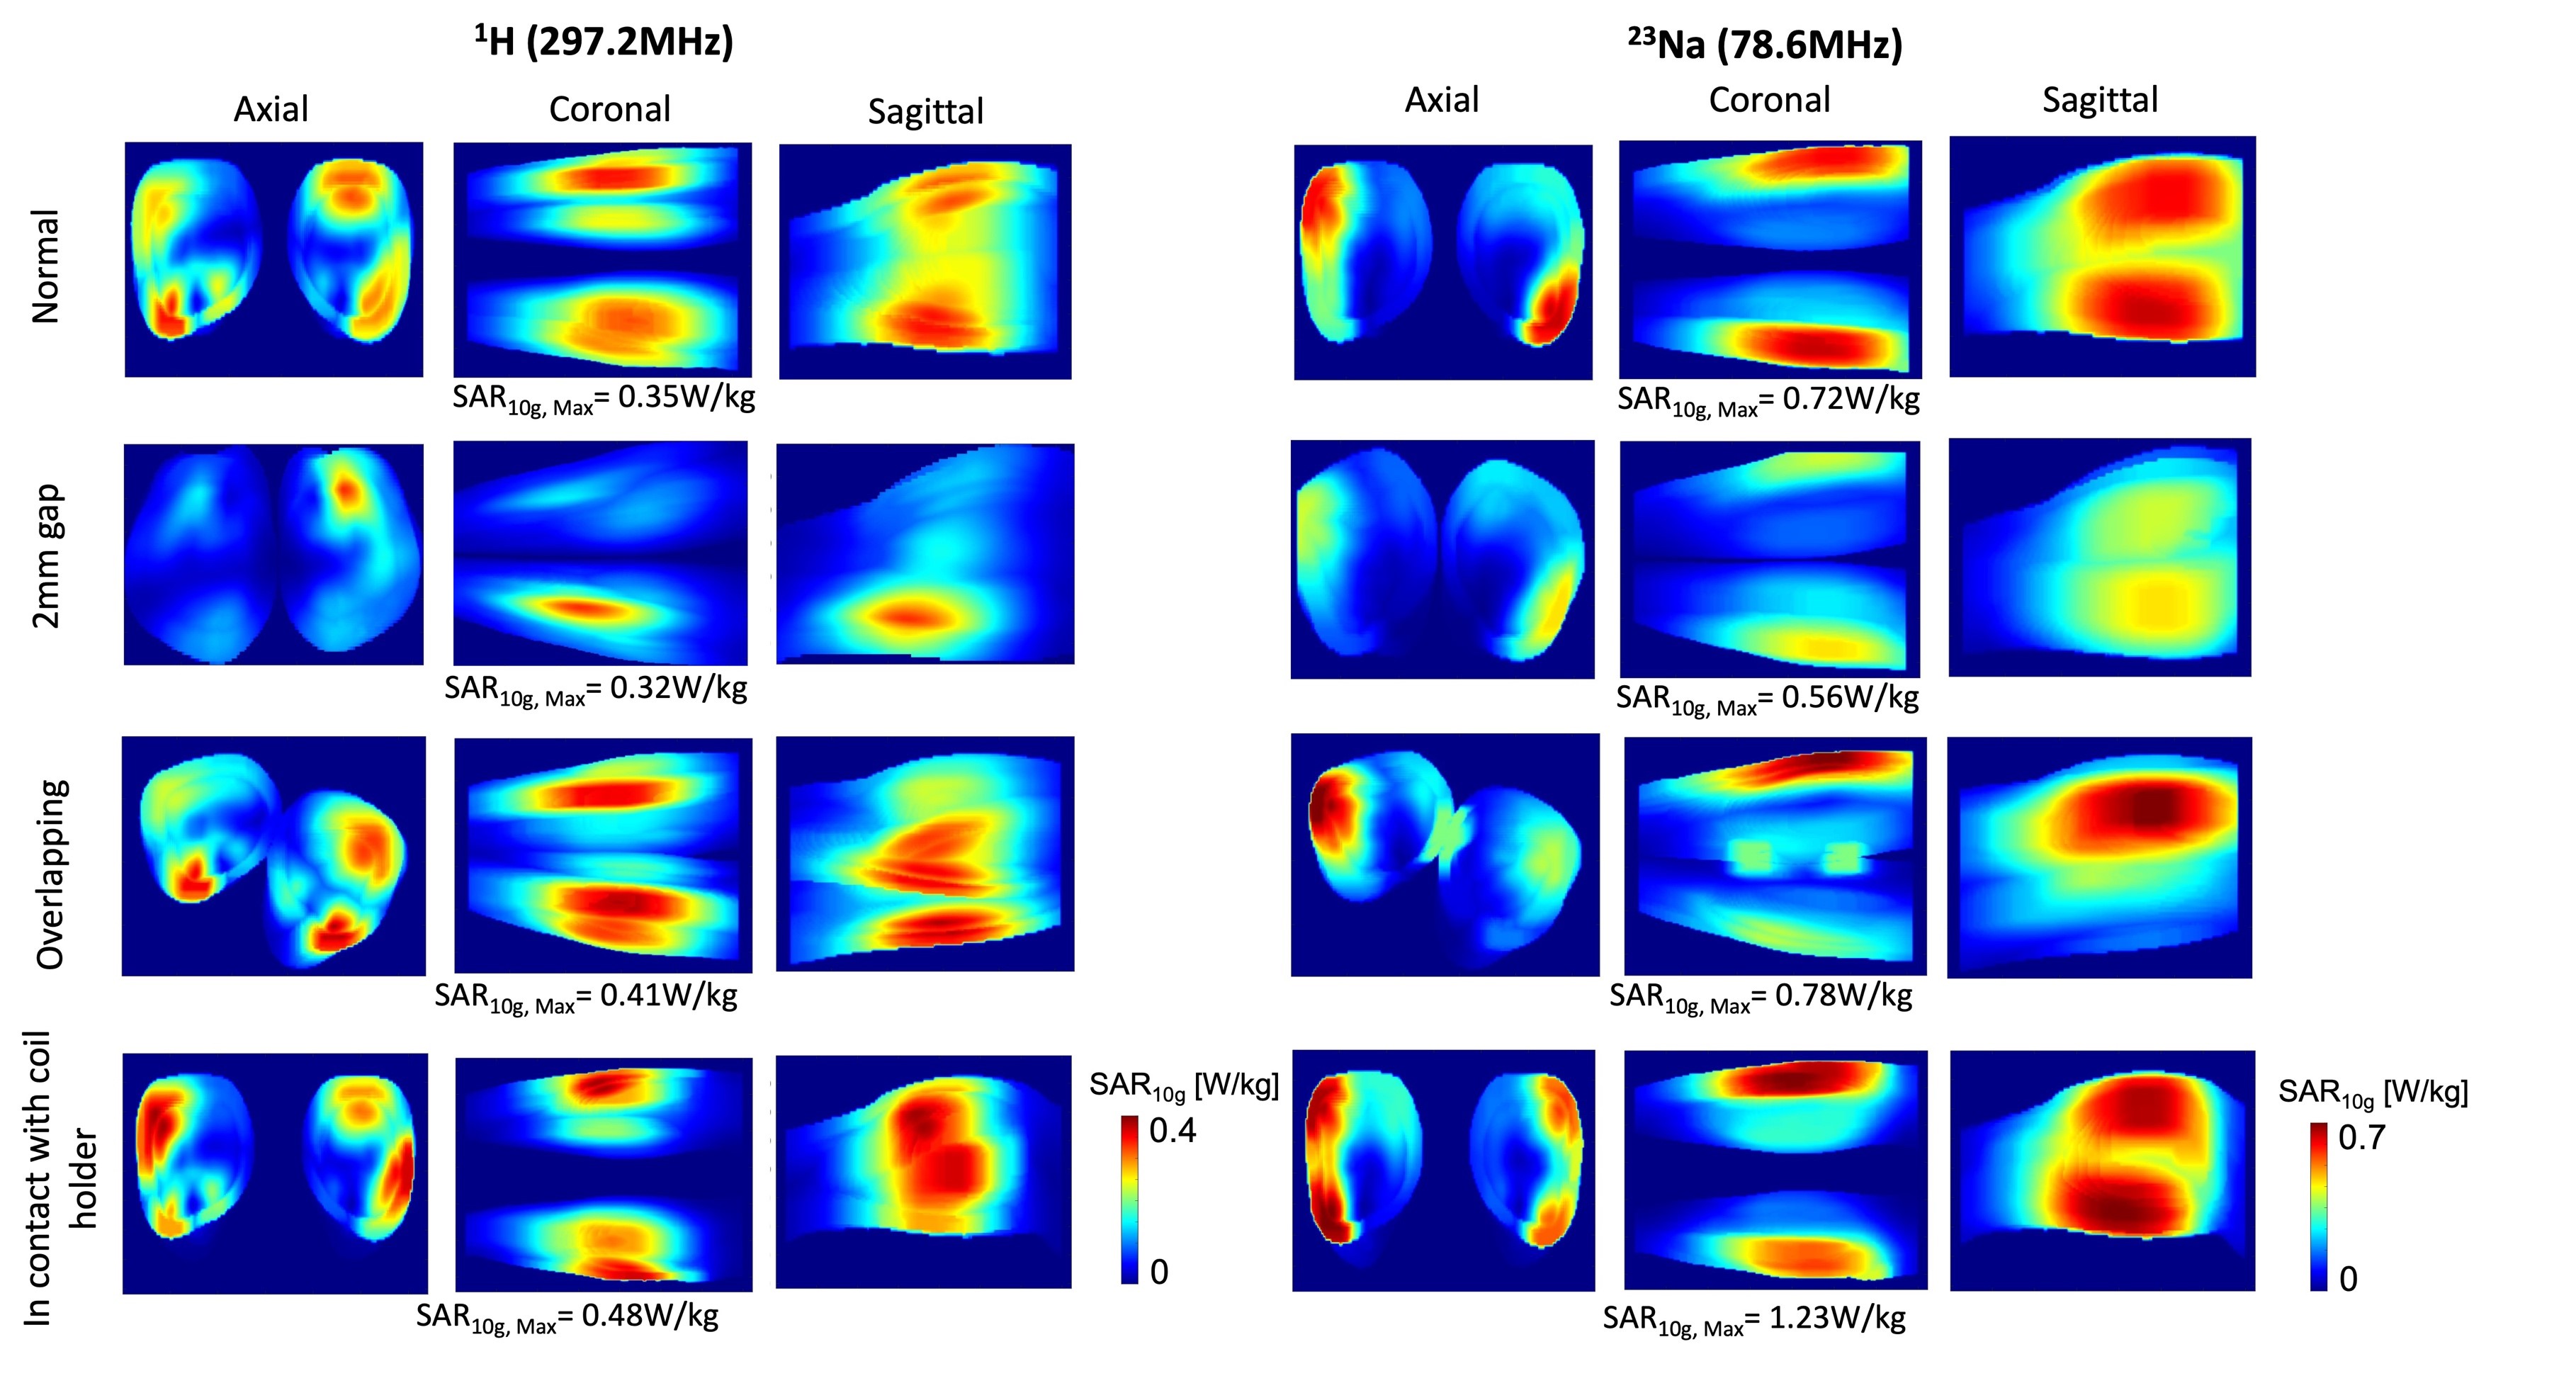
Evaluation of simulated data Simulated individual complex B1+-field maps and electric E-fields were interpolated at 1 mm-isotropic, normalized to 1 W total input power, and exported to Matlab (R2022b, The MathWorks, Natick, MA). Q-matrices were derived from simulated E-field and tissue densities for 10 g-tissue mass-average regions and were used to evaluate SAR levels.6 The worst-case SAR10g was assessed so that each channel is driven at full amplitude, and corresponding maximum intensity projection(MIP) maps were computed in all three orientations. RF phases of individual channels were then optimized to maximize B1+-field while minimizing the overall SAR10g,max value, using a particle-swarm algorithm.(Fig.3) To accelerate the calculations, a set of Virtual Observation Points(VOP) was generated from the Q-matrices, using manufacturer-provided compression software (Siemens Healthcare,Erlangen,Germany) with an overestimation coefficient of 10%.7 Finally, 150k random shims were applied to the VOPs to generate a histogram of all possible maximum SAR10g levels.
Results and Discussion
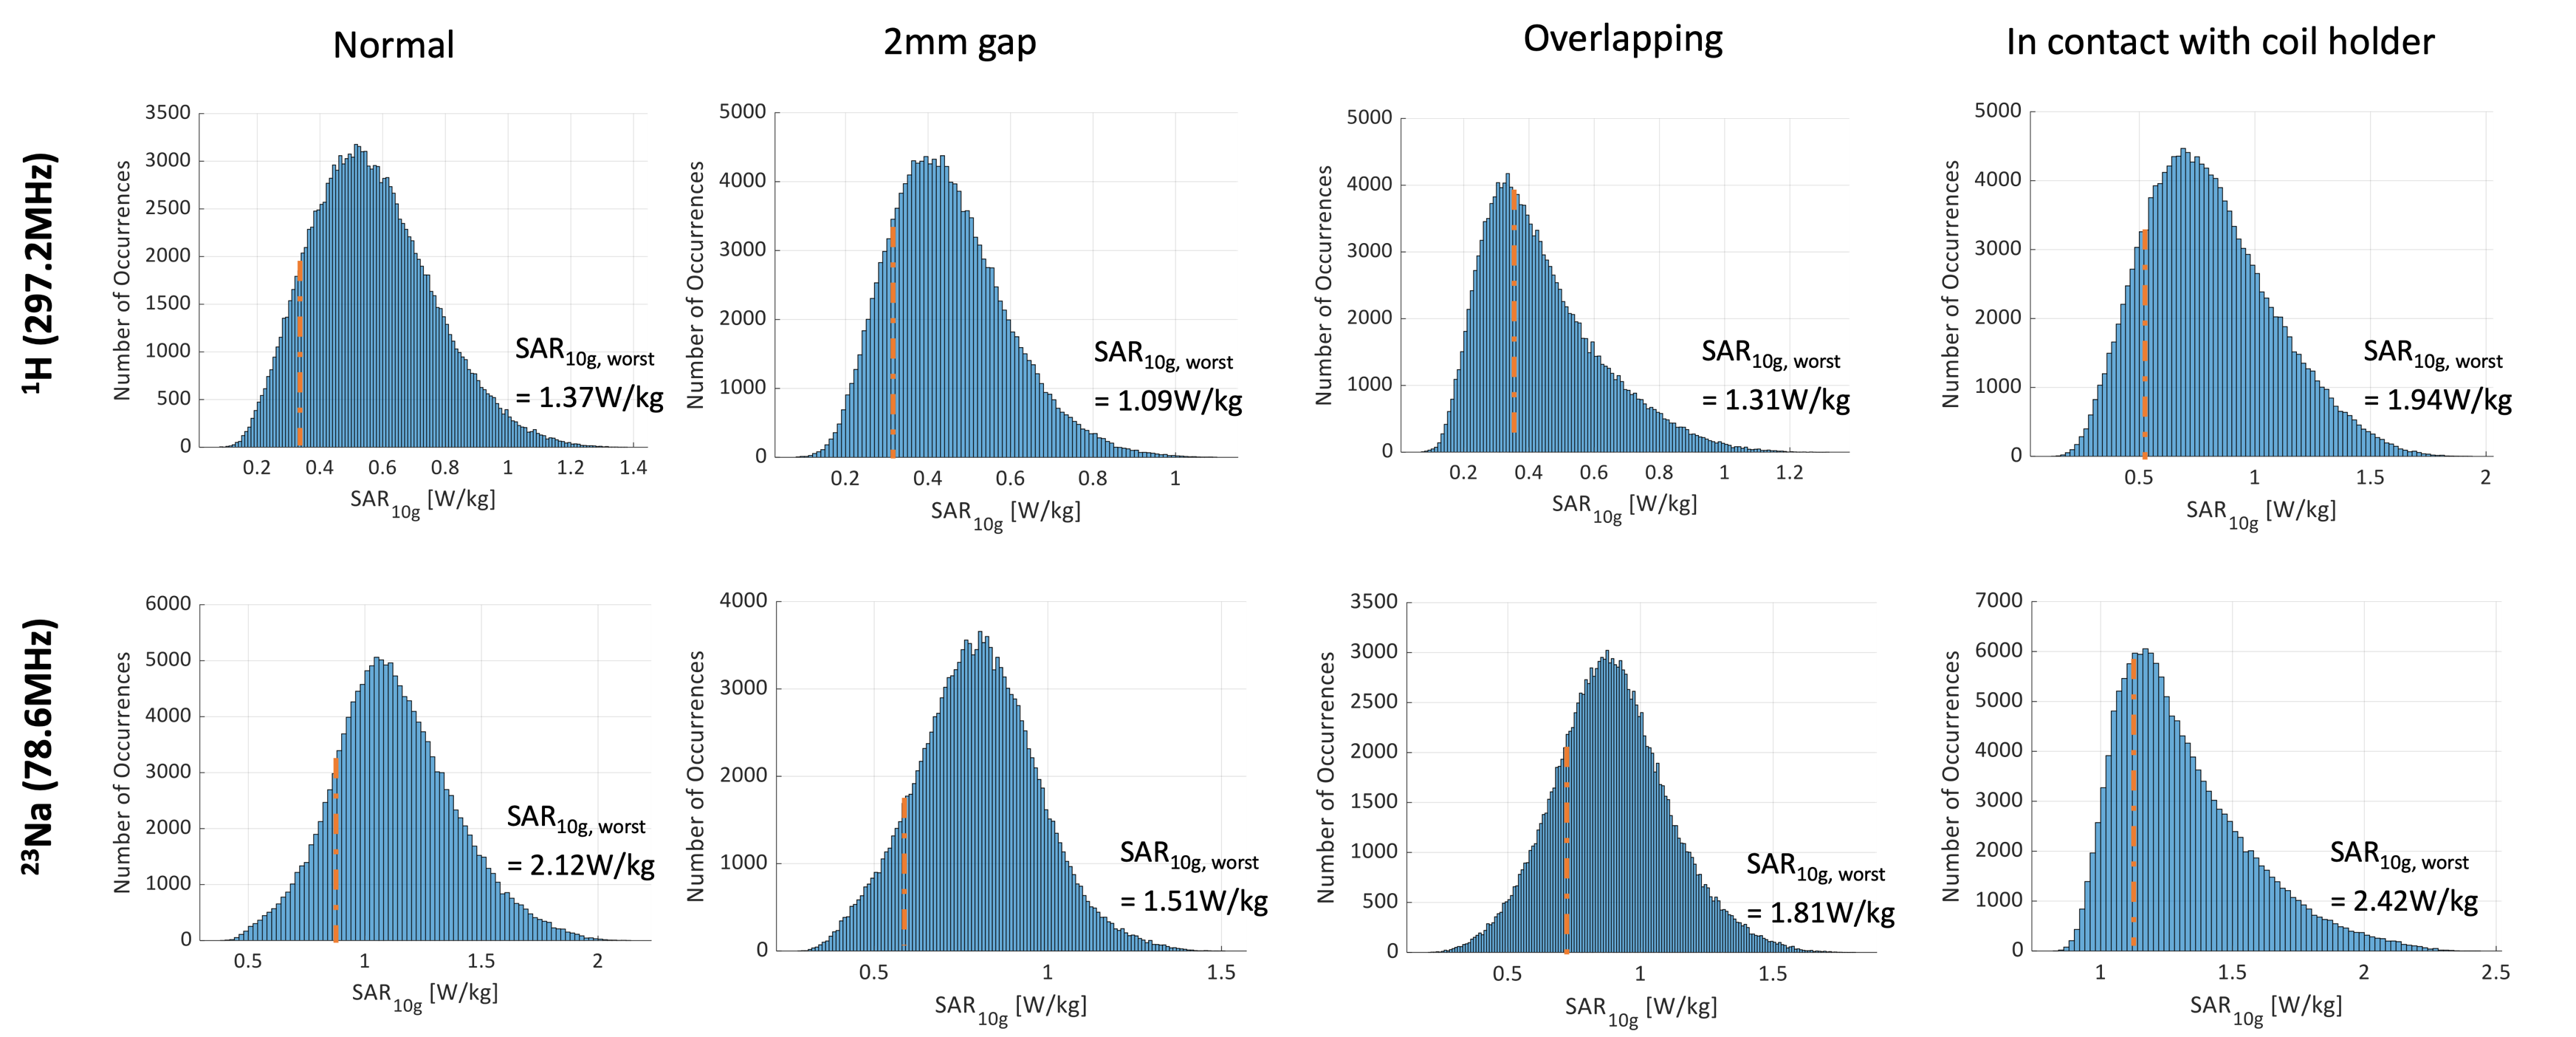
The scattering matrices show a maximum average Sii variance of 1.8% for proton and 2.0% for sodium, with neighbouring channel coupling differences reaching 13% for proton and 10% for sodium, confirming similar power reflections across all configurations. (Fig.2) B1+ field patterns observed in the middle transverse slice aligned for each nucleus in various positions, supporting the array's consistent performance.(Fig.3) The highest SAR10g occurs when both calves contact the coil array, with the second-highest when calves are overlapping, aligning with our initial predictions. The minimum SAR10g is observed with a 2mm separation between calves, attributed to increased distance from the coil array. (Fig.4) A 20% variation in SAR10g is observed for proton, compared to a 48% variation for sodium, likely due to the intrinsic different field patterns between dipole antennas and loop coils. However, the worst-case SAR10g computed with 150k random RF shims all remains within relevant safety limits (i.e.body SAR limit as 10 W/Kg).(Fig.5)Conclusion
The in-house developed 16-channel 1H/23Na MRI coil array demonstrates robust performance across various possible leg positions in electromagnetic simulations. The highest SAR10g levels were observed when calves are in contact with the coil and when calves are overlapping, validating initial expectations regarding RF power absorption. These findings establish the safe RF power limits and support the coil's potential for extremity imaging. Further in-vivo experiments will be carried out to evaluate the coil's application in clinical settings.Acknowledgements
This work was supported by King’s China Scholarship Council, by core funding from the Wellcome/EPSRC Centre for Medical Engineering [WT203148/Z/16/Z] and by the National Institute for Health and Care Research (NIHR) Clinical Research Facility based at Guy’s and St Thomas’ NHS Foundation Trust and King’s College London. JMW acknowledge funding from the NIHR Biomedical Research Centre at The Royal Marsden NHS Foundation Trust and The Institute of Cancer Research, London, and the Royal Marsden Cancer Charity. PJL acknowledges funding from the The Wellcome Trust (220473/Z/20/Z), The Edmond J Safra Foundation, UK Dementia Research Institute, NIHR Imperial Biomedical Research Centre, and National Institutes of Health (R01EB002524). The views expressed are those of the author(s) and not necessarily those of the NHS, the NIHR or the Department of Health and Social Care.References
1. Poku LO, Phil M, Cheng Y, Wang K, Sun X. 23Na‐MRI as a Noninvasive Biomarker for Cancer Diagnosis and Prognosis. J Magn Reson Imaging. 2021 Apr;53(4):995–1014.
2. Zaric O, Juras V, Szomolanyi P, Schreiner M, Raudner M, Giraudo C, et al. Frontiers of Sodium MRI Revisited: From Cartilage to Brain Imaging. J Magn Reson Imaging. 2021;54(1):58–75.
3. Zuo CS, Villafuerte RA, Henry ME, Butman M, Dobbins RL, He Y, et al. Proton and sodium MRI assessment of fluid level in calf tissue. J Magn Reson Imaging. 2006;24(1):191–6.
4. Wu M, Clément J, Vliem J. Proc. Intl. Soc. Mag. Reson. Med. 31. 2023. A 16-Channel Proton/Sodium Transmit/Receive Array Design for 7 Tesla Head Imaging.
5. Gosselin MC, Neufeld E, Moser H, Huber E, Farcito S, Gerber L, et al. Development of a new generation of high-resolution anatomical models for medical device evaluation: the Virtual Population 3.0. Phys Med Biol. 2014 Aug;59(18):5287.
6. Ipek Ö, Raaijmakers AJ, Lagendijk JJ, Luijten PR, van den Berg CAT. Intersubject local SAR variation for 7T prostate MR imaging with an eight-channel single-side adapted dipole antenna array. Magn Reson Med. 2014;71(4):1559–67.
7. Clément J, Tomi-Tricot R, Malik SJ, Webb A, Hajnal JV, Ipek Ö. Towards an integrated neonatal brain and cardiac examination capability at 7 T: electromagnetic field simulations and early phantom experiments using an 8-channel dipole array. Magma N Y N. 2022;35(5):765–78.
Figures