0467
Assessment of the Inter-Subject Variability of Peak Local Specific Absorption Rate for a Head Coil at 10.5T1Center for Magnetic Resonance Research (CMRR), University of Minnesota, Minneapolis, MN, United States, 2Department of Electrical and Electronics Engineering, Bilkent University, Ankara, Turkey
Synopsis
Keywords: Safety, Safety
Motivation: The safety factor, which scales SAR matrices used in real-time SAR monitoring, is commonly dominated by inter-subject variability. However, the contributions from various sources to that variability have not been fully evaluated.
Goal(s): Assess the impact of different human model variations and different patient positions inside the coil, on the predicted peak local SAR for 10.5T head applications.
Approach: The SAR inter-subject variability was investigated via EM simulations of two human models along with a wide variety of head positions inside an 8-channel coil at 10.5T.
Results: The variability between head models was significantly more consequential than variations in a head model’s position.
Impact: Simulating realistic scenarios with wide appropriate variables, to calculate SAR with a more accurate inter-subject variability on peak local SAR, has the potential to improve patient safety without compromising the scanning quality at ultrahigh field MRI.
Introduction
Ultrahigh field (UHF, defined as ≥7T) MRI offers the opportunity for higher spatiotemporal resolution due to the promise of increased signal-to-noise ratio1-3 (SNR). However, the higher proton resonance frequency at UHF requires more RF power and results in inhomogeneous power deposition within tissues, resulting in local heating concerns.According to International guidelines4, the safety risk can be mitigated by limiting the peak 10g-averaged local specific absorption rate (pSAR10g), which is commonly calculated using EM simulations with realistic human models. However, simulation results can show variations for different human models and patient positions. Recent studies5-7 have shown that single human model simulations with a fixed position are less representative of real scenarios. They can lead to underestimating the peak localized SAR significantly when there are discrepancies in positioning or if the patient moves. On the other hand, simulations with a variety of human models in all possible patient positions are more indicative. However, they might be unrealistic as they overestimate risks.
In this work, we investigate the impact of realistically-possible different head positions inside an 8-channel head coil8 on pSAR10g at 10.5T. In addition, we comprehensively assess the inter-subject variability of SAR for two different head models and their positions inside the coil.
Methods
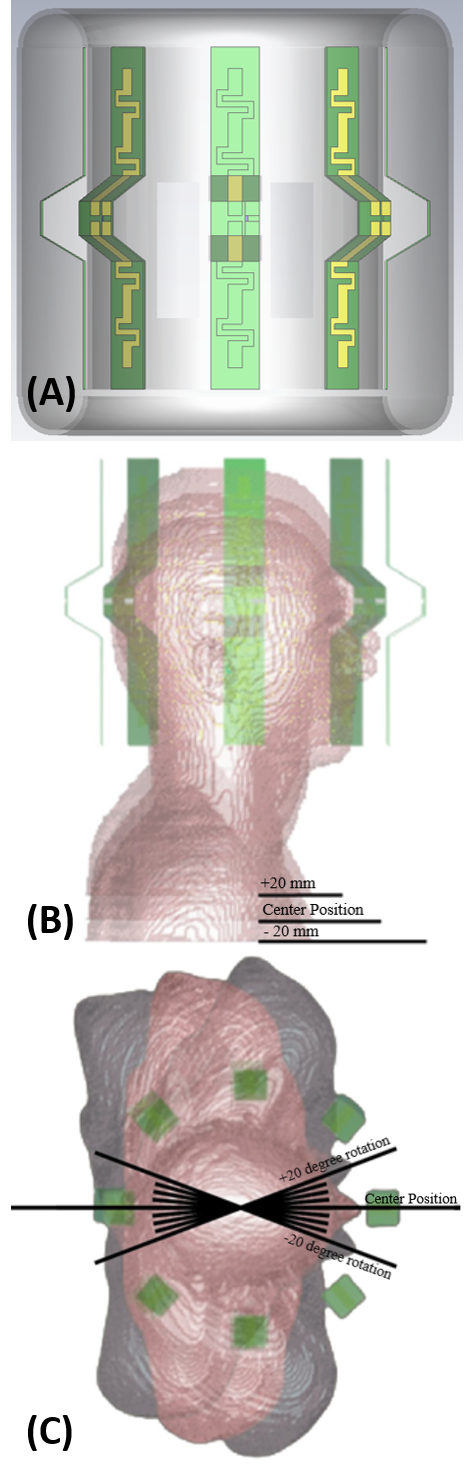
As shown in Figure 1, the human body models Duke and Ella9 (Virtual Population) were placed inside an 8-channel RF transmit/receive (Tx/Rx) bumped dipole array head coil8 in the EM simulation environment (CST Studio). The simulations were performed for combinations of 5 positions (superior-inferior displacement from -20mm to +20mm, with intervals of 10mm; Figure 1B), 9 various degrees of the rotations (with respect to the superior-inferior axis from -20° to 20°, with intervals of 5°; Figure 1C) for each human model (Duke and Ella).In the scope of the different scenarios, 90 simulations were performed. Spatial SAR matrices10 (Q-matrices), which were averaged over 10 grams of tissue, were exported from the EM simulations. Since the local SAR is excitation-dependent, 105 random RF excitation vectors were created and incorporated with the Q-matrices to calculate pSAR10g values for all scenarios, including model variations, different head positions, and different excitation vectors. The Duke model positioned at the center of the coil was taken as the reference model to calculate the relative pSAR10g variations of all model variations and positions. Eventually, the histograms of relative pSAR10g variations were plotted to investigate the impact of superior-inferior translation, rotation, and model variation on the pSAR10g prediction. In each case, the 99th percentile of the histogram was used to determine inter-subject variability.
Results
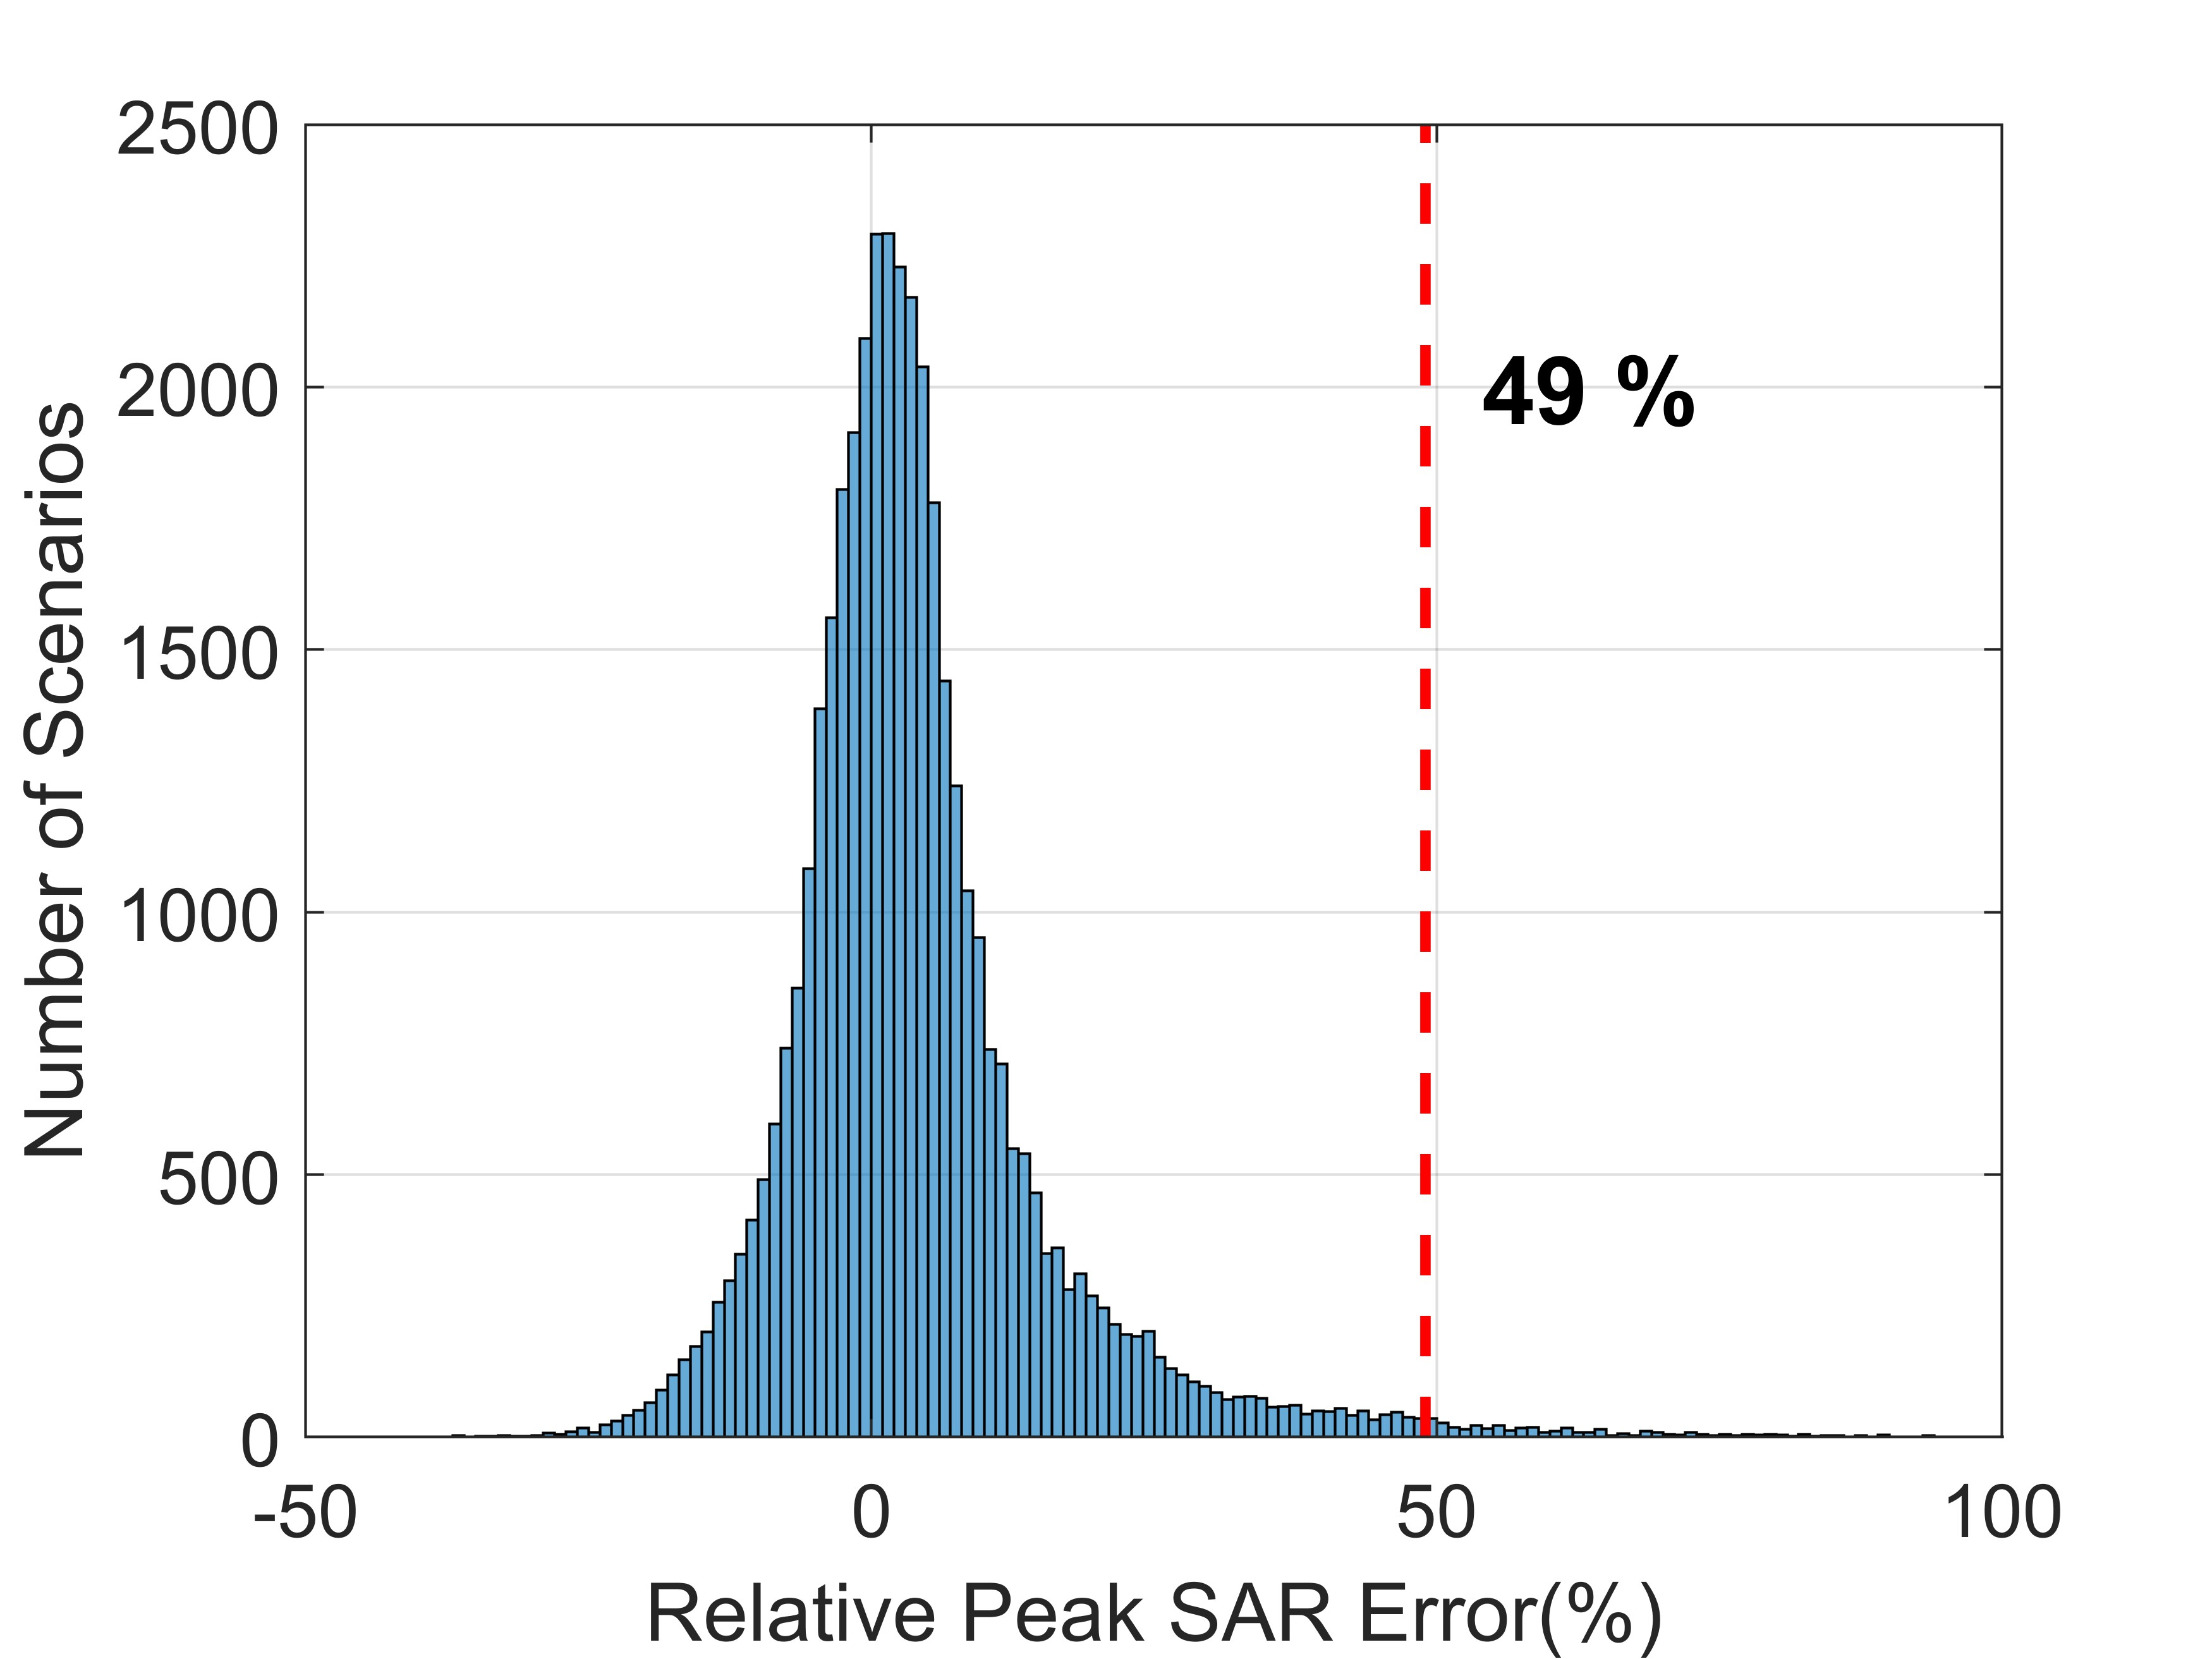
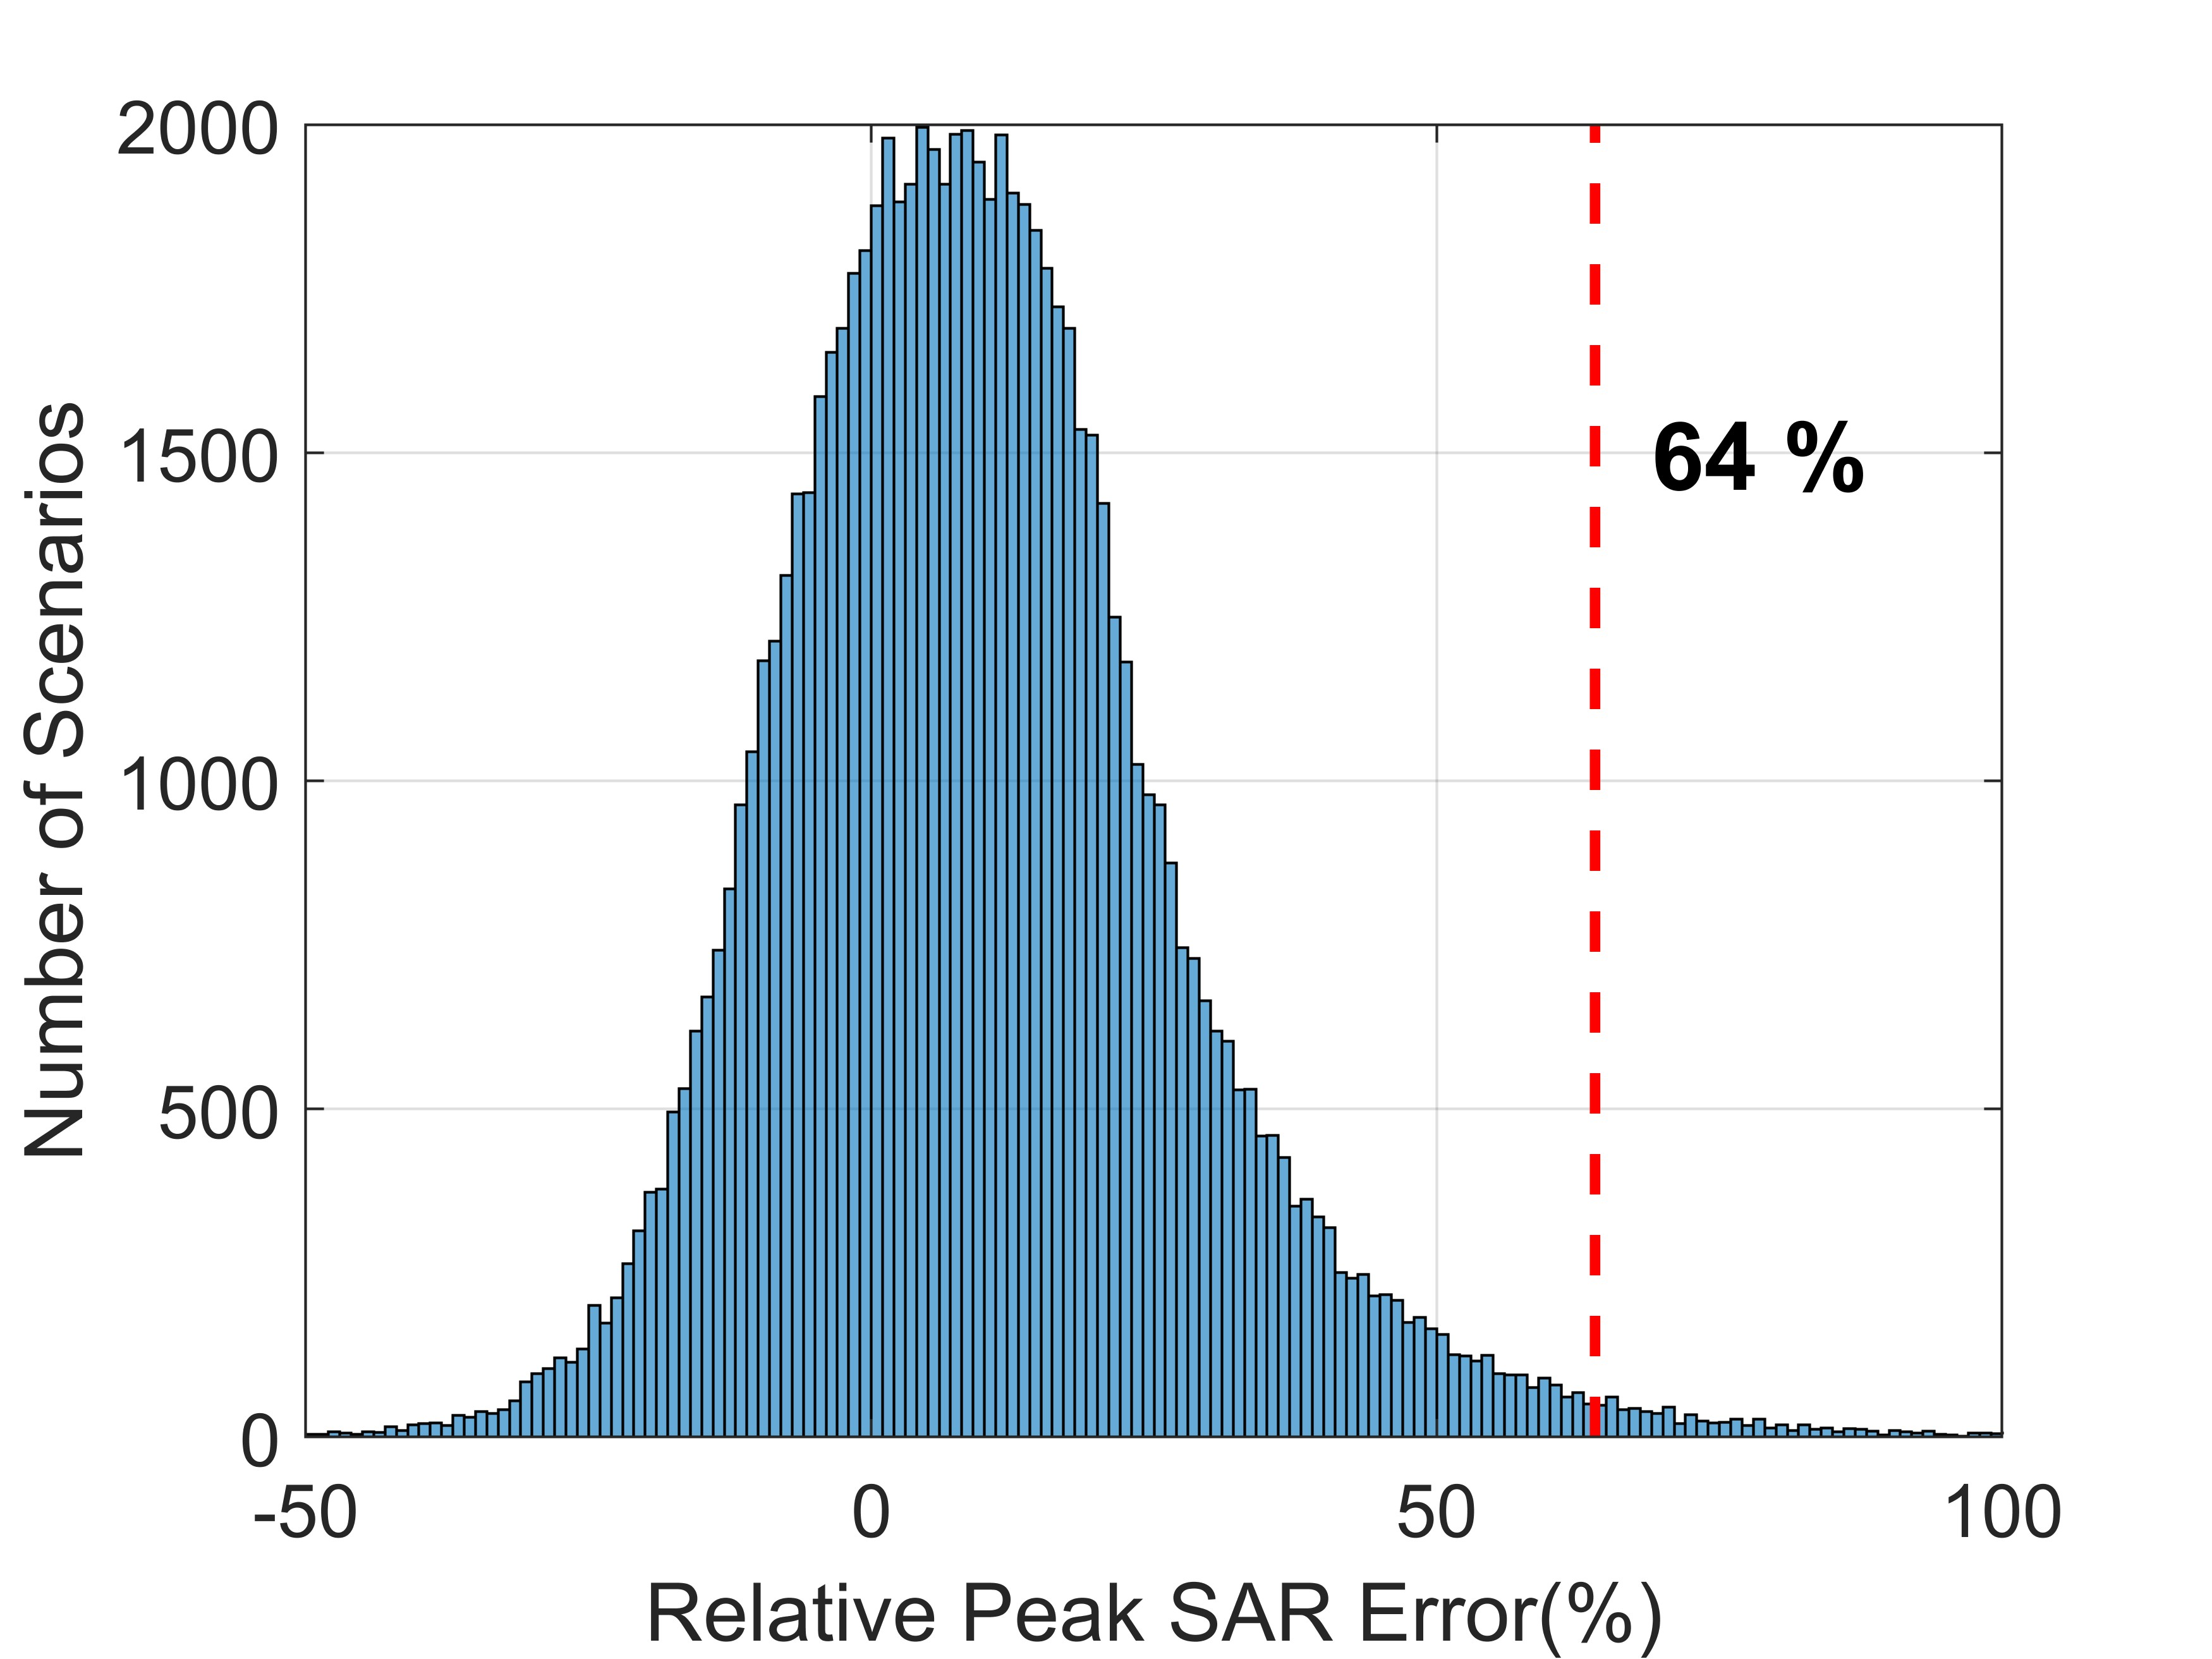
Figures 2-5 all show the histogram of relative pSAR10g variations. Figure 2 shows variations due to the superior-inferior translation (see also Figure 1B) of the Duke model.Figure 3 shows variations due to the rotation (see also Figure 1C) of the Duke model.
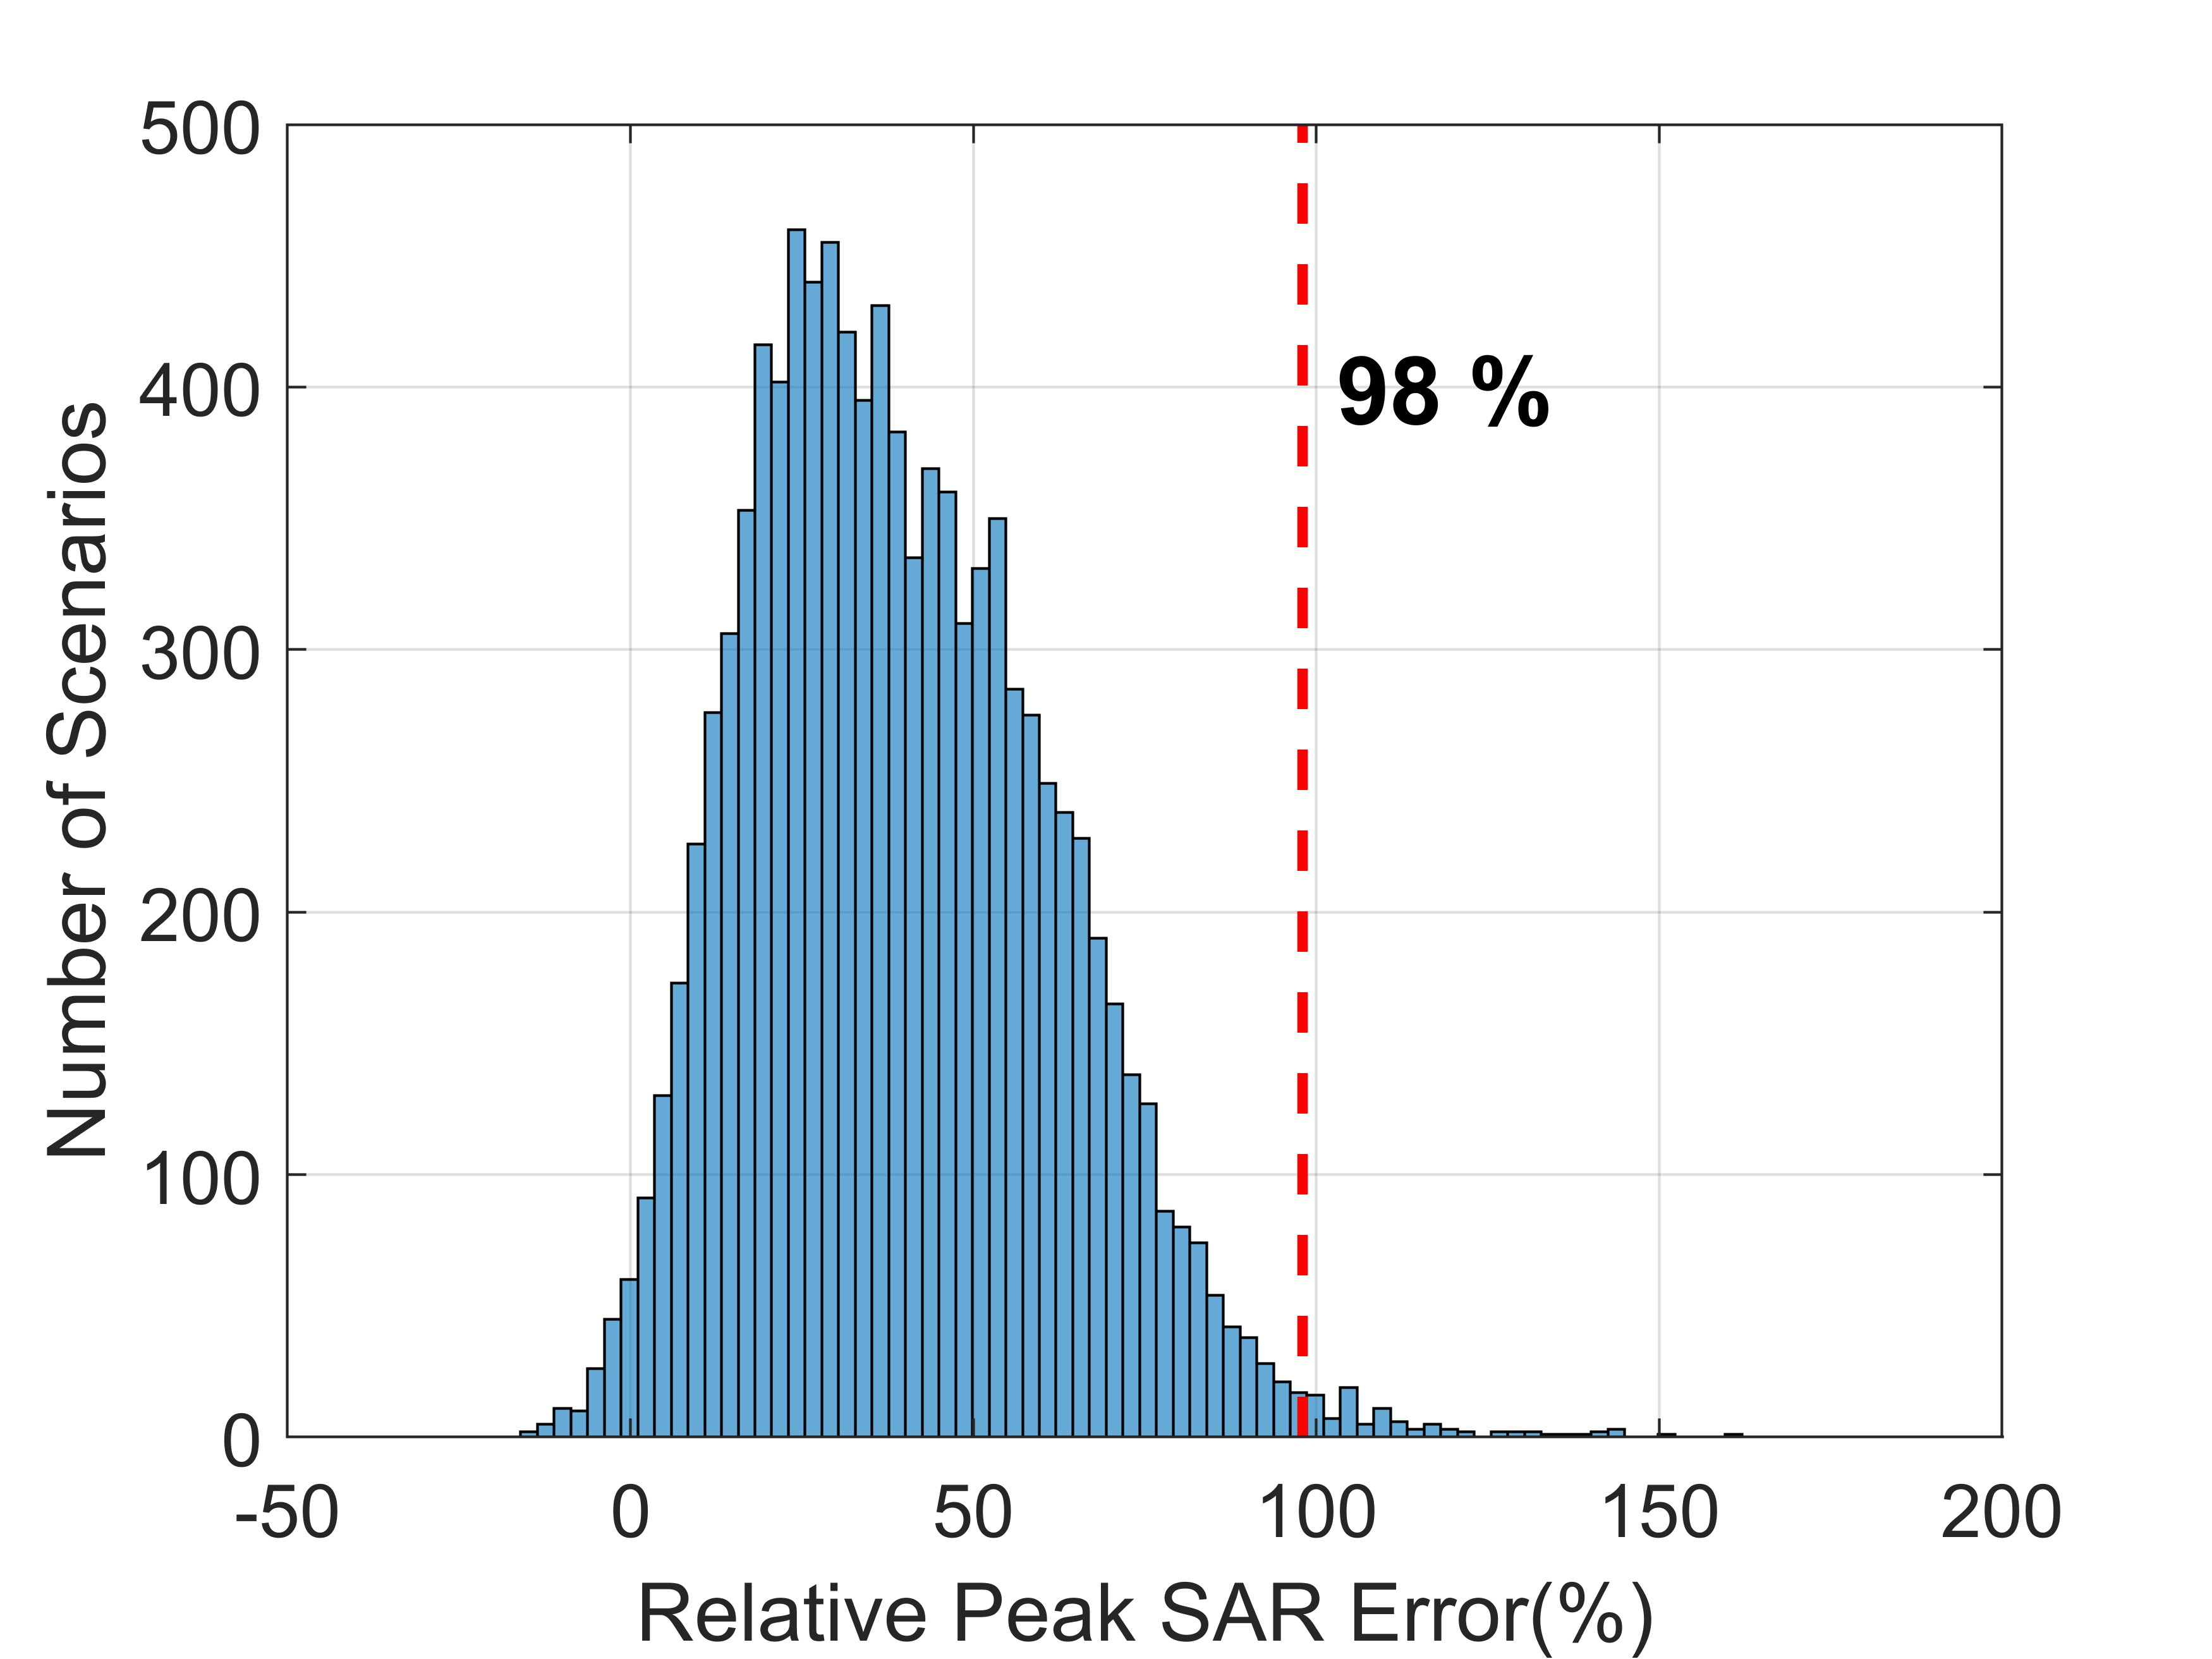
Figure 4 shows variations when replacing the Duke model with the Ella model.
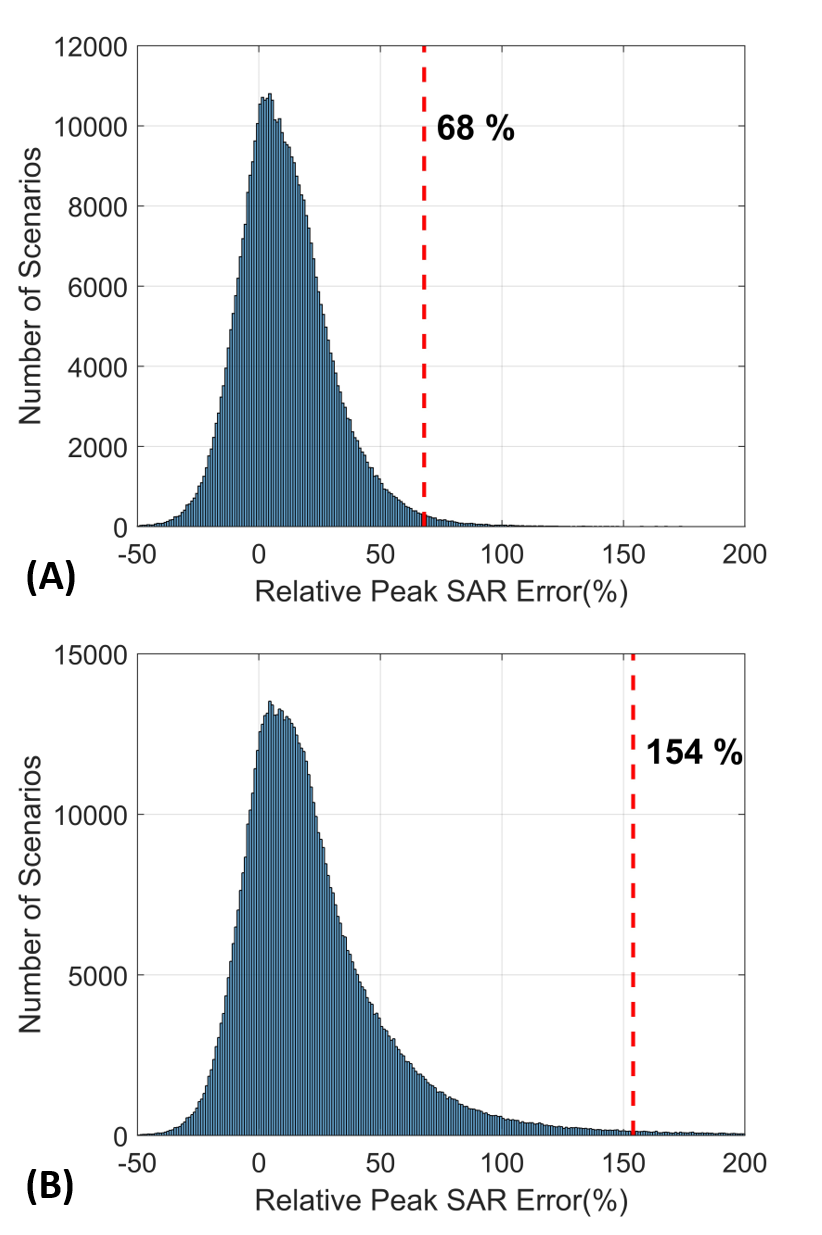
Figure 5A is a demonstration of the pSAR10g variations due to all combinations of Duke’s different positions inside the coil, whereas Figure 5B is the result of the addition of all of Ella’s different positions to Figure 5A’s scenarios.
Discussions and Conclusion
In this work, we comprehensively investigated the impact of different variables such as different positions of a patient’s head inside the coil, as well as the use of different models, on calculating the SAR inter-subject variability.According to our numerical results, the variations in pSAR10g prediction for 105 different excitation vectors using the Duke model centered in a head coil at 10.5T can be as high as ~70% due to different positions of the head inside the coil. However, replacing the Duke model with the Ella model (both centered inside the coil without further movements) can raise the variation in pSAR10g prediction up to ~100%. Incorporating different head positions into the Ella model can increase the variation margin up to ~150%. These outcomes demonstrate that performing inter-subject variability calculations using a single human model can lead to an underestimation of the patient safety risk, while the inclusion of all possible variations (i.e., variations in model and position) can be overly conservative.
Generating an inclusive SAR matrix database using a variety of human head models and utilizing them based on the subject’s head size/shape can potentially address this issue. A similar idea based on the utilization of different inter-subject variabilities for different parts of the body was previously proposed11 for body imaging applications at 10.5T. In our future studies, the impact of different head models on the SAR inter-subject variability will be investigated in detail using more head models.
Acknowledgements
This work was supported by the following grants: NIH P41 EB027061, NIH R01 NS115180, and NIH U01 EB025144.References
1. Vaughan JT, Garwood M, Collins CM, Liu W, DelaBarre L, Adriany G, Andersen P, Merkle H, Goebel R, Smith MB. 7T vs. 4T: RF power, homogeneity, and signal‐to‐noise comparison in head images. Magnetic Resonance in Medicine: An Official Journal of the International Society for Magnetic Resonance in Medicine. 2001;46(1):24-30.
2. Pohmann R, Speck O, Scheffler K. Signal‐to‐noise ratio and MR tissue parameters in human brain imaging at 3, 7, and 9.4 tesla using current receive coil arrays. Magnetic resonance in medicine. 2016;75(2):801-9.
3. Ocali O, Atalar E. Ultimate intrinsic signal‐to‐noise ratio in MRI. Magnetic resonance in medicine. 1998;39(3):462-73.
4. International Electrotechnical Commission. IEC 60601-2-33-Edition 4.0: Medical Electrical Equipment—Particular Requirements for the basic safety and essential performance of magnetic resonance equipment for medical diagnosis. 2022.
5. de Greef M, Ipek O, Raaijmakers AJ, Crezee J, van den Berg CA. Specific absorption rate intersubject variability in 7T parallel transmit MRI of the head. Magnetic Resonance in Medicine. 2013 May;69(5):1476-85.
6. Le Garrec M, Gras V, Hang MF, Ferrand G, Luong M, Boulant N. Probabilistic analysis of the specific absorption rate intersubject variability safety factor in parallel transmission MRI. Magnetic resonance in medicine. 2017 Sep;78(3):1217-23.
7. Kopanoglu E. Actual patient position versus safety models: Specific Absorption Rate implications of initial head position for Ultrahigh Field Magnetic Resonance Imaging. NMR in Biomedicine. 2023 May;36(5):e4876.
8. Sadeghi‐Tarakameh A, DelaBarre L, Lagore RL, Torrado‐Carvajal A, Wu X, Grant A, Adriany G, Metzger GJ, Van de Moortele PF, Ugurbil K, Atalar E. In vivo human head MRI at 10.5 T: A radiofrequency safety study and preliminary imaging results. Magnetic resonance in medicine. 2020 Jul;84(1):484-96.
9. Christ, A., Kainz, W., Hahn, E. G., Honegger, K., Zefferer, M., Neufeld, E., Rascher, W., Janka, R., Bautz, W., Chen, J., Kiefer, B., Schmitt, P., Hollenbach, H. P., Shen, J., Oberle, M., Szczerba, D., Kam, A., Guag, J. W., & Kuster, N. (2010). The Virtual Family--development of surface-based anatomical models of two adults and two children for dosimetric simulations. Physics in medicine and biology, 55(2), N23–N38. https://doi.org/10.1088/0031-9155/55/2/N01
10. Eichfelder G, Gebhardt M. Local specific absorption rate control for parallel transmission by virtual observation points. Magnetic resonance in medicine. 2011 Nov;66(5):1468-76.
11. Schmidt S, Ertürk MA, He X, Haluptzok T, Eryaman Y, Metzger GJ. Improved 1H body imaging at 10.5 T: Validation and VOP‐enabled imaging in vivo with a 16‐channel transceiver dipole array. Magnetic Resonance in Medicine. 2023 Sep 13.
Figures