0459
Feasibility of 3D Visualization and 3D Catheter Tracking for Enhanced MRI-Guidance of Cardiac Catheterization1King's College London, London, United Kingdom, 2MR Research Collaborations, Siemens Healthcare Limited, Camberley, United Kingdom, 3Guy's and St Thomas' NHS Foundation Trust, London, United Kingdom
Synopsis
Keywords: MR-Guided Interventions, Cardiovascular
Motivation: MRI-guidance of cardiac catheterisation is currently performed using one or multiple 2D imaging planes, which may be suboptimal for catheter navigation in congenital heart disease patients with complex anatomies.
Goal(s): To develop a robust real-time 3D catheter tracking method and 3D visualisation strategy for improved MRI-guidance of cardiac catheterisation procedures.
Approach: Fast 3D screening through projection imaging combined with advanced post-processing strategies were developed for real-time 3D catheter tracking and enhanced 3D visualisation. The method was evaluated in patients.
Results: This approach was demonstrated in three patients and was able to successfully track and visualise the catheter in 3D.
Impact: Our approach show promise for enhanced catheter navigation and visualisation during MRI-guided cardiac catheterization and may contribute to reduce procedural time and outcome.
Background
Magnetic Resonance Imaging (MRI) has emerged as a promising alternative to X-ray fluoroscopy for guiding cardiac catheterization procedures in patients with congenital heart diseases [1, 2]. Currently, Gadolinium-filled balloon catheters are used and imaged using fixed 2D slices. However, during navigation, the catheter can go out-of-plane, necessitating manual repositioning of the imaging plane. The combination of 3D visualization and real-time catheter tip tracking may provide additional value, especially for cases involving complex anatomies. This study sought to evaluate the feasibility of combined 3D tracking and visualization of the catheter.Methods
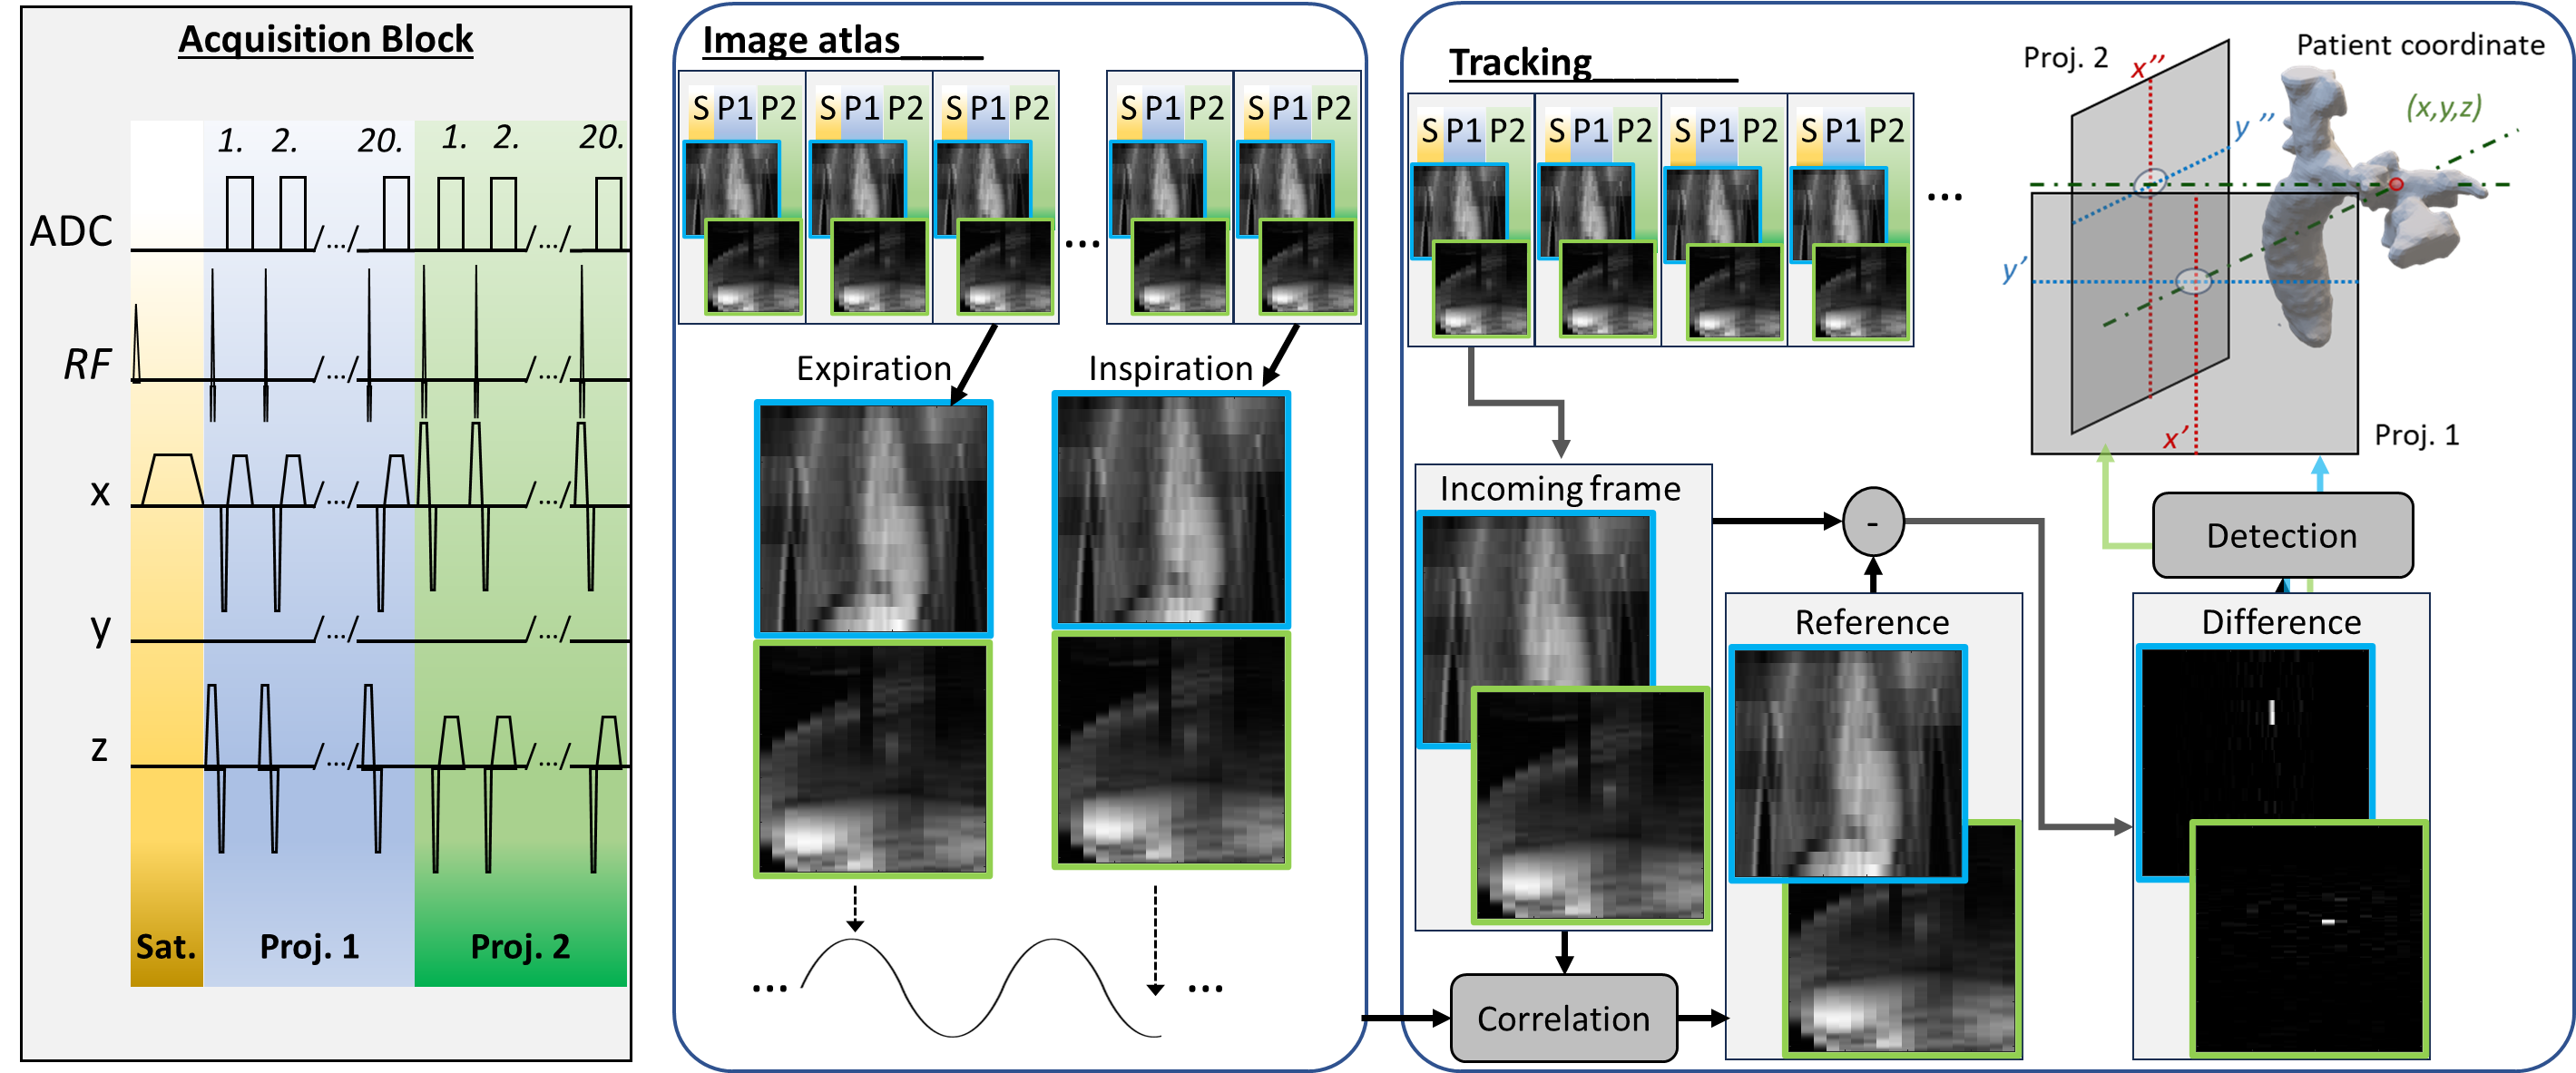
A fast 3D tracking technique was developed using the acquisition of two orthogonal 2D projection images. Each projection corresponds to a gradient echo stack of slices with only the central k-space lines being collected for each slice. To enhance catheter contrast, a saturation pulse is added ahead of the projection pair. An offline image processing algorithm was developed to identify the 2D coordinates of the balloon in each projection image, allowing the generation of 3D coordinates from a pair of 2D coordinates. The schematic visualization of the process is shown on Fig. 1. Post-processing includes background signal suppression achieved using an atlas of background 2D projection images. These are acquired before catheter manipulation, spanning multiple breathing cycles. During catheter navigation, incoming 2D projection images are paired with their closest match from the atlas (maximum corelation), and background suppression is applied through image subtraction. Finally, a peak detection algorithm is employed to identify the catheter balloon signal. The technique was tested in three patients undergoing MRI-guided cardiac catheterization (Tab. 1). Imaging was conducted on a 1.5T MR scanner (Magnetom Aera, Siemens, Erlangen, Germany). The interventionist was asked to displace the catheter after an initial training period of ~45s used for atlas creation. The utility of lipid suppression was assessed in one case (Tab. 1 A) using the two-point Dixon technique [3]. Retrospective 3D visualization was performed using an in-house developed software, incorporating 3D anatomic scan acquired in each subject and 3D balloon coordinates from the proposed approach. The coordinate extraction success rate was calculated with the success counted if an extracted coordinate matched with position on projections and when no-coordinate was extracted with no catheter balloon visible on projections.Results
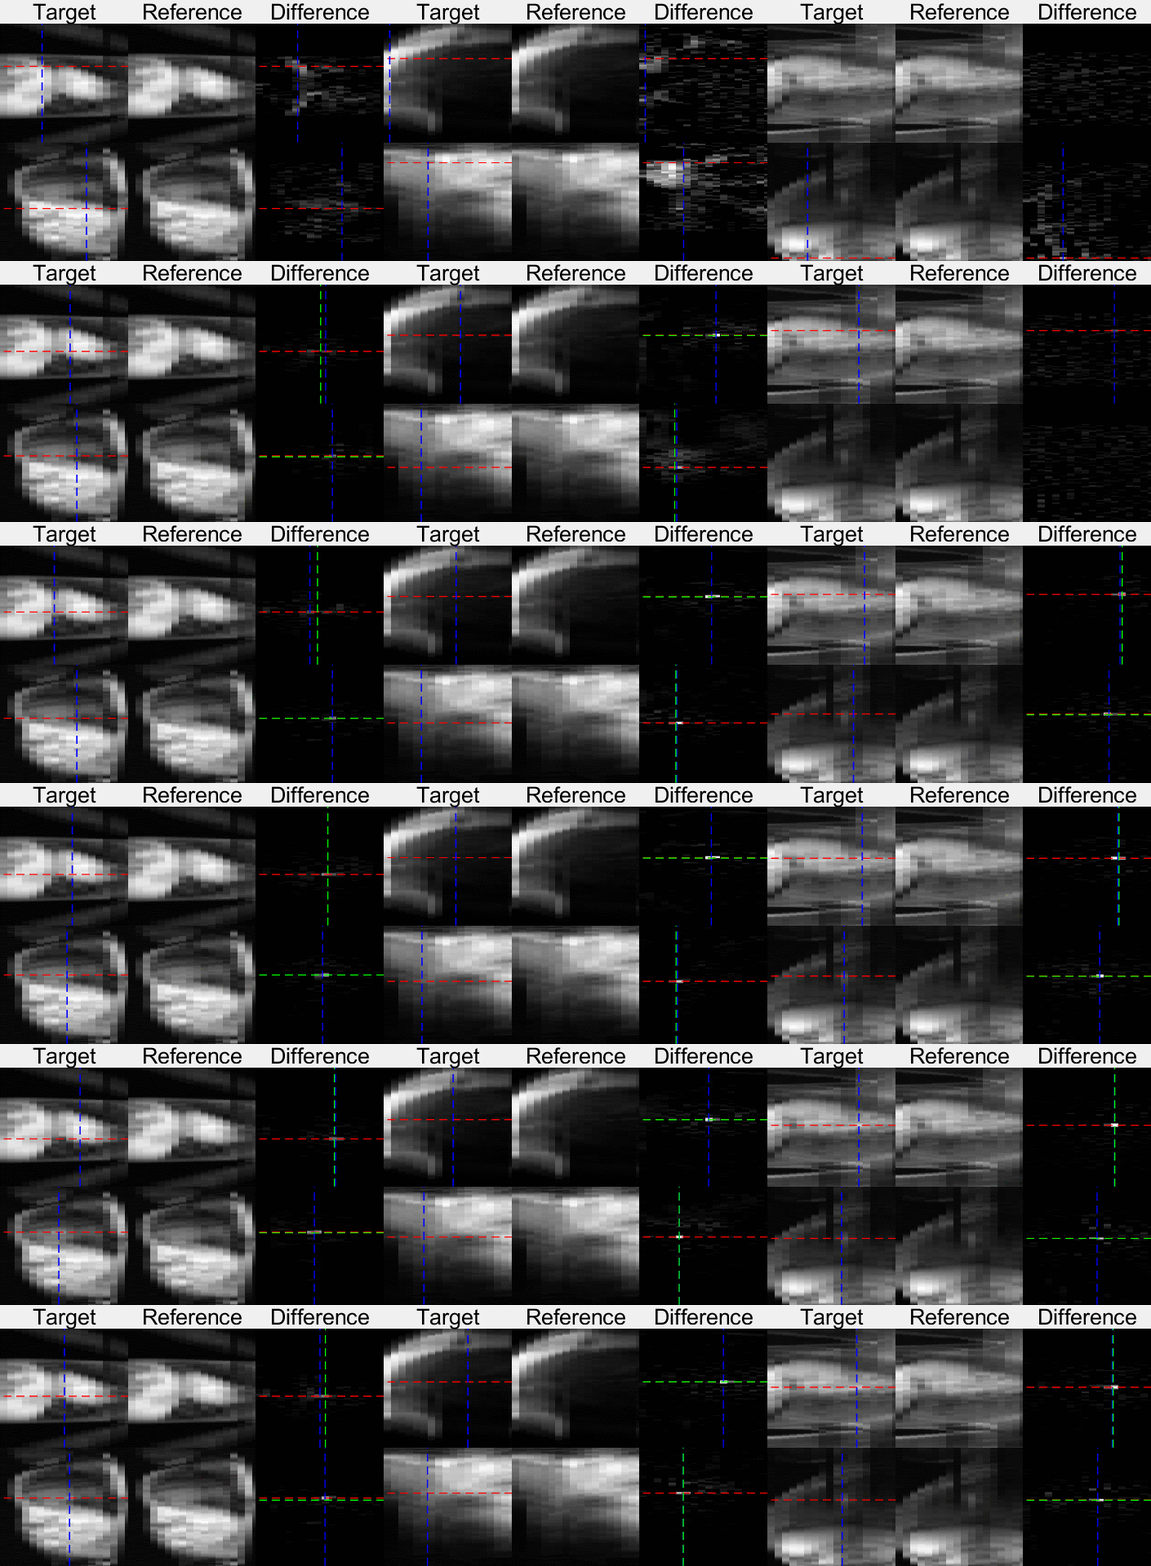
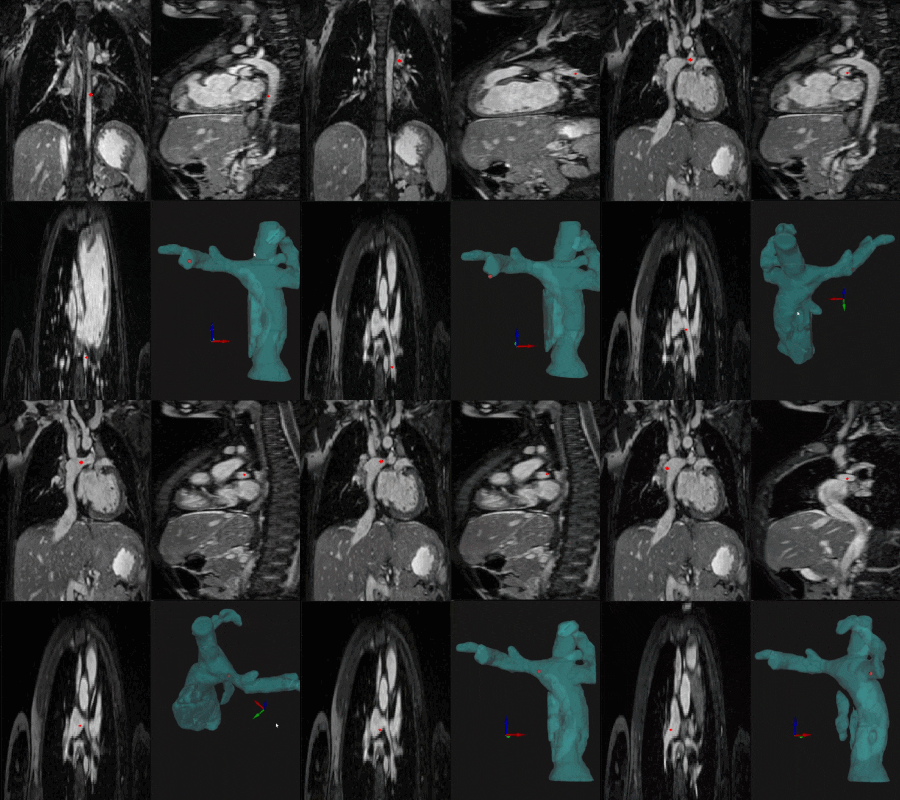
The extraction of catheter balloon 3D coordinates was successful in all cases. 2D projection frame rate in Case A was almost two times lower as compared to non-lipid suppressed cases B, C (Tab. 1). Case C had a substantially higher spatial resolution to accommodate a younger, smaller patient, which resulted in slight reduction in the temporal resolution. The tracking process on the acquired 2D projection pairs (~45s) is shown on Fig. 2. During the tracking period the interventionalist moved continuously the balloon catheter tip: A) from IVC to right atrium, then to IVC, then right atrium and then right ventricle; B) from superior portion of the Fontan lateral tunnel to the IVC; C) from the distal left pulmonary artery to the extracardiac Fontan tunnel. In case A a less-smooth ‘jittery’ motion of the tracked object can be observed. Case B exhibits dominant high intensity lipid signal (no-lipid suppression). However, there is no observable deterioration in the tracking algorithm performance in cases B and C. The time laps capture from the visualization software for case C are shown on Fig. 3. Starting from the displacement from the initial balloon position the coordinate extraction success rate was 96.4%, 97.9%, 97.6% for case A, B, C respectively.Discussion
The results of this study highlight the efficacy of the proposed 3D visualization and catheter tracking technique in MRI-guided cardiac catheterization. Additionally, the study explored the utility of lipid signal suppression. This technique is essential for improving image quality in some MRI applications; however, our findings suggest limited utility in the context of catheter tracking. The use of lipid suppression resulted in a two-fold reduction in frame rate, impacting real-time visualization.Conclusion
The proposed approach shows promise for fast 3D catheter tracking and 3D visualization of the catheter during MRI-guided cardiac catheterisation. Online implementation of the post-processing and visualisation strategy and the evaluation of this technique in a larger patient population are now warranted.Acknowledgements
No acknowledgement found.References
1. Razavi, R., et al., Cardiac catheterisation guided by MRI in children and adults with congenital heart disease. Lancet, 2003. 362(9399): p. 1877-82. 2. Rogers, T., et al., CMR fluoroscopy right heart catheterization for cardiac output and pulmonary vascular resistance: results in 102 patients. J Cardiovasc Magn Reson, 2017. 19(1): p. 54. 3. Dixon, W.T., Simple proton spectroscopic imaging. Radiology, 1984. 153(1): p. 189-94.Figures