0453
Using Ventilation and Perfusion MRI at a 0.35 T MR-Linac to Predict Radiation-Induced Pneumonitis in Lung Cancer Patients1Department of Radiology, LMU University Hospital, LMU Munich, Munich, Germany, 2Comprehensive Pneumology Center (CPC-M), Member of the German Center for Lung Research (DZL), Munich, Germany, 3Department of Radiation Oncology, LMU University Hospital, LMU Munich, Munich, Germany, 4Munich Center for Machine Learning (MCML), Munich, Germany, 5Department of Statistics, LMU Munich, Munich, Germany, 6German Cancer Consortium (DKTK), partner site Munich, a partnership between DKFZ and LMU University Hospital Munich, Munich, Germany, 7Bavarian Cancer Research Center (BZKF), Munich, Germany
Synopsis
Keywords: MR-Guided Radiotherapy, Data Analysis, low-field, MR-Linac, ventilation, perfusion, functional imaging
Motivation: Early predictors of radiation-induced pneumonitis in patients receiving MR-guided radiotherapy allowing a closer follow up and taking early countermeasures to avoid a severe disease progression have not yet been identified.
Goal(s): We aimed at finding functional MR-based biomarkers acquired during treatment that allows the prediction of radiation-induced pneumonitis (RP) for lung cancer patients directly after MR-guided radiotherapy.
Approach: For 19 patients, ventilation- and perfusion-maps were acquired using a non-contrast enhanced free-breathing technique and investigated in different regions of the irradiated lung.
Results: Changes over treatment in the ventilation around the tumor significantly separate between RP and non-RP group.
Impact: The acquisition of additional functional lung imaging during MR-guided radiotherapy requires little effort while offering the opportunity to identify lung cancer patients at risk of developing radiation-induced pneumonitis right after treatment and to take early countermeasures to avoid severe complications.
Introduction
Hybrid devices combining radiotherapy and MR-imaging, called MR-Linacs, have opened up possibilities in terms of precise tumor tracking, dose delivery, adaptive treatment planning and recently non-contrast enhanced functional lung imaging [1]. However, one possible complication of radiotherapy delivered to lung cancer patients is radiation-induced pneumonitis (RP) that is usually diagnosed in CT-scans 2-3 months after treatment. Even though clinical parameters such as the volume of the lung receiving more than 20 Gy (Vol20), mean lung dose (MLD) or functional parameters based on perfusion derived from SPECT [3] and ventilation calculated from 4D-CT [4] have been considered for RP prediction in conventional radiotherapy, there have been no studies so far investigating predictive qualities of clinical and especially functional imaging parameters in MR-guided radiotherapy. We therefore aim at demonstrating the potential of Non-uniform Fourier Decomposition-based (NuFD) ventilation (V) and perfusion (Q) extracted over the course of treatment to serve as predictors for the occurrence of RP 2-3 months after end of treatment.Methods
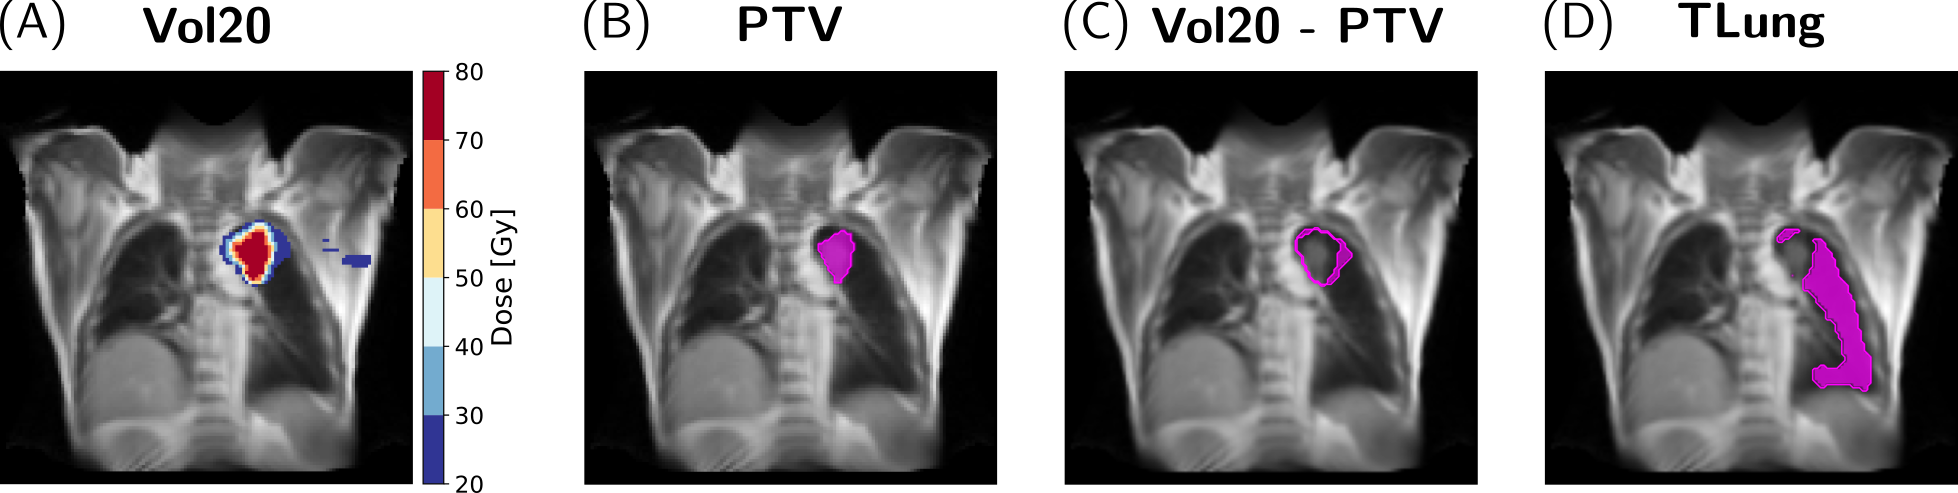
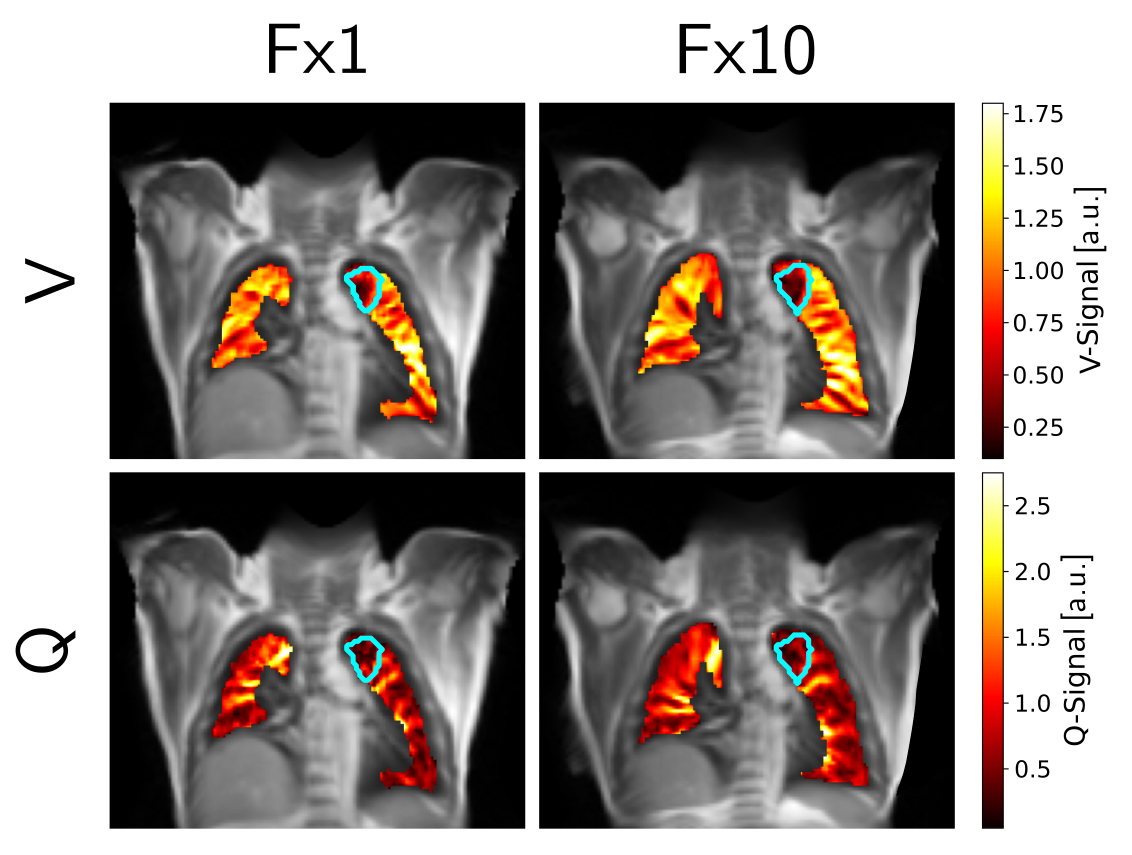
19 patients (11 female, 8 male) received hypofractionated Stereotactic Body Radiotherapy (SBRT) at a 0.35 T MR-Linac (MRIdian, ViewRay Inc., Cleveland, Ohio) in 3-10 fractions (Fx). In CT-scans performed 2-3 months after SBRT, radiological signs, such as ground-glass opacities and consolidation in the tumor region indicating RP were observed for 11 patients.Over the treatment course of each patient, additional 2D coronal cine-image series (240 images in about 1 min) were acquired in free-breathing at the tumor position using an optimized balanced steady-state free precession (bSSFP) sequence with the following parameters: flip angle=70°, TR/TE=2.42/1.02 ms, FOV=500×500×20 mm3, matrix=128×128, frame rate=3.68 images/s. After deformable registration and segmentation of the image series, the lung signal was filtered into signals corresponding to ventilation and perfusion. Ventilation- and perfusion-weighted maps were generated from the peak-value in the respective Fourier spectrum that was calculated pixel-wise using the non-uniform Fast Fourier Transform. To overlay the planned dose and target volumes onto the V- and Q-maps, first the 3D MR-scans of each Fx were rigidly registered to the baseline planning scan using Plastimatch, then a slice corresponding to the NuFD image series was found in each registered Fx-scan. Each image series was then deformably registered to this slice and the deformation fields were applied to the V- and Q-maps. The mean ventilation and perfusion values were calculated for each Fx in three different regions (Figure 1) of the V- and Q-maps, namely the planning target volume (PTV), the Vol20 without the PTV and the whole tumor bearing lung without PTV (TLung) and normalized to the respective mean in the non-tumor bearing lung. The relative difference of the last Fx with respect to the first Fx in ventilation and perfusion (example in Figure 2) was calculated for each region and patient. Univariate analysis was performed for six functional parameters and two common clinical parameters (Vol20 and MLD) based on Receiver Operating Characteristic Curve (ROC) analysis and the corresponding Area Under the Curve (AUC) using radiological findings in the CT-scan after 2-3 months indicating RP as endpoint. Median AUC values and the 95% confidence intervals were calculated using 5000 bootstrapping samples. The non-parametric Mann-Whitney U test (α=0.05) was used to probe a potential significant difference between the RP and non-RP group using the considered parameters.
Results
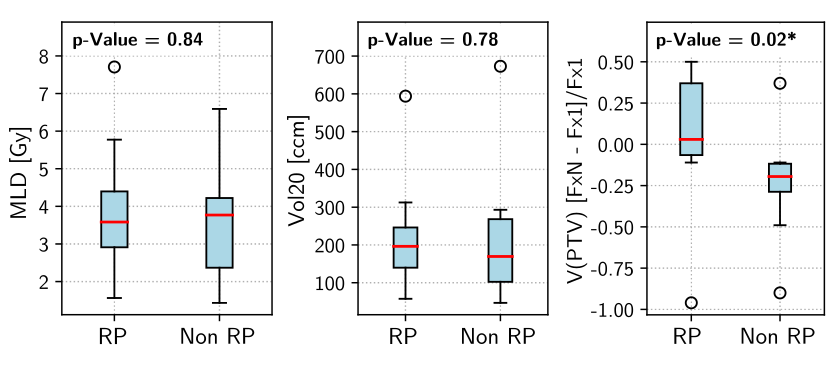
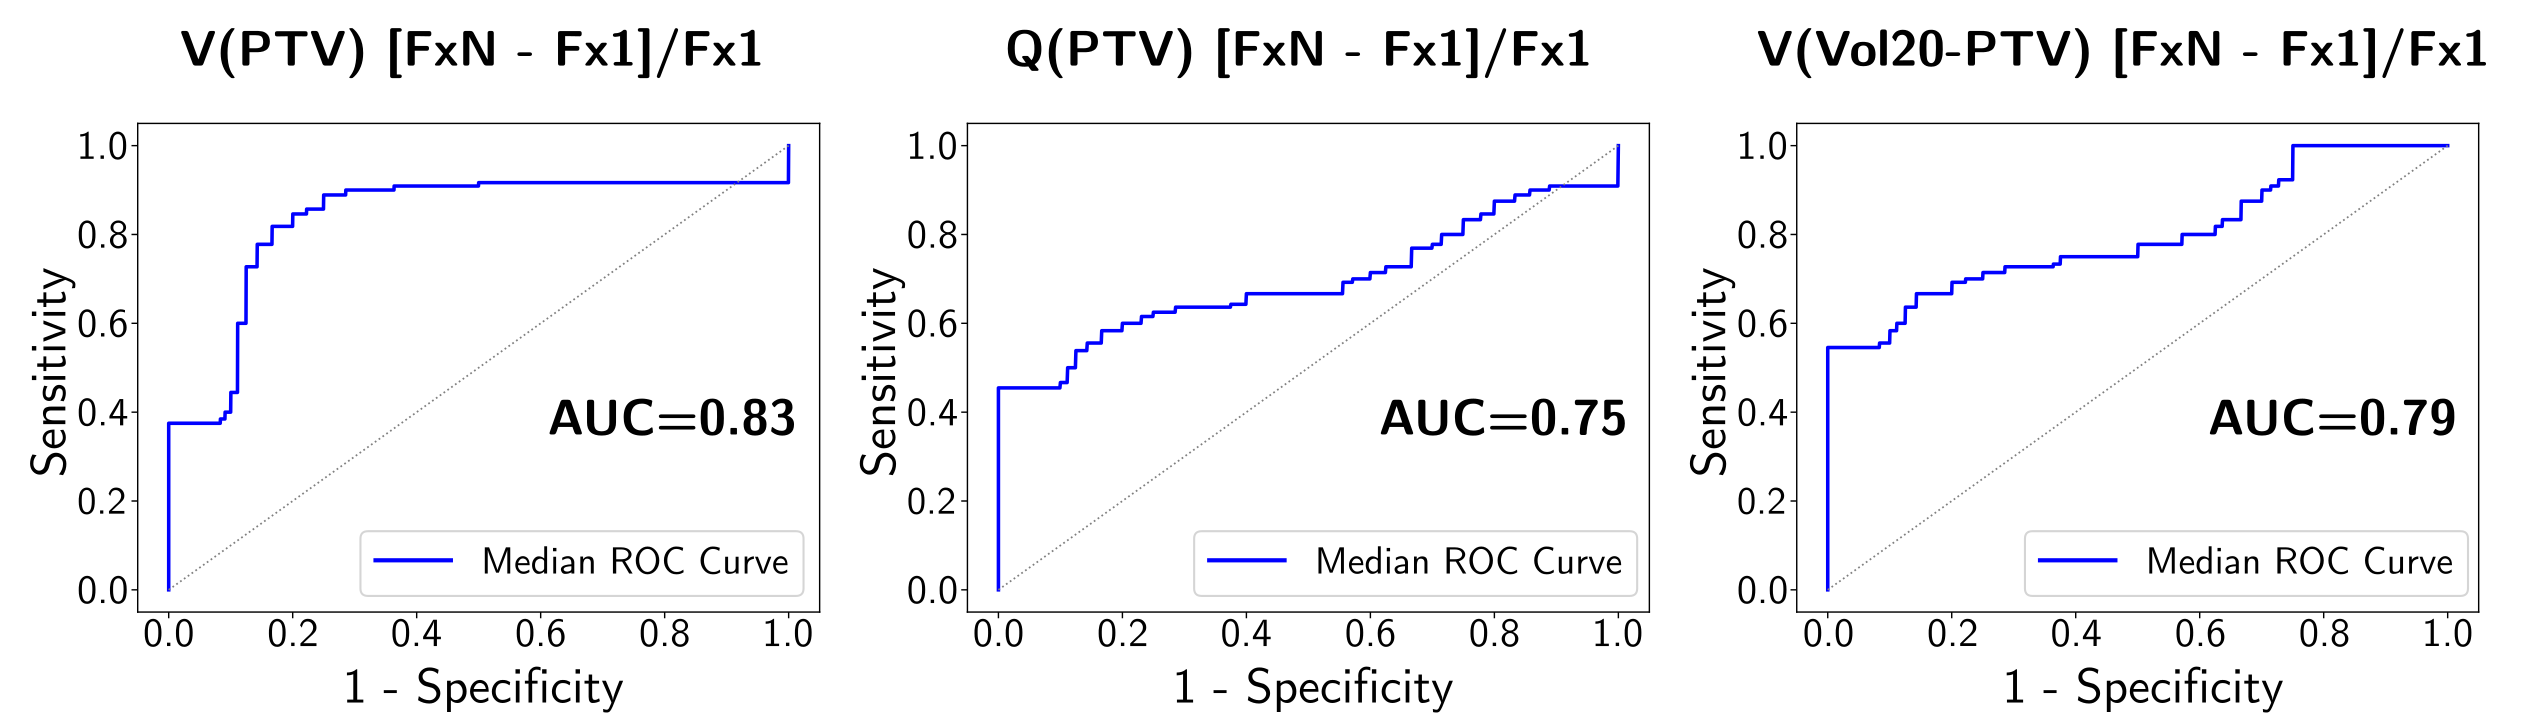
Comparing the RP and non-RP group distributions for the six functional and the two clinical parameters (Figure 3), the functional parameters and especially V (p=0.05) and Q in the Vol20 without PTV region (0.09) and V in the PTV (0.02), respectively, achieved good separation. Vol20 (p=0.78), MLD (0.84), V (0.44) and Q in TLung (0.31) and Q in the PTV (0.21) showed no trends between the two groups. The results of the univariate ROC-AUC analysis (Table 1, Figure 4) support this finding with the best median AUC-values of 0.83, 0.79 and 0.75 for FxN-Fx1 of V in PTV and V and Q in Vol20 without PTV, respectively, whereas Vol20 and MLD performed worse with AUC=0.60 for both.Discussion
Despite the small patient cohort, ventilation- and perfusion-based parameters extracted from the high-dose region in the lung using a fast, radiation dose-free, non-contrast enhanced free-breathing technique showed great potential to serve as early predictors for RP in lung cancer patients receiving radiotherapy at a 0.35 T MR-Linac right after treatment.Conclusion
Integrated in the clinical routine, our proposed functional imaging workflow with short acquisition times and no additional equipment could help to identify patients at risk that could benefit from taking early countermeasures. Currently, data from a validation cohort is being collected.Acknowledgements
No acknowledgement found.References
- Klaar R, Rabe M, Gaass T, et al. Ventilation and perfusion MRI at a 0.35 T MR-Linac: feasibility and reproducibility study. Radiat Oncol. 2023;18(1):58.
- Käsmann L, Dietrich A, Staab-Weijnitz CA, et al. Radiation-induced lung toxicity - cellular and molecular mechanisms of pathogenesis, management, and literature review. Radiat Oncol. 2020;15(1):214.
- Farr KP, Kallehauge JF, Møller DS, et al. Inclusion of functional information from perfusion SPECT improves predictive value of dose-volume parameters in lung toxicity outcome after radiotherapy for non-small cell lung cancer: A prospective study. Radiother Oncol. 2015;117(1):9-16.
- Vinogradskiy Y, Castillo R, Castillo E, et al. Use of 4-dimensional computed tomography-based ventilation imaging to correlate lung dose and function with clinical outcomes. Int J Radiat Oncol Biol Phys. 2013;86(2):366-371.
Figures