0445
Comparing APT-weighted MTRasym and LD-mapping for personalized radiotherapy target delineation of glioblastoma: A prospective pilot study.1Brain Tumor Center, Erasmus MC Cancer Institute, University Medical Center Rotterdam, Rotterdam, Netherlands, 2Department of Radiology & Nuclear medicine, Erasmus MC, University Medical Center Rotterdam, Rotterdam, Netherlands, 3Department of Radiotherapy, Erasmus MC Cancer Institute, University Medical Center Rotterdam, Rotterdam, Netherlands, 4Medical Delta, Delft, Netherlands
Synopsis
Keywords: CEST / APT / NOE, Brain, Glioblastoma
Motivation: Microscopic tumor infiltration in glioblastoma cannot be depicted on conventional MRI. Therefore, the clinical target volume (CTV) for radiotherapy consists of the gross tumor volume (GTV) plus a 15-mm safety margin. This large expansion increases the risk of radiation-induced side-effects.
Goal(s): To explore the potential of APTw-CEST MRI for improved GTV delineation, ultimately enabling a CTV-margin reduction.
Approach: Radiotherapy planning MRI-acquisition included an APTw-CEST MRI-sequence. GTVs based on APTw MTRasym or LD-maps were defined and compared to the conventional GTVs and CTVs.
Results: Both APTw-CEST MRI-based GTVs were similar in size, significantly larger than the GTV, and significantly smaller than the CTV.
Impact: This prospective pilot study integrates APTw-CEST MRI into glioblastoma radiotherapy planning, enabling a reduction of the 15-mm CTV-margin, and construction of a personalized target area that only targets tumor infiltration. This minimizes radiation-induced side-effects and thus improves quality of life.
Introduction
Glioblastoma is notorious for its extensive tumor infiltration. As microscopic infiltration cannot be depicted on conventional MRI, the clinical target volume (CTV) for radiotherapy is typically defined by the gross tumor volume (GTV) plus a 15-mm safety margin1. This commonly results in large target areas, encompassing considerable amounts of healthy tissue and increasing the risk of radiation-induced side-effects2. Amide proton transfer-weighted (APTw)-imaging – a recent technique that probes local levels of mobile proteins and peptides through chemical exchange saturation transfer (CEST) MRI – has been associated with increased Ki-67 expression and cellular proliferation3-5, and can aid in visualizing tumor infiltration. This offers an opportunity to more accurately define the GTV and, potentially, re-evaluate the general 15-mm CTV-margin6. Two common CEST-metrics for APTw-imaging are amide-weighted Magnetization Transfer Ratio asymmetry (MTRasym) and Lorentzian Difference (LD). While MTRasym is appreciated for its relative simplicity, LD is presumed to provide a more accurate representation of the signal contributions originating from amides7,8. In this study, the potential of integrating MTRasym or LD for more accurate GTV delineation is explored.Methods
In a prospective cohort study, patients diagnosed with glioblastoma and scheduled for radiotherapy underwent an extended treatment planning MRI-scan. This MRI-protocol included the clinical brain tumor protocol and a 3D snapshot CEST-sequence (gradient echo read-out, TR=6.6 ms; TE=1.1 ms; slices≥16; slice thickness=3 mm; in-plane voxel size=1.72x1.72 mm2; matrix=128x128; acceleration factor=3; frequency offsets: ±100, ±50, ±10, ±8, ±6, ±5, ±4, ±3.5, ±3, ±2.5, ±2, ±1.5, ±1.2, ±1, ±0.8, ±0.5, ±0.25, 0 ppm) for APTw-image generation. APTw MTRasym and LD-maps were generated according to the post-processing methods described by Wu et al9, and registered to the post-contrast T1-weighted MRI-scan. The construction of the GTV, CTV and radiotherapy plan adhered to standard clinical guidelines1, using the post-contrast T1-weighted, T2-weighted and T2-weighted-FLAIR MRI-scans. For each patient, a GTV that included MTRasym information (GTVMTRasym) and a GTV that included LD information (GTVLD) was constructed by expanding the conventional GTV to encompass areas that exhibited hyperintense APTw-signal on the MTRasym or LD-map. These areas were identified by segmenting the contralateral normal-appearing white matter (cNAWM) and establishing a patient-specific threshold7 (SAPT,thr) calculated through $$$S_{APT,thr} > \mu_{APT,cNAWM} + 2\times\sigma_{APT,cNAWM}$$$. Areas with hyperintense APTw-signal within a 15-mm range of the GTV were delineated using this threshold and, after correction for anatomical barriers and a smoothing process, incorporated into the GTV to construct the GTVMTRasym and GTVLD. A Wilcoxon signed-rank test was performed to compare the sizes of the GTVMTRasym and GTVLD, as well as their sizes with the GTV and CTV. Additionally, the dice similarity coefficients (DSC) between the GTV, GTVMTRasym and GTVLD were computed to examine their volumetric similarity.Results
Between June 2023 and October 2023, a total of nine patients with glioblastoma were included; one patient was excluded from the analysis due to discontinuation of the treatment. The median SAPT,thr was 0.010 (IQR 0.007-0.020) on MTRasym and 0.085 (IQR 0.080-0.087) on LD. The absolute volumes of the GTV, GTVMTRasym, GTVLD and CTV for each patient are shown in Fig. 1. The GTVMTRasym and GTVLD were significantly larger than the GTV, with a median increase in size of 18.3% (IQR 2.54%-43.6%, p=0.0078) and 29.0% (IQR 4.35%-64.9%, p=0.0078), respectively. The GTVMTRasym and GTVLD were significantly smaller than the CTV, with a median reduction in size of 69.7% (IQR 64.6%-74.4%, p=0.0078) and 67.5% (IQR 63.1%-71.2%, p=0.0078), respectively. There was no significant difference in size between the GTVMTRasym and the GTVLD (p=0.0547). The median DSC of the GTV-GTVMTRasym, GTV-GTVLD and the GTVMTRasym-GTVLD were 0.92 (IQR 0.82-0.99), 0.88 (IQR 0.76-0.98) and 0.92 (IQR 0.85-0.97), respectively. Fig. 2 and Fig. 3 show two examples of APTw-imaging and the generated GTVMTRasym and GTVLD.Discussion
On both the MTRasym and LD-maps, regions with hyperintense APTw-signal were found to extend beyond the conventional GTV, underscoring the potential of APTw-imaging for enhanced visualization of tumor infiltration. In all cases, the GTVMTRasym and GTVLD were considerably smaller than the CTV, strengthening the hypothesis that the isotropic 15-mm CTV-margin not only includes tumor infiltration, but also substantial amounts of healthy tissue. The equal sizes of the GTVMTRasym and GTVLD imply LD-mapping for this purpose may not be advantageous, as MTRasym, with potential for short acquisition times, proves equally effective. Future work will focus on the CTV generation based on APTw-imaging, its relation to the conventional CTV, and pattern-of-failure analysis of the recurring tumor.Conclusion
The introduction of APTw-imaging, albeit MTRasym or LD, for target delineation of glioblastoma marks a first step towards personalized CTV definition, enabling more precise radiotherapy treatment and reduced risk of radiation-induced toxicity.Acknowledgements
No acknowledgement found.References
1. Niyazi, M., Andratschke, N., Bendszus, M., Chalmers, A. J., Erridge, S. C., Galldiks, N., Lagerwaard, F. J., Navarria, P., Munck Af Rosenschöld, P., Ricardi, U., van den Bent, M. J., Weller, M., Belka, C., & Minniti, G. (2023). ESTRO-EANO guideline on target delineation and radiotherapy details for glioblastoma. Radiotherapy and oncology : journal of the European Society for Therapeutic Radiology and Oncology, 184, 109663. https://doi.org/10.1016/j.radonc.2023.109663
2. Scoccianti, S., Detti, B., Cipressi, S., Iannalfi, A., Franzese, C., & Biti, G. (2012). Changes in neurocognitive functioning and quality of life in adult patients with brain tumors treated with radiotherapy. Journal of neuro-oncology, 108(2), 291–308. https://doi.org/10.1007/s11060-012-0821-8
3. Togao, O., Yoshiura, T., Keupp, J., Hiwatashi, A., Yamashita, K., Kikuchi, K., Suzuki, Y., Suzuki, S. O., Iwaki, T., Hata, N., Mizoguchi, M., Yoshimoto, K., Sagiyama, K., Takahashi, M., & Honda, H. (2014). Amide proton transfer imaging of adult diffuse gliomas: correlation with histopathological grades. Neuro-oncology, 16(3), 441–448. https://doi.org/10.1093/neuonc/not158
4. Su, C., Liu, C., Zhao, L., Jiang, J., Zhang, J., Li, S., Zhu, W., & Wang, J. (2017). Amide Proton Transfer Imaging Allows Detection of Glioma Grades and Tumor Proliferation: Comparison with Ki-67 Expression and Proton MR Spectroscopy Imaging. AJNR. American journal of neuroradiology, 38(9), 1702–1709. https://doi.org/10.3174/ajnr.A5301
5. Jiang, S., Eberhart, C. G., Zhang, Y., Heo, H. Y., Wen, Z., Blair, L., Qin, H., Lim, M., Quinones-Hinojosa, A., Weingart, J. D., Barker, P. B., Pomper, M. G., Laterra, J., van Zijl, P. C. M., Blakeley, J. O., & Zhou, J. (2017). Amide proton transfer-weighted magnetic resonance image-guided stereotactic biopsy in patients with newly diagnosed gliomas. European journal of cancer (Oxford, England : 1990), 83, 9–18. https://doi.org/10.1016/j.ejca.2017.06.009
6. Tang, P. L. Y., Méndez Romero, A., Jaspers, J. P. M., & Warnert, E. A. H. (2022). The potential of advanced MR techniques for precision radiotherapy of glioblastoma. Magma (New York, N.Y.), 35(1), 127–143. https://doi.org/10.1007/s10334-021-00997-y
7. Warnert, E. A. H., Wood, T. C., Incekara, F., Barker, G. J., Vincent, A. J. P., Schouten, J., Kros, J. M., van den Bent, M., Smits, M., & Tamames, J. A. H. (2022). Mapping tumour heterogeneity with pulsed 3D CEST MRI in non-enhancing glioma at 3 T. Magma (New York, N.Y.), 35(1), 53–62. https://doi.org/10.1007/s10334-021-00911-6.
8. Wu, Y., Wood, T.C., Derks, S.H.A.E. et al. Reproducibility of APT-weighted CEST-MRI at 3T in healthy brain and tumor across sessions and scanners. Sci Rep 13, 18115 (2023). https://doi.org/10.1038/s41598-023-44891-0.
9. Wu, Y., Wood, T. C., Arzanforoosh, F., Hernandez-Tamames, J. A., Barker, G. J., Smits, M., & Warnert, E. A. H. (2022). 3D APT and NOE CEST-MRI of healthy volunteers and patients with non-enhancing glioma at 3 T. Magma (New York, N.Y.), 35(1), 63–73. https://doi.org/10.1007/s10334-021-00996-z
Figures
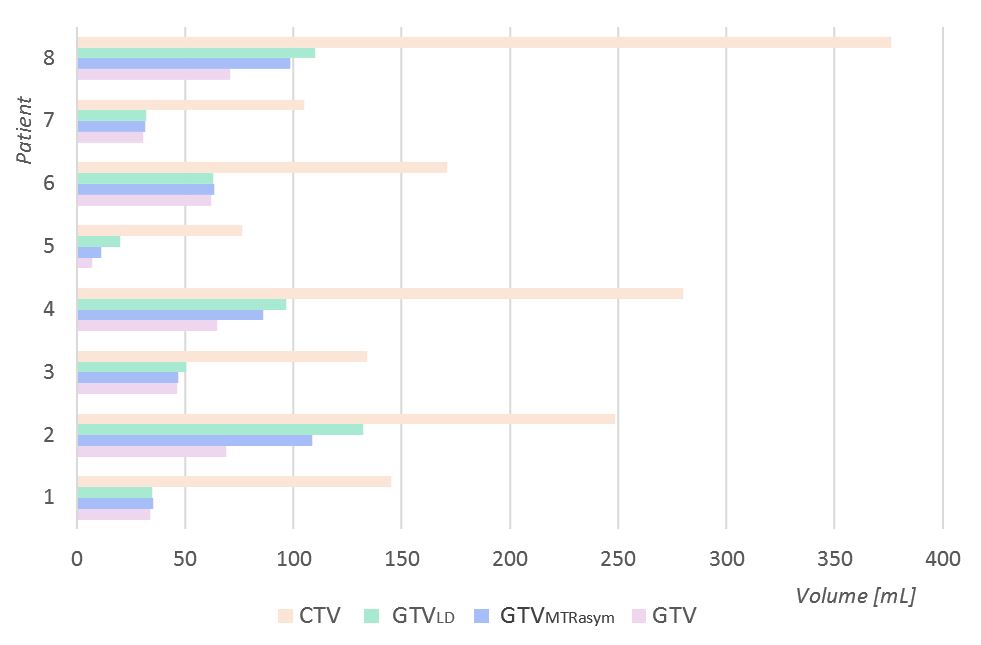
Fig. 1: Absolute volumes of the GTV, GTVMTRasym, GTVLD and CTV of each individual patient.
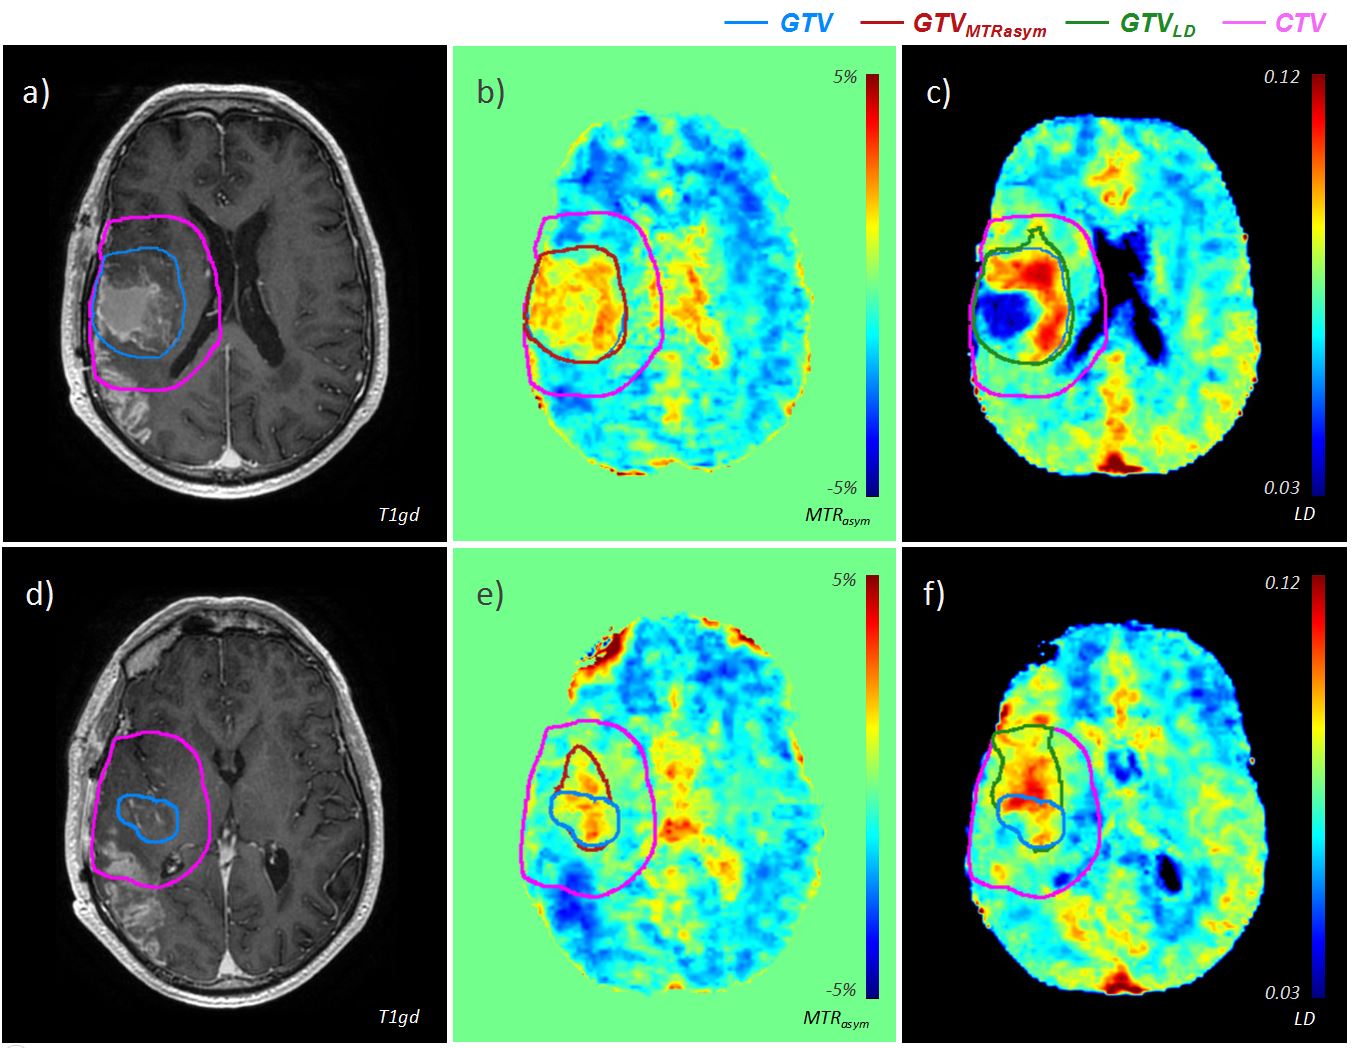
Fig. 2: Two axial slices showing the post-contrast T1-weighted MRI and the skull-stripped MTRasym and LD-map of a patient with glioblastoma in the right hemisphere (study patient 4). An uneven distribution of elevated APTw-signal is visible within the GTV (a,b,c). At the inferior part of the GTV (d,e,f), hyperintense APTw-signal was observed to extent beyond the GTV.
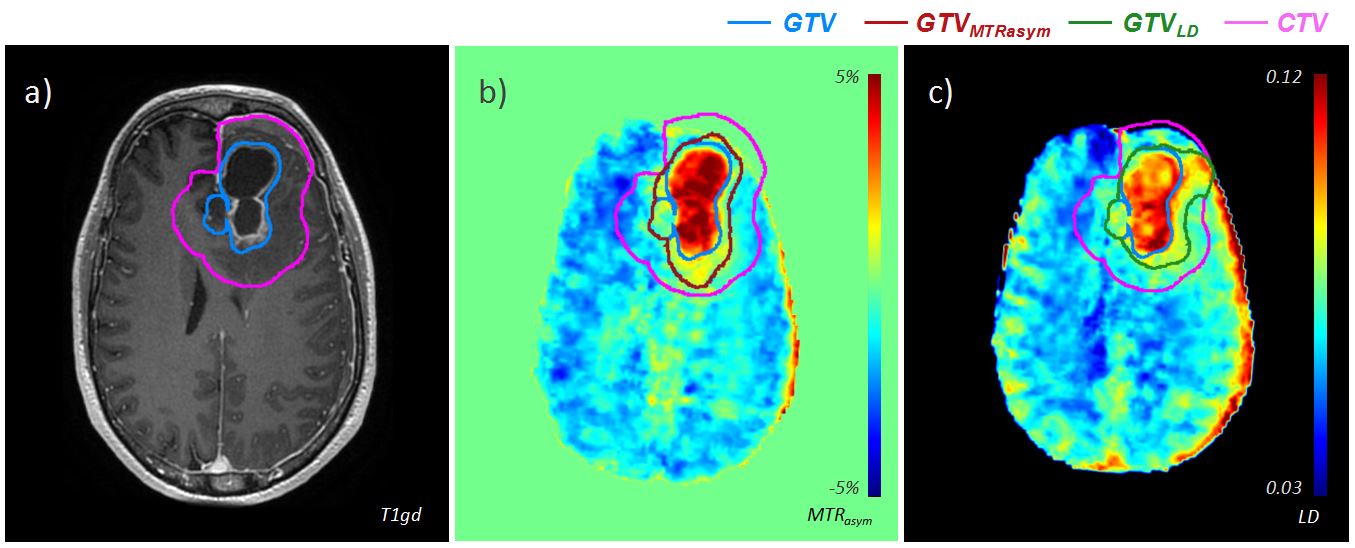
Fig. 3: An axial slice showing the post-contrast T1-weighted MRI (a) and the skull-stripped MTRasym (b) and LD-maps (c) of a patient with a glioblastoma in the left frontal lobe (study patient 2).