0444
First demonstration of arterial spin labeling on a 1.5T MR-Linac for characterizing glioblastoma perfusion dynamics1Department of Medical Biophysics, University of Toronto, Toronto, ON, Canada, 2Department of Radiation Oncology, Sunnybrook Health Sciences Centre, Toronto, ON, Canada, 3Department of Physics, Toronto Metropolitan University, Toronto, ON, Canada, 4Division of Neurology, Department of Medicine, Sunnybrook Health Sciences Centre, Toronto, ON, Canada, 5Department of Surgery, St. Michael's Hospital, Toronto, ON, Canada, 6Physical Sciences Platform, Sunnybrook Research Institute, Toronto, ON, Canada
Synopsis
Keywords: MR-Guided Radiotherapy, Tumor, MR-Linac, perfusion, glioblastoma
Motivation: Glioblastoma is a highly vascularized brain tumor. Changes in perfusion could guide treatment adaptation, but the dynamics of blood flow changes in glioblastoma during radiotherapy are poorly understood.
Goal(s): We sought to characterize changes in glioblastoma cerebral blood flow during radiotherapy.
Approach: We acquired twice-weekly arterial spin labeling (ASL) MRI in 22 glioblastoma patients during radiotherapy on a 1.5T MRI-linear accelerator (MR-Linac) and evaluated changes in cerebral blood flow.
Results: We provided the first demonstration of MR-Linac ASL. Tumor cerebral blood flow tended to decrease during radiotherapy. Highly-perfused tumor regions showed the greatest change.
Impact: We showed that frequent perfusion imaging on MRI-linear accelerators is feasible and that blood flow in highly-perfused regions of human glioblastoma tends to decrease during radiotherapy. Radiotherapy with dose escalation to highly perfused tumor regions likely requires target adaptation.
Introduction
MRI linear accelerators (MR-Linacs) allow patients to be scanned at each treatment fraction,1 enabling investigation of biological dynamics of tumors during radiotherapy and potential biologically-guided therapy adaptation for gliomas.2,3 Perfusion MRI may be useful for guiding adaptation because abnormal tumour vasculature likely contributes to therapeutic resistance.4 Dose-intensified radiotherapy to highly perfused (and cellular) regions is already under investigation.5,6 However, knowledge of perfusion dynamics during treatment is limited, but is needed for determining adaptation strategies. To investigate glioblastoma perfusion during radiotherapy, we developed an arterial spin labeling (ASL) protocol on a 1.5T MR-Linac. To our knowledge, this is the first report of MR-Linac ASL. The objective was to evaluate imaging performance and characterize tumor perfusion dynamics.Materials and Methods
Participants and treatment: Twenty-two glioblastoma patients (14 male/8 female; median age: 69 years, range: 39-78 years) were treated with small-margin adaptive chemoradiotherapy on a 1.5T MR-Linac (Unity, Elekta) (NCT04726397, NCT05565521, NCT05720078). Dose schedules included 40Gy/15fx (N=8), 52.5Gy/15fx (N=3), 54Gy/30fx (N=1), and 60Gy/30fx (N=10). The gross tumor volume (GTV) was defined as the enhancing tumor plus surgical cavity on post-gadolinium T1-weighted imaging. The clinical target volume (CTV) was defined as a 5mm expansion on the GTV plus involved T2-FLAIR hyperintensities, at the discretion of the treating physician. Two healthy subjects were also imaged.Data acquisition: Single-post-label-delay (PLD) ASL was acquired up to twice per week with an anterior-posterior 8-channel body coil array, using recommended acquisition parameters for brain tumors (3D GRASE, TR/TE=4100/16ms, voxel size=4⨉4⨉8mm3, matrix size=64⨉64⨉16, 8 control-label pairs, label duration=1.8s, PLD=2.0s, labelling plane ~4cm below base of cerebellum, scan time=10min15sec).7,8 A calibration image without background suppression was also acquired. T1-weighted imaging was included for anatomical reference (3D MPRAGE, TR/TE=8.0/3.6, voxel size=1.1⨉1.1⨉2.2mm3, FOV=270⨉200⨉200mm3), with weekly gadolinium contrast enhancement for adaptation.
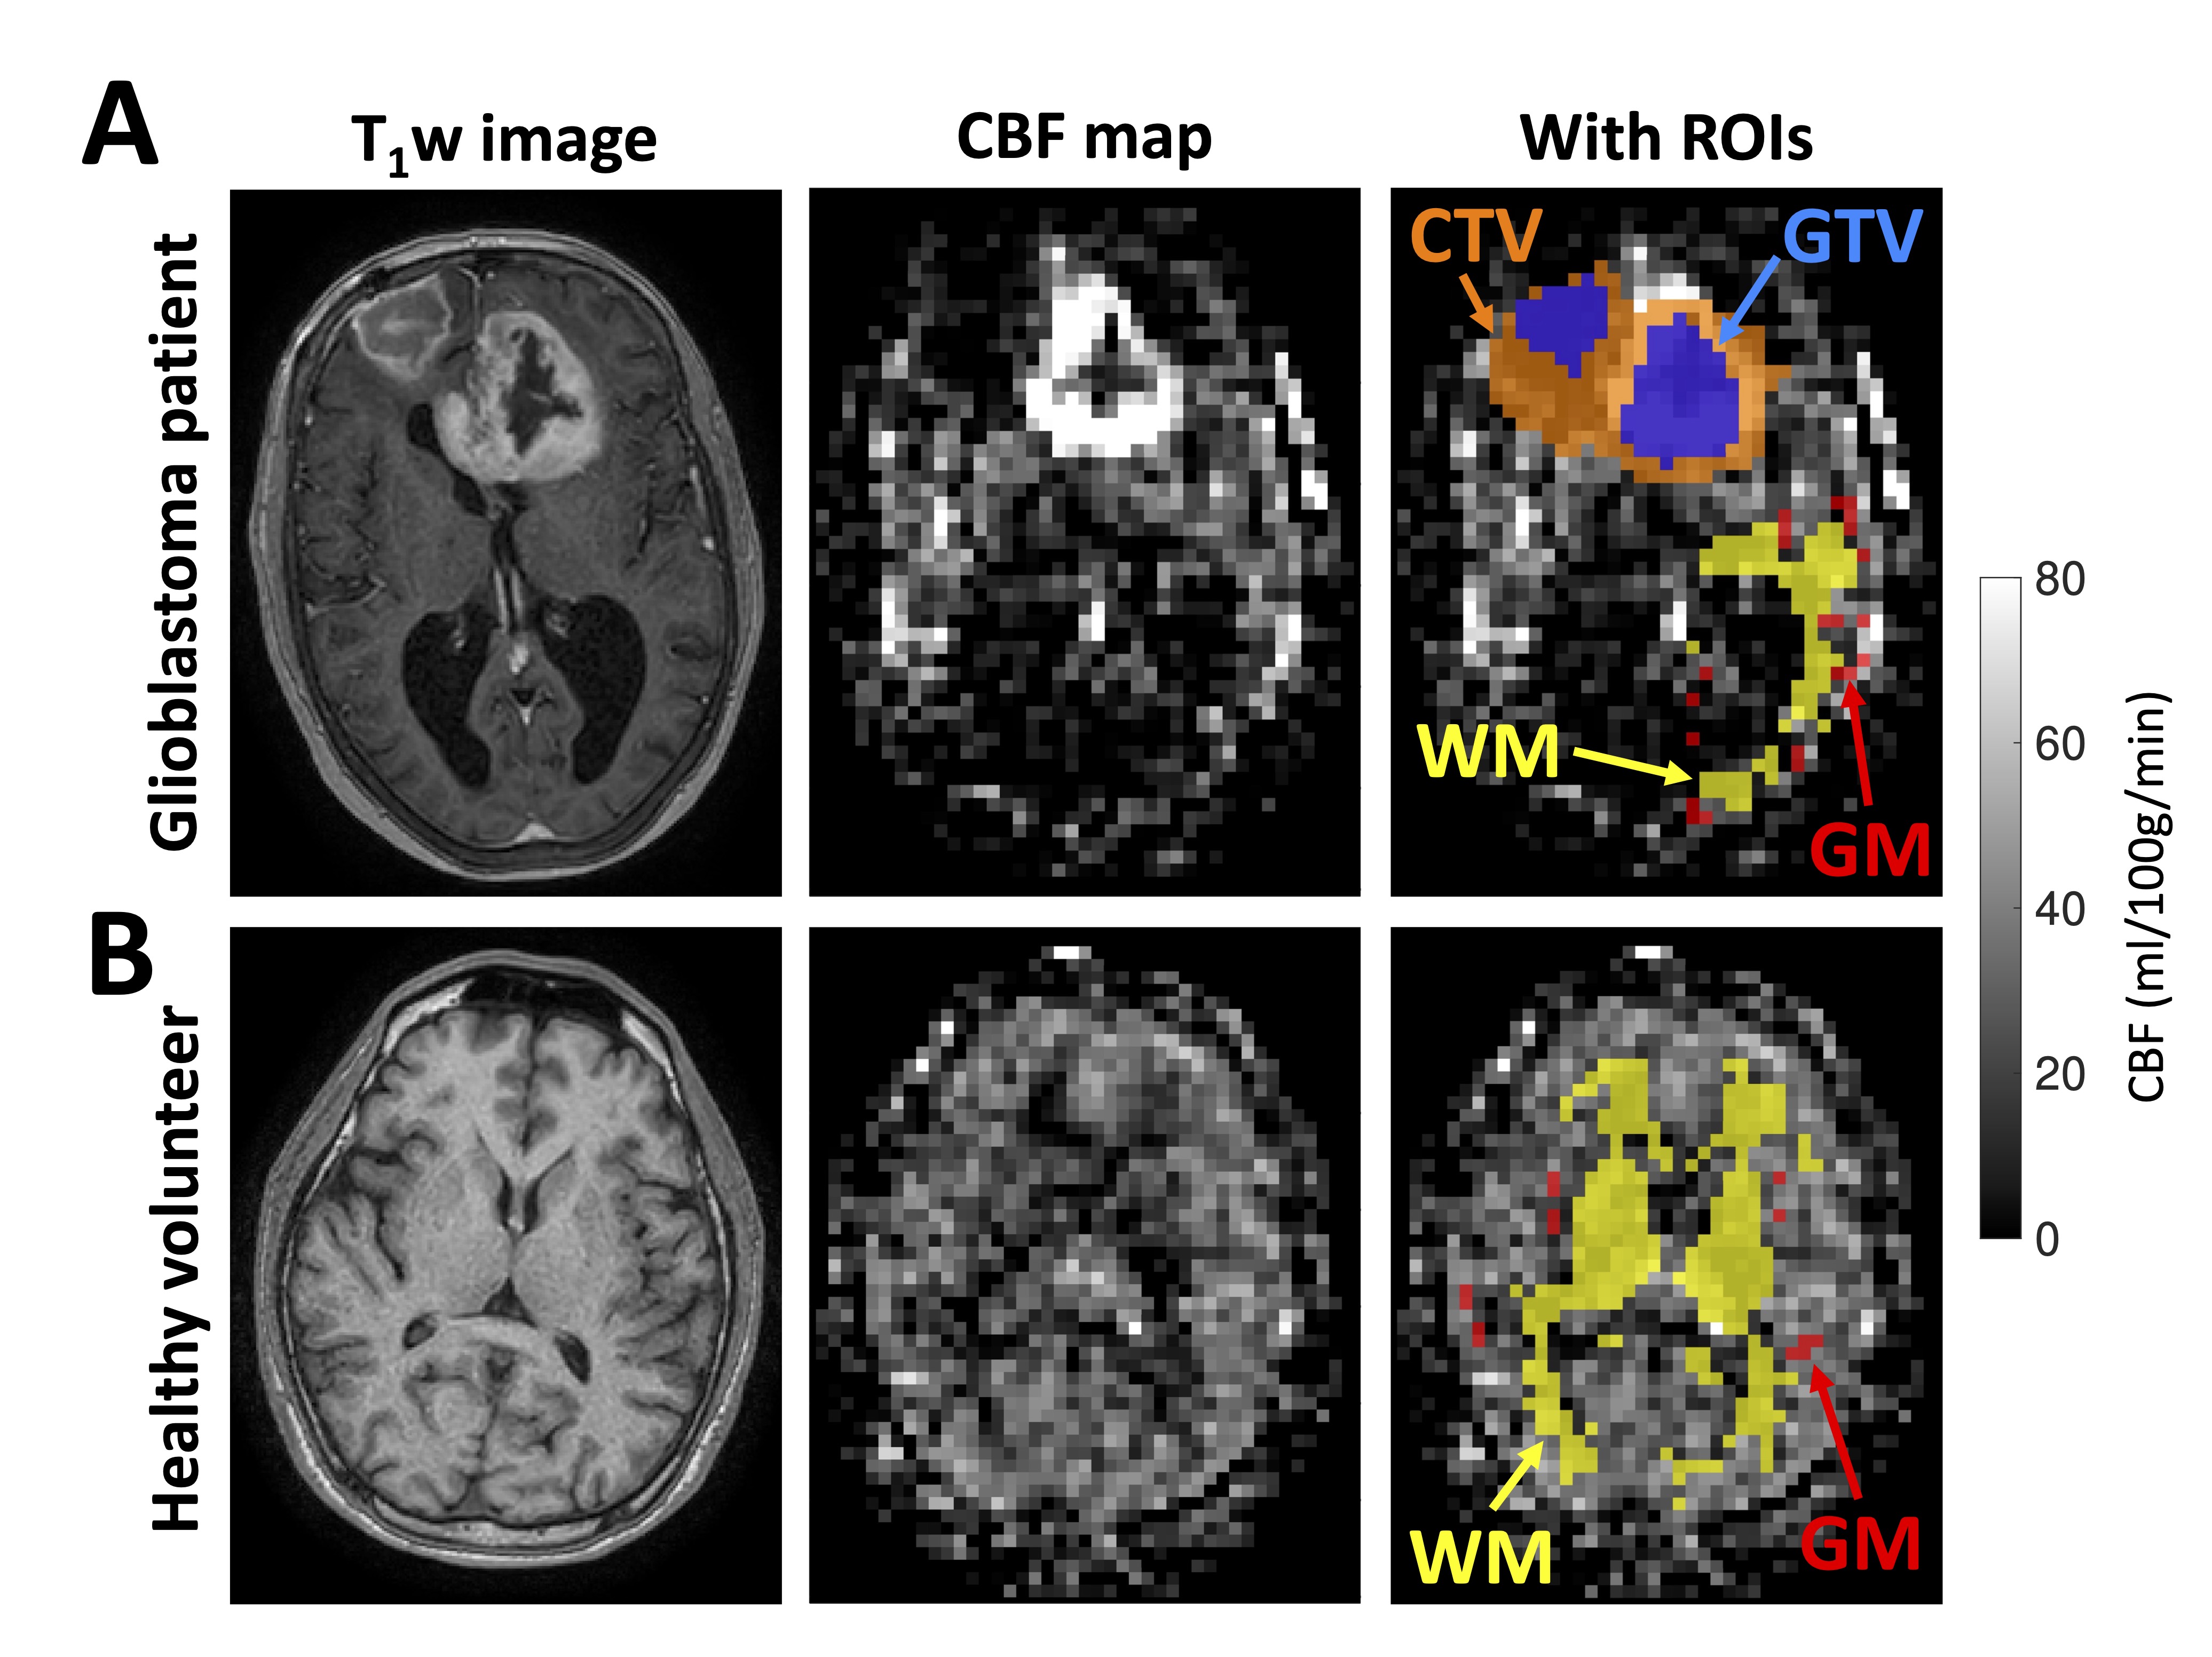
Image processing: Cerebral blood flow (CBF) maps were calculated using a kinetic model implemented in Oxford_asl.9 Literature T1 values for 1.5T were used for arterial blood (1480ms) and gray matter (1197ms).10,11 For each patient, T1-weighted and ASL scans from all timepoints were coregistered.12–15 The T1-weighted scans were skull-stripped and automatically segmented.16,17 Gray and white matter probability maps were restricted to the hemisphere contralateral to the tumor, resampled to the ASL geometry, and thresholded at 90%. The regions of interest (ROIs) comprised gray matter (GM), white matter (WM), GTV, and CTV (Figure 1).
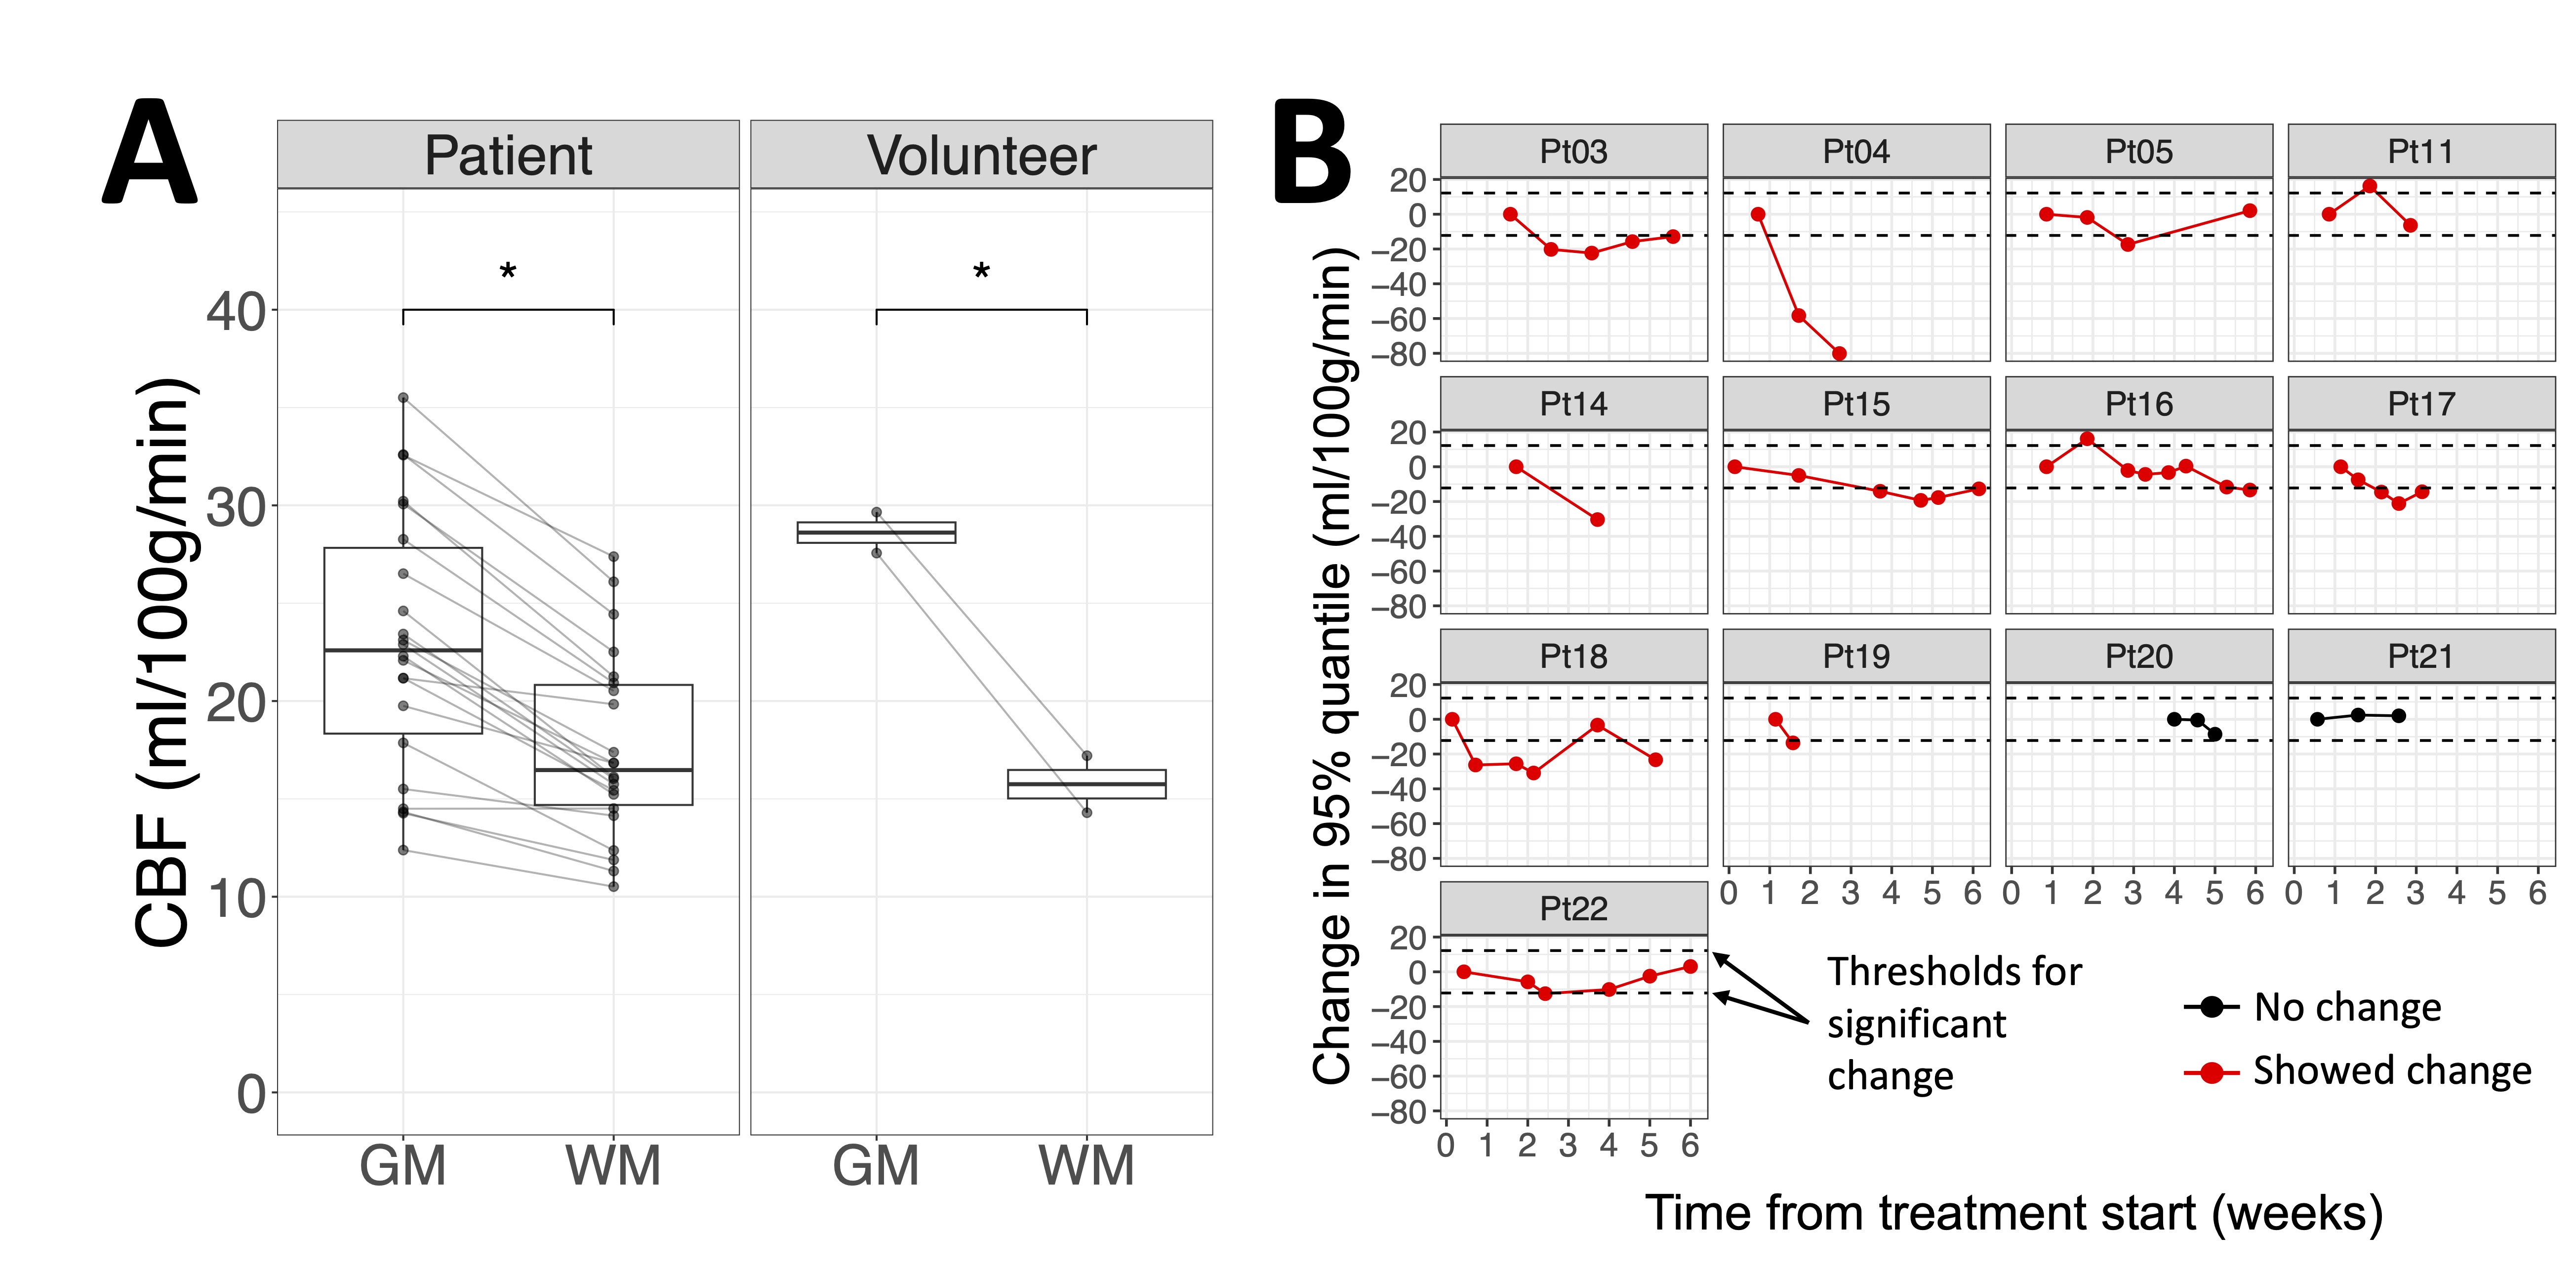
Statistics: CBF summary statistics were calculated over each region (median and 95% quantile, which was used over the maximum to exclude outliers). To quantify GM/WM contrast, a paired t-test was done to compare median CBF between GM and WM at baseline for patients and volunteers, separately. For quantifying repeatability, the within-subject standard deviation (wSD) of median GM CBF was computed.18 CBF changes over the GTV and CTV were computed relative to the earliest fraction for each patient. The GM repeatability coefficient (RC=2.77⨉wSD) was used as the threshold for determining significant change.19 The number of patients showing change was counted for each summary statistic.
Results
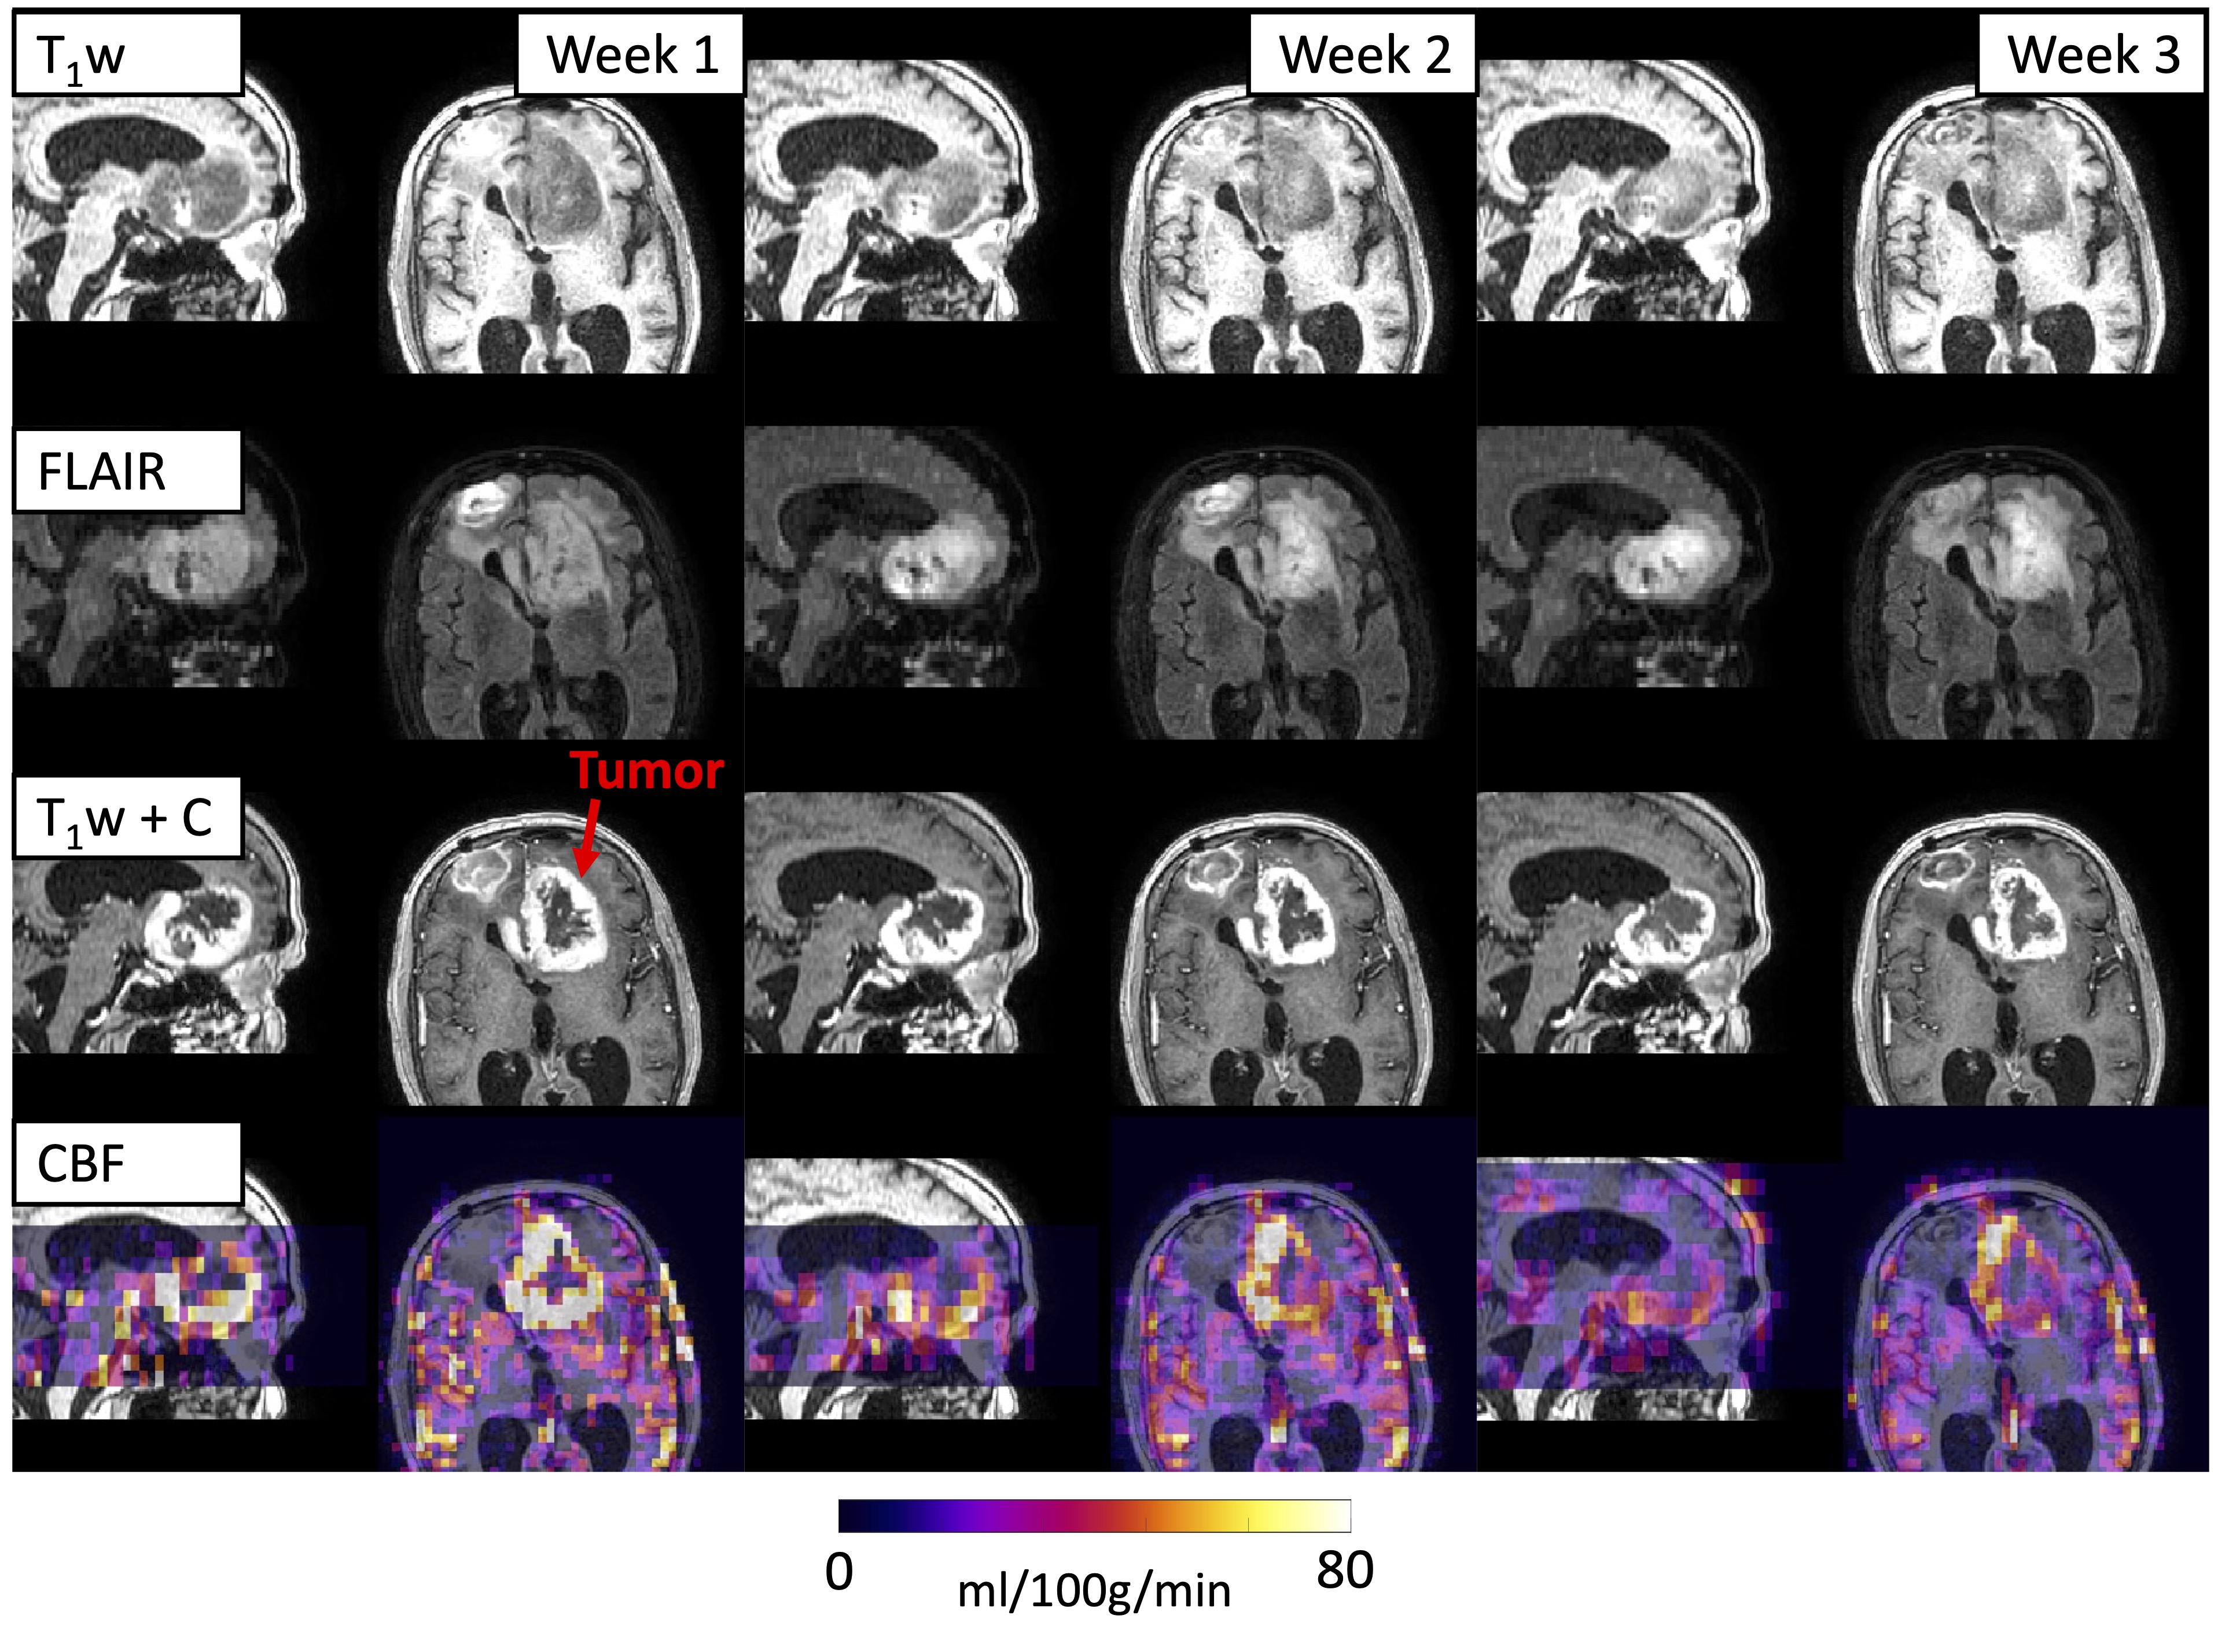
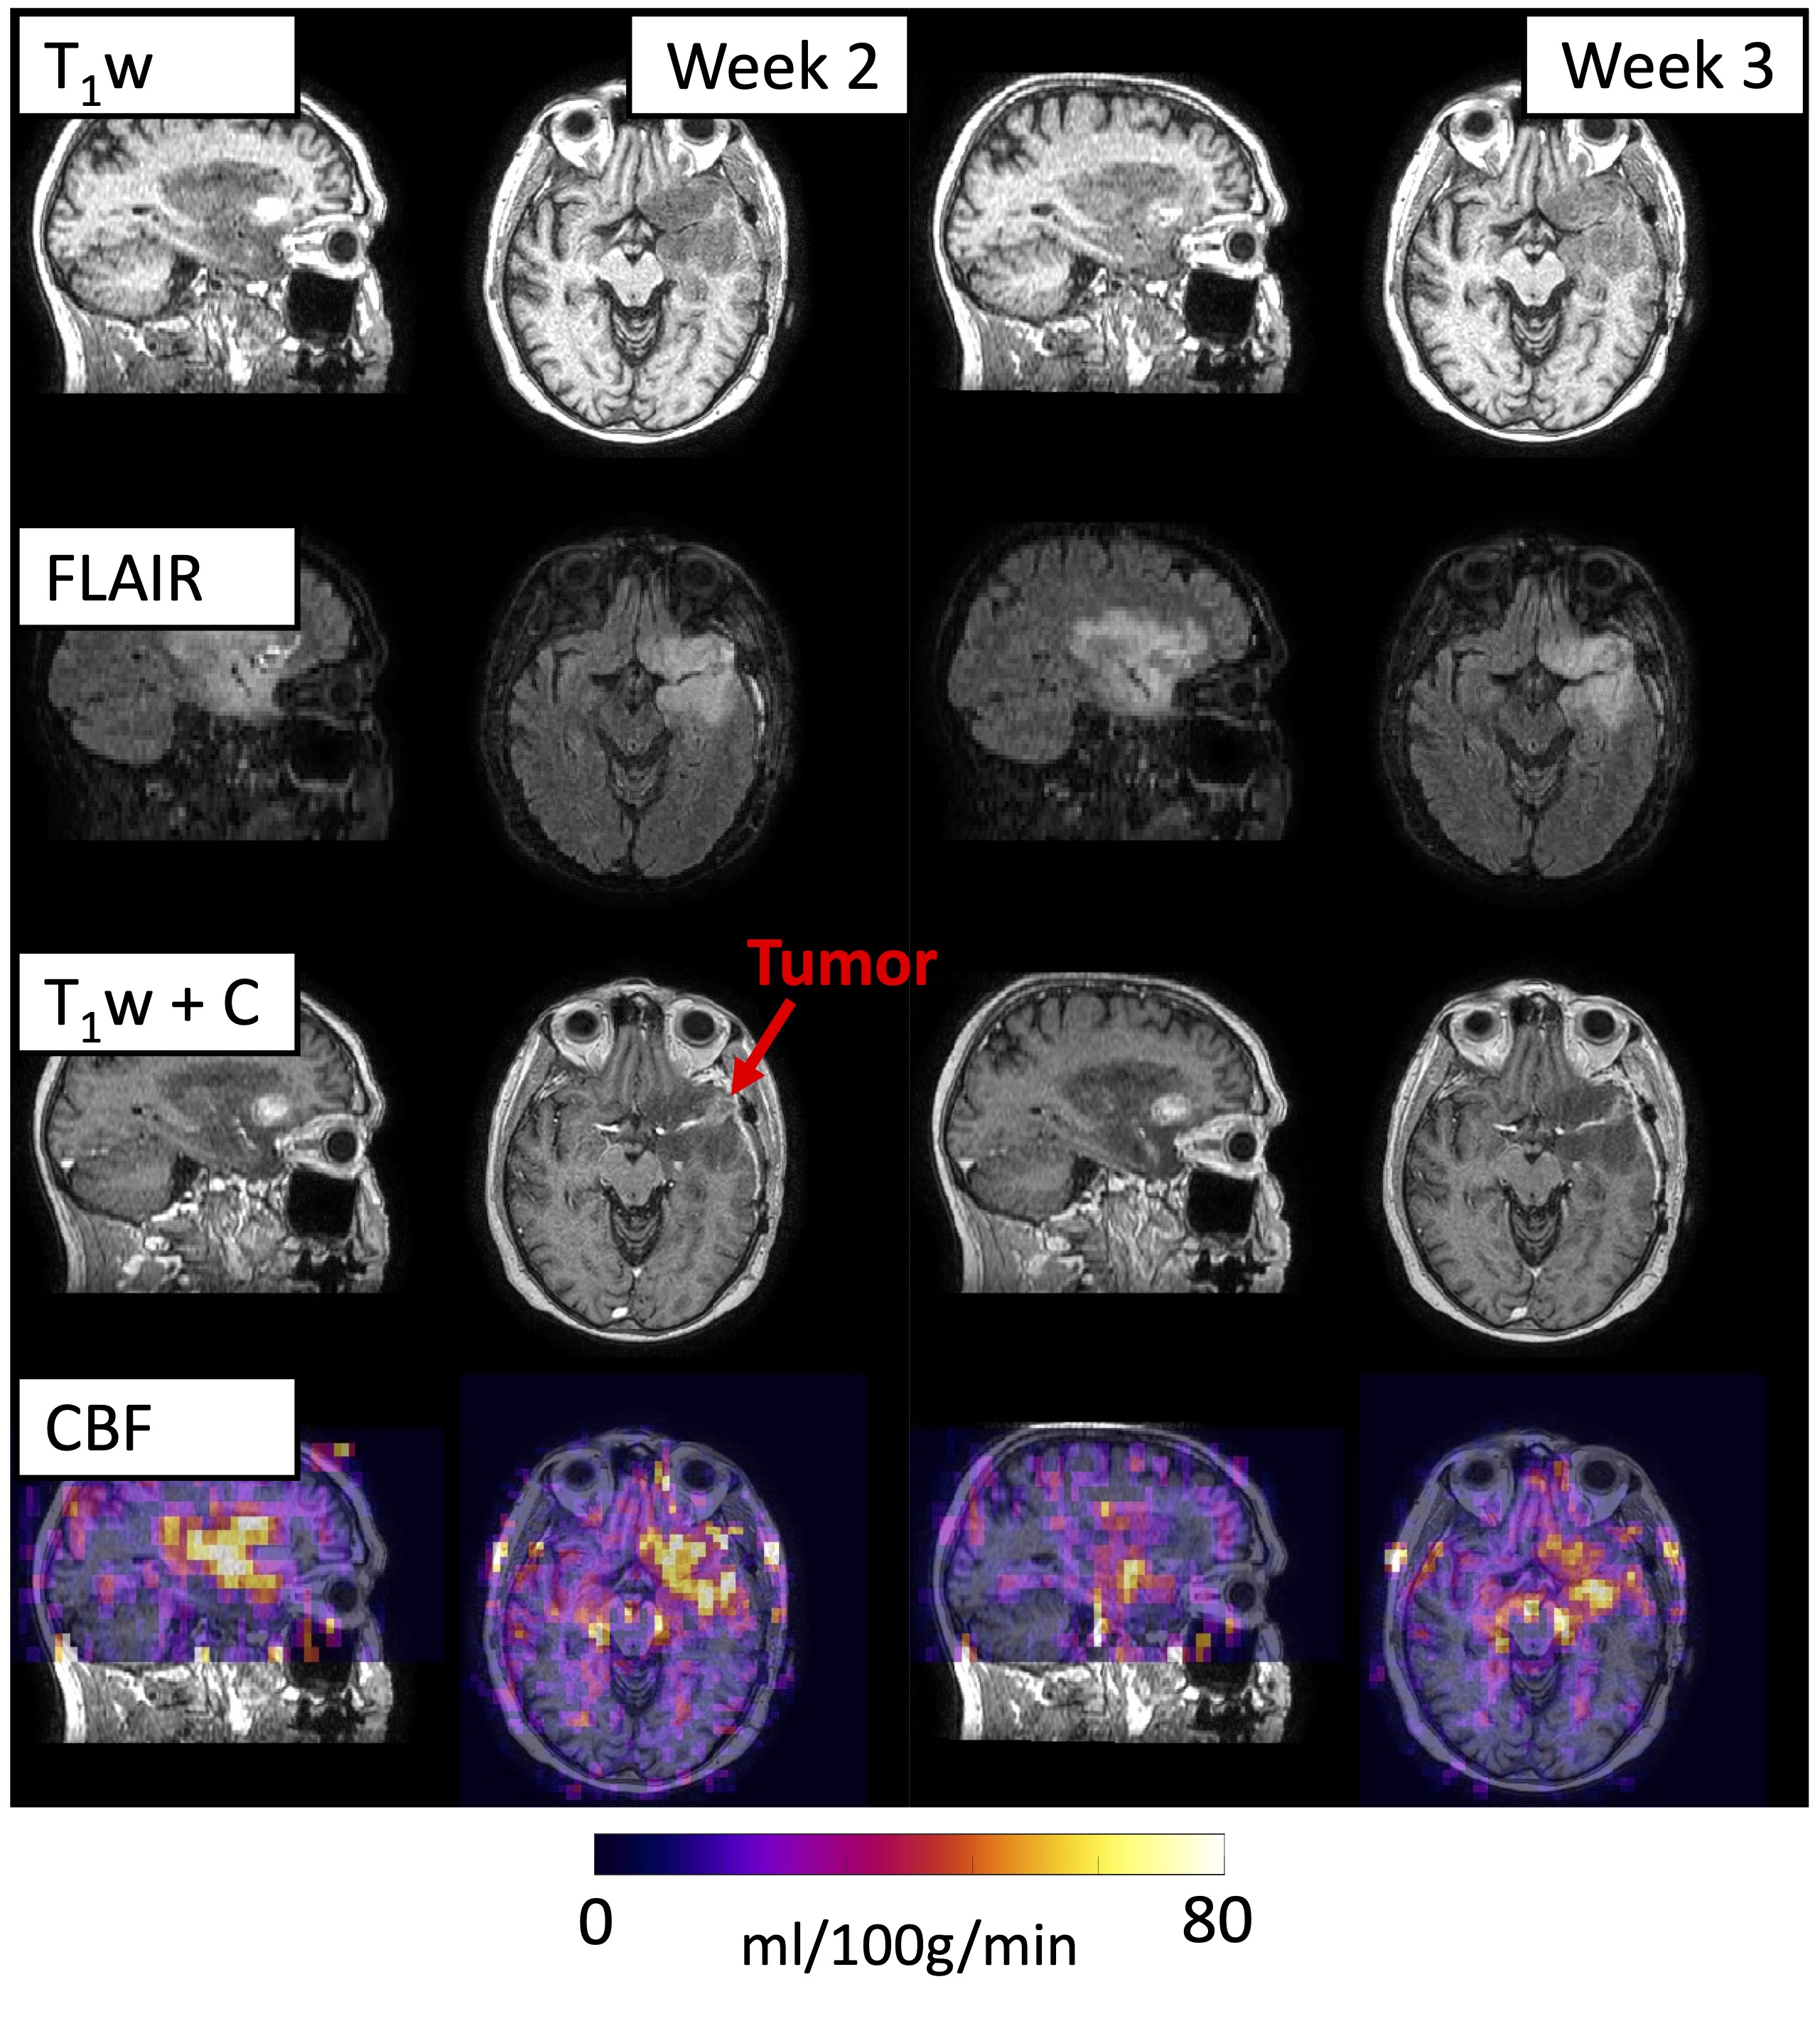
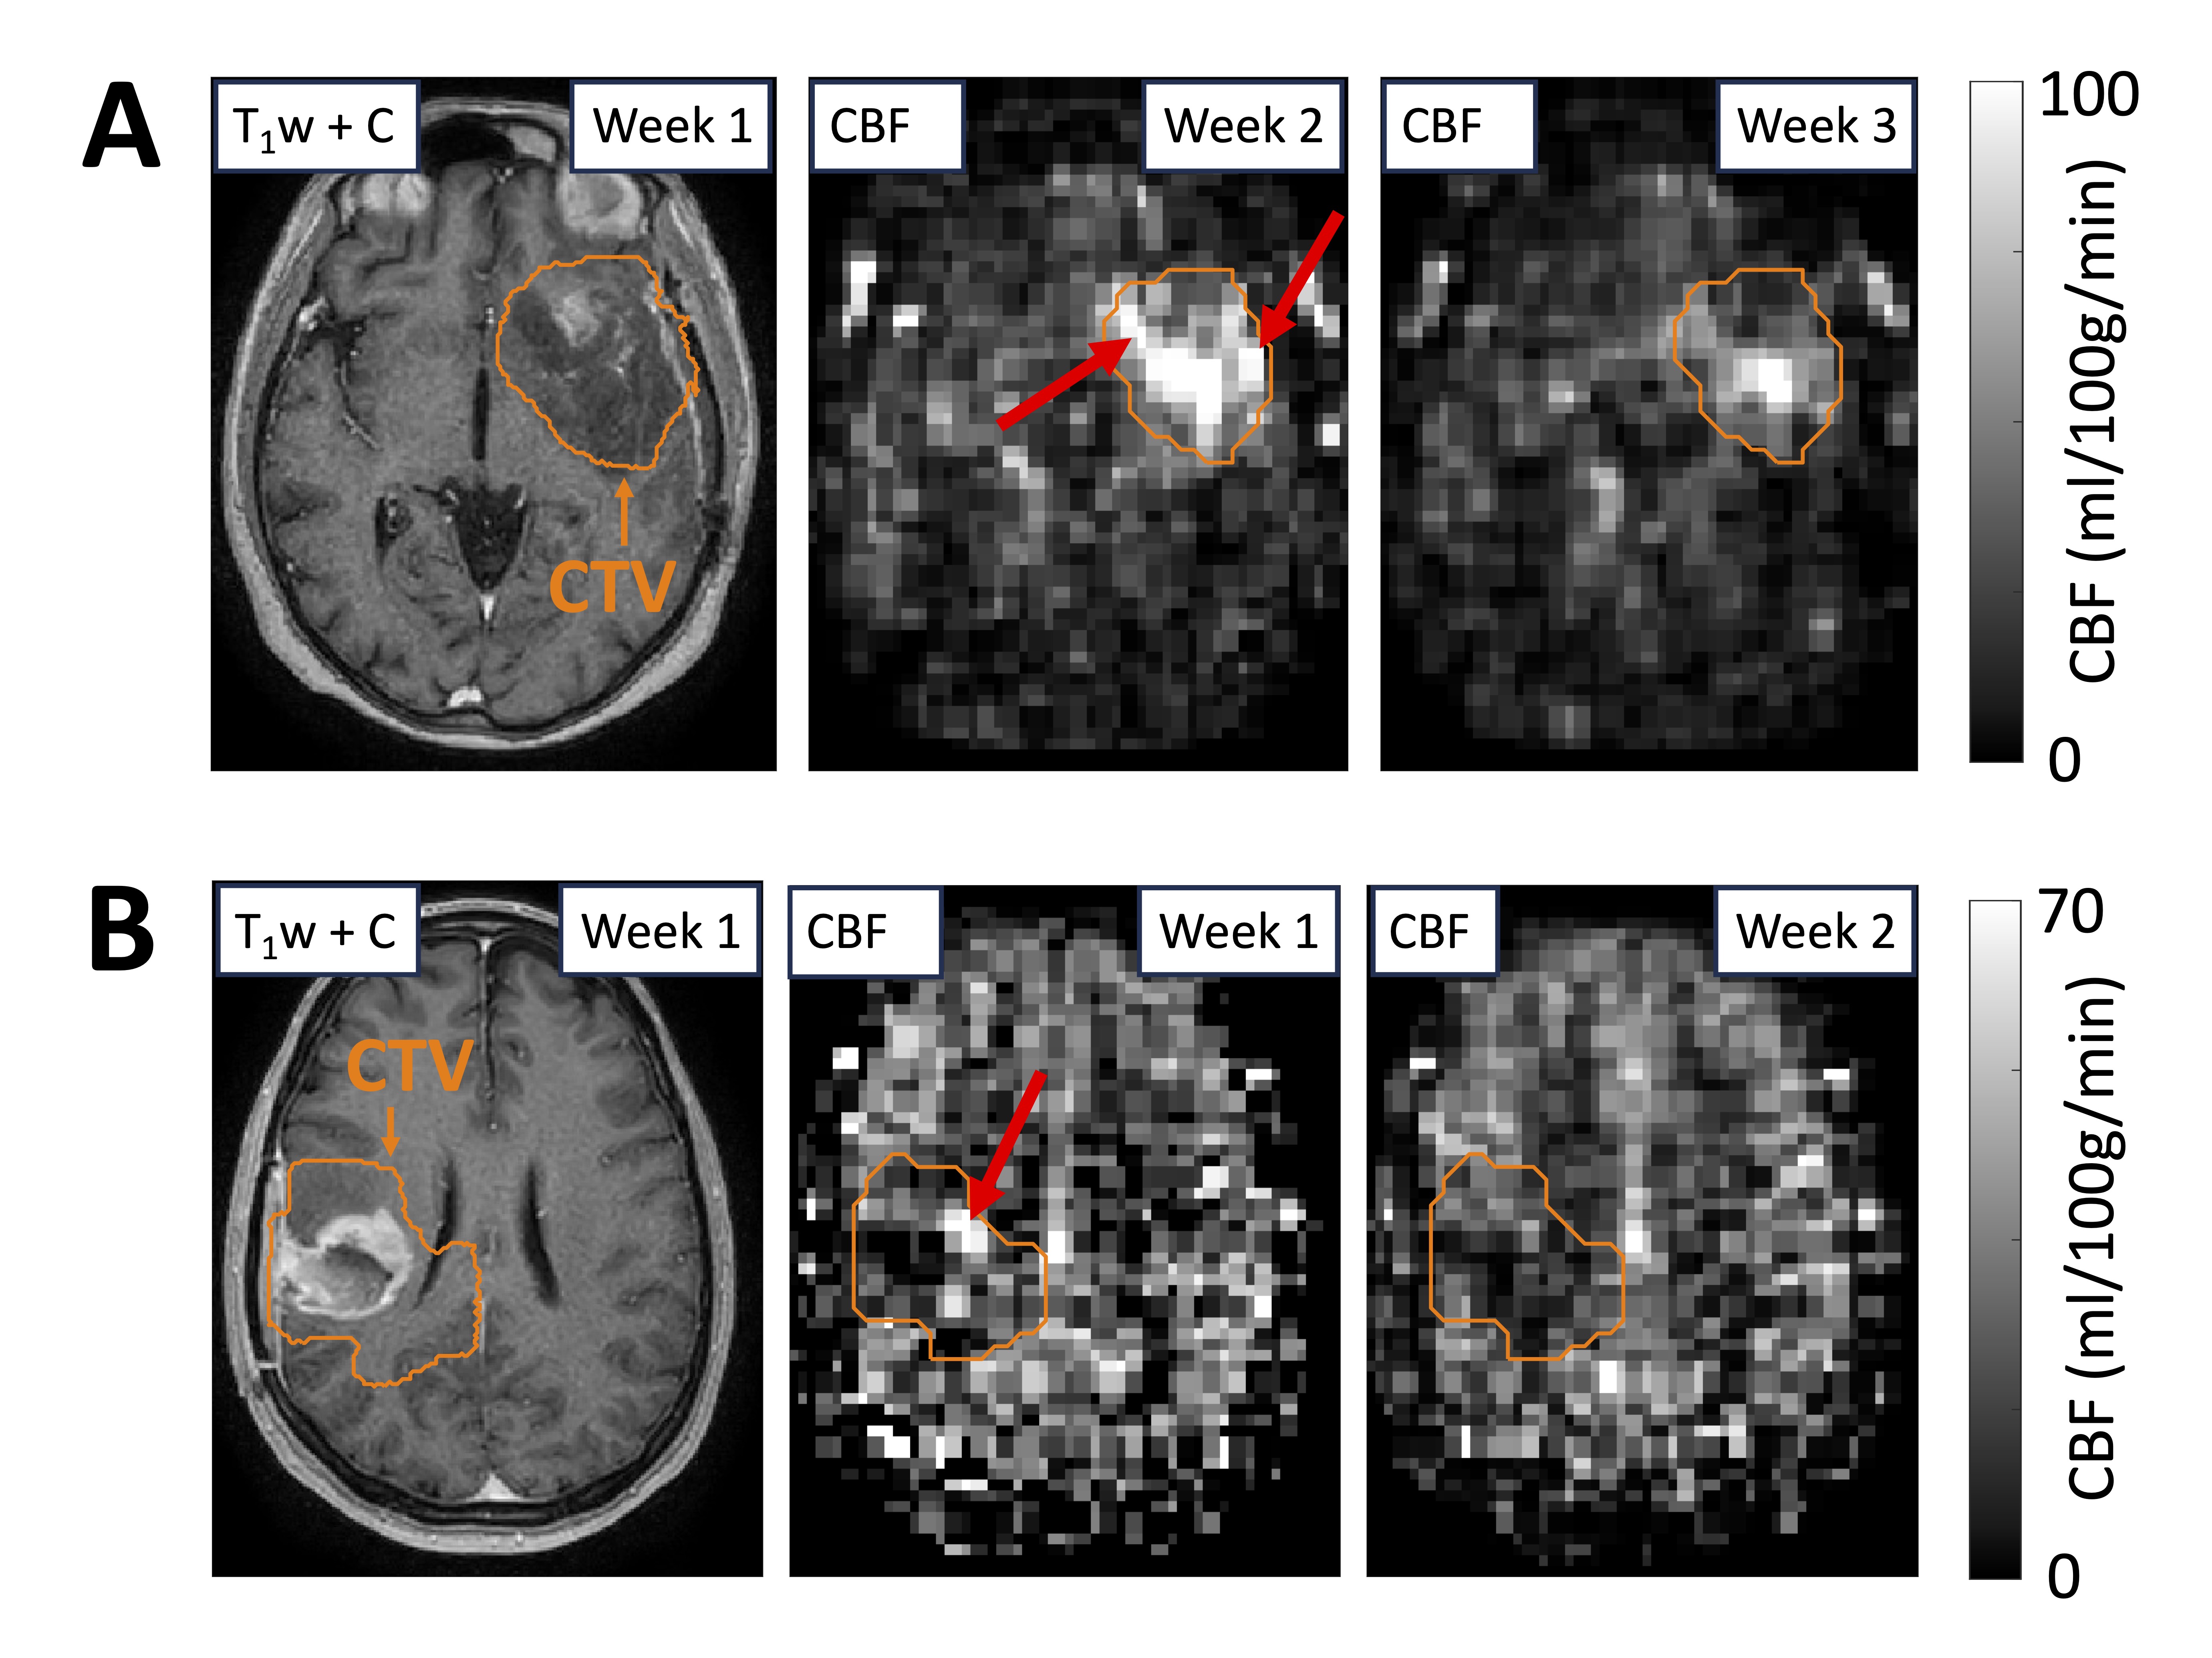
Thirteen patients had multiple ASL scans during treatment. Certain patients showed substantial changes in tumor perfusion with minimal changes in anatomical imaging (Figures 2,3). CBF was higher in gray matter compared to white matter in patients (p<.001) and volunteers (p=.020) (Figure 4A). The median gray matter CBF across patients (23ml/100g/min) was lower than expected from literature (36.5ml/100g/min).20 The wSD of median gray matter CBF (4.4ml/100g/min) was comparable to literature values (5.3ml/100g/min).21 The summary statistic with the greatest number of patients showing change was the 95% quantile of CBF over the CTV, i.e., highly-perfused tumor (N=11/13, Figure 4B). Examples of changes in highly perfused tumor regions are shown in Figure 5.Discussion
Arterial spin labeling can be incorporated into the daily workflow for glioblastoma treatment on MR-Linacs. Recent studies have investigated intra-treatment ASL at 0,3,6 weeks using conventional scanners,22-24 but MR-Linac ASL could allow daily scanning to monitor perfusion dynamics associated with tumor response or hypoxia, or could even detect immediate high-dose radiation effects with pre- and post-beam scans.25-27 The trends in the 95% quantile of CBF suggest that regions of tumor hyperperfusion tend to decrease during treatment. The mechanism or interpretation should be investigated (no patients received antiangiogenics). The lower CBF in gray matter compared to literature was unexpected and is not due to participant age differences (68.2 years mean age compared to our median of 69 years).20 The post-label delay affects CBF and could explain the discrepancy.28 The white matter CBF may be unreliable because of long transit times.29Conclusion
MR-Linac arterial spin labeling can capture glioblastoma perfusion dynamics, which could be used in the future to inform treatment adaptation.Acknowledgements
We thank Dr. Bradley MacIntosh (Sunnybrook Research Institute) and Dr. Guillaume Gilbert (Philips Canada) for advice on the arterial spin labeling protocol. We also thank the MR-Linac radiation therapists Shawn Binda, Danny Yu, Renée Christiani, Katie Wong, Helen Su, Monica Foster, Rebekah Shin, Khang Vo, Ruby Bola, Susana Sabaratram, Christina Silverson, Danielle Letterio, and Anne Carty for scanning. We gratefully acknowledge the following sources of funding: Natural Sciences and Engineering Research Council; Terry Fox Research Institute; Canadian Institutes of Health Research; Canadian Cancer Society Research Institute; and the Ontario Early Researcher Awards program.References
1. Otazo R, Lambin P, Pignol JP, et al. MRI-guided Radiation Therapy: An Emerging Paradigm in Adaptive Radiation Oncology. Radiology. 2021;298(2):248-260. doi:10.1148/radiol.2020202747
2. Datta A, Aznar MC, Dubec M, Parker GJM, O’Connor JPB. Delivering Functional Imaging on the MRI-Linac: Current Challenges and Potential Solutions. Clin Oncol. 2018;30(11):702-710. doi:10.1016/j.clon.2018.08.005
3. Cao Y, Tseng CL, Balter JM, Teng F, Parmar HA, Sahgal A. MR-guided radiation therapy: transformative technology and its role in the central nervous system. Neuro-Oncol. 2017;19(suppl_2):ii16-ii29. doi:10.1093/neuonc/nox006
4. Onishi M, Ichikawa T, Kurozumi K, Date I. Angiogenesis and invasion in glioma. Brain Tumor Pathol. 2011;28(1):13-24. doi:10.1007/s10014-010-0007-z
5. Kim MM, Sun Y, Aryal MP, et al. A Phase 2 Study of Dose-intensified Chemoradiation Using Biologically Based Target Volume Definition in Patients With Newly Diagnosed Glioblastoma. Int J Radiat Oncol. 2021;110(3):792-803. doi:10.1016/j.ijrobp.2021.01.033
6. Kim MM, Parmar HA, Aryal MP, et al. Developing a Pipeline for Multiparametric MRI-Guided Radiation Therapy: Initial Results from a Phase II Clinical Trial in Newly Diagnosed Glioblastoma. Tomography. 2019;5(1):118-126. doi:10.18383/j.tom.2018.00035
7. Alsop DC, Detre JA, Golay X, et al. Recommended implementation of arterial spin-labeled perfusion MRI for clinical applications: A consensus of the ISMRM perfusion study group and the European consortium for ASL in dementia: Recommended Implementation of ASL for Clinical Applications. Magn Reson Med. 2015;73(1):102-116. doi:10.1002/mrm.25197
8. Lindner T, Bolar DS, Achten E, et al. Current state and guidance on arterial spin labeling perfusion MRI in clinical neuroimaging. Magn Reson Med. 2023;89(5):2024-2047. doi:10.1002/mrm.29572
9. Chappell MA, Groves AR, Whitcher B, Woolrich MW. Variational Bayesian Inference for a Nonlinear Forward Model. IEEE Trans Signal Process. 2009;57(1):223-236. doi:10.1109/TSP.2008.2005752
10. Wright PJ, Mougin OE, Totman JJ, et al. Water proton T1 measurements in brain tissue at 7, 3, and 1.5T using IR-EPI, IR-TSE, and MPRAGE: results and optimization. Magn Reson Mater Phys Biol Med. 2008;21(1-2):121-130. doi:10.1007/s10334-008-0104-8
11. Zhang X, Petersen ET, Ghariq E, et al. In vivo blood T 1 measurements at 1.5 T, 3 T, and 7 T: In Vivo Blood T 1 Measurements . Magn Reson Med. 2013;70(4):1082-1086. doi:10.1002/mrm.24550
12. Reuter M, Rosas HD, Fischl B. Highly accurate inverse consistent registration: A robust approach. NeuroImage. 2010;53(4):1181-1196. doi:10.1016/j.neuroimage.2010.07.020
13. Reuter M, Schmansky NJ, Rosas HD, Fischl B. Within-subject template estimation for unbiased longitudinal image analysis. NeuroImage. 2012;61(4):1402-1418. doi:10.1016/j.neuroimage.2012.02.084
14. Jenkinson M, Bannister P, Brady M, Smith S. Improved Optimization for the Robust and Accurate Linear Registration and Motion Correction of Brain Images. NeuroImage. 2002;17(2):825-841. doi:10.1006/nimg.2002.1132
15. Jenkinson M, Smith S. A global optimisation method for robust affine registration of brain images. Med Image Anal. 2001;5(2):143-156. doi:10.1016/S1361-8415(01)00036-6
16. Avants BB, Tustison NJ, Wu J, Cook PA, Gee JC. An open source multivariate framework for n-tissue segmentation with evaluation on public data. Neuroinformatics. 2011;9(4):381-400. doi:10.1007/s12021-011-9109-y
17. Isensee F, Schell M, Pflueger I, et al. Automated brain extraction of multisequence MRI using artificial neural networks. Hum Brain Mapp. 2019;40(17):4952-4964. doi:10.1002/hbm.24750
18. Raunig DL, McShane LM, Pennello G, et al. Quantitative imaging biomarkers: A review of statistical methods for technical performance assessment. Stat Methods Med Res. 2015;24(1):27-67. doi:10.1177/0962280214537344
19. Shukla‐Dave A, Obuchowski NA, Chenevert TL, et al. Quantitative imaging biomarkers alliance (QIBA) recommendations for improved precision of DWI and DCE‐MRI derived biomarkers in multicenter oncology trials. J Magn Reson Imaging. 2019;49(7):e101-e121. doi:10.1002/jmri.26518
20. Leidhin CN, McMorrow J, Carey D, et al. Age-related normative changes in cerebral perfusion: Data from The Irish Longitudinal Study on Ageing (TILDA). NeuroImage. 2021;229:117741. doi:10.1016/j.neuroimage.2021.117741
21. Mutsaerts HJMM, Steketee RME, Heijtel DFR, et al. Inter-Vendor Reproducibility of Pseudo-Continuous Arterial Spin Labeling at 3 Tesla. Rypma B, ed. PLoS ONE. 2014;9(8):e104108. doi:10.1371/journal.pone.0104108
22. Zhou L, Wang Y, Pinho MC, et al. Reproducibility of Pseudocontinuous Arterial Spin Labeling Measured Perfusion in Healthy Volunteers and Glioblastoma Patients. In: Proceedings of the 2023 ISMRM & ISMRT Annual Meeting and Exhibition. June 3-8, 2023; Toronto, Canada.
23. Zhou L, Wang Y, Pinho MC, et al. DSC-MRI and ASL-MRI Measured Perfusion in Glioblastoma: Are they Competitive or Complementary? In: Proceedings of the 2023 ISMRM & ISMRT Annual Meeting and Exhibition. June 3-8, 2023; Toronto, Canada.
24. Zhou L, Wang Y, Pinho MC, et al. Intrasession Reliability of Arterial Spin-Labeled MRI-Measured Noncontrast Perfusion in Glioblastoma at 3 T. Tomography. 2020;6(2):139-147. doi:10.18383/j.tom.2020.00010
25. Galbán CJ, Chenevert TL, Meyer CR, et al. The parametric response map is an imaging biomarker for early cancer treatment outcome. Nat Med. 2009;15(5):572-576. doi:10.1038/nm.1919
26. Larsson C, Groote I, Vardal J, et al. Prediction of survival and progression in glioblastoma patients using temporal perfusion changes during radiochemotherapy. Magn Reson Imaging. 2020;68:106-112. doi:10.1016/j.mri.2020.01.012
27. Demidov V, Maeda A, Sugita M, et al. Preclinical longitudinal imaging of tumor microvascular radiobiological response with functional optical coherence tomography. Sci Rep. 2018;8(1):38. doi:10.1038/s41598-017-18635-w
28. Gai ND, Butman JA. Determining the optimal postlabeling delay for arterial spin labeling using subject‐specific estimates of blood velocity in the carotid artery. Magnetic Resonance Imaging. 2019;50(3):951-960. doi:10.1002/jmri.26670
29. Van Gelderen P, De Zwart JA, Duyn JH. Pittfalls of MRI measurement of white matter perfusion based on arterial spin labeling. Magn Reson Med. 2008;59(4):788-795. doi:10.1002/mrm.21515
Figures