0442
Altered Functional Connectivity of Resting State Networks in Children with Sensory Over-Responsivity But Not Autism1Department of Radiology and Biomedical Imaging, University of California San Francisco, San Francisco, CA, United States, 2Cortica Healthcare, San Rafael, CA, United States, 3Lifetime Neurodevelopmental Care Center, San Rafael, CA, United States
Synopsis
Keywords: Neuro, fMRI (resting state), Functional Connectivity, fMRI, Sensory Processing Disorder, Sensory Over-Responsivity
Motivation: Sensory Over-Responsivity (SOR) adversely impacts over 2.5% of children, prompting a study into its neural correlates in the absence of ASD to comprehend its unique effect on brain function.
Goal(s): We test the hypothesis that SOR in non-ASD children is linked to impaired connectivity in sensory networks and alterations in higher-order, regulatory networks.
Approach: Functional brain networks are constructed and analyzed using ICA, dual regression, fractional amplitude of low-frequency fluctuations (fALFF), and regional homogeneity (ReHo).
Results: SOR children exhibit increased functional connectivity in default-mode, frontoparietal, and salience networks, alongside reduced connectivity in visual and cerebellar networks, confirming a distinctive neural profile of SOR.
Impact: This study reveals distinct functional connectivity in SOR. It establishes a basis for novel interventions and tailored medical approaches for children, with or without ASD, encouraging further investigation into the neural basis and management of sensory processing disorders.
Introduction
While sensory processing differences (SPD) have been recognized in the context of autism for decades, the importance of sensory over-responsivity (SOR), a component of SPD, has only recently gained widespread neuroscience and community attention1. SOR is characterized by extreme negative reactions to innocuous, common sensory experiences. SOR is conservatively estimated to affect 2.5% of children in community samples and has substantial deleterious impact on learning and function at home, at school, and in the community2. Although resting state networks (RSNs) have been investigated in children with autism spectrum disorder (ASD) who exhibit SOR3,4, to our knowledge, there are no functional MRI (fMRI) studies of SOR in the absence of autism. In this work, we conduct a data-driven analysis of brain networks in school-age children with SOR but not ASD, compared to their community cohorts with neurodevelopmental concerns including SPD, but not SOR or ASD. We hypothesize impaired functional connectivity (FC) in sensory-related networks in SOR, but also elevated activity in higher-order cortical networks that inhibit responses to stimuli and regulate behavior.Methods
Children ages 8-12 years referred for neurodevelopmental concerns underwent structured clinical evaluation with the Sensory Processing 3 Dimensions Assessment (SP3D:A)5 to distinguish those with SOR from those without. Functional MRI scanning was performed for 6 minutes and 10 seconds on a 3T Siemens Prisma (TE: 32.4ms, TR: 1290ms, 2.2mm voxels, multiband factor 4) with eyes open watching a fixation cross. Image quality control was conducted by two raters to eliminate scans with excessive motion, ghosting, or ringing in T1 (MPRAGE with 1 mm voxels) or fMRI. The first two volumes from each fMRI scan were discarded. fMRIPrep6 facilitated susceptibility distortion correction using acquired AP and PA field map scans, spatial normalization to the MNI Pediatric Asym Cohort 4 (ages 7.5-13.5 years) 2mm template, and denoising using ICA-AROMA7, white matter, cerebrospinal fluid, and cosine regressors (128s cutoff). Subjects with a mean framewise displacement (FD) over 0.5 mm were excluded, resulting in 96 participants. Of these, 13 subjects were excluded for meeting research criteria for ASD. SUSAN filtering (6 mm FWHM) was applied for smoothing. FSL’s MELODIC8 was used to compute RSNs with 17-component decomposition. Subject-specific parameter maps were generated for each network via dual regression (DR). Further network-wise analyses were conducted using the fALFF and ReHo measures of frequency-specific and regional FC, respectively, from the Configurable Pipeline for the Analysis of Connectomes (C-PAC)9. Given its greater sensitivity to motion degradation than fALFF or ReHo, network FC from MELODIC dual regression was based on a subset of 58 children with the least motion (mean FD< 0.25mm).Results
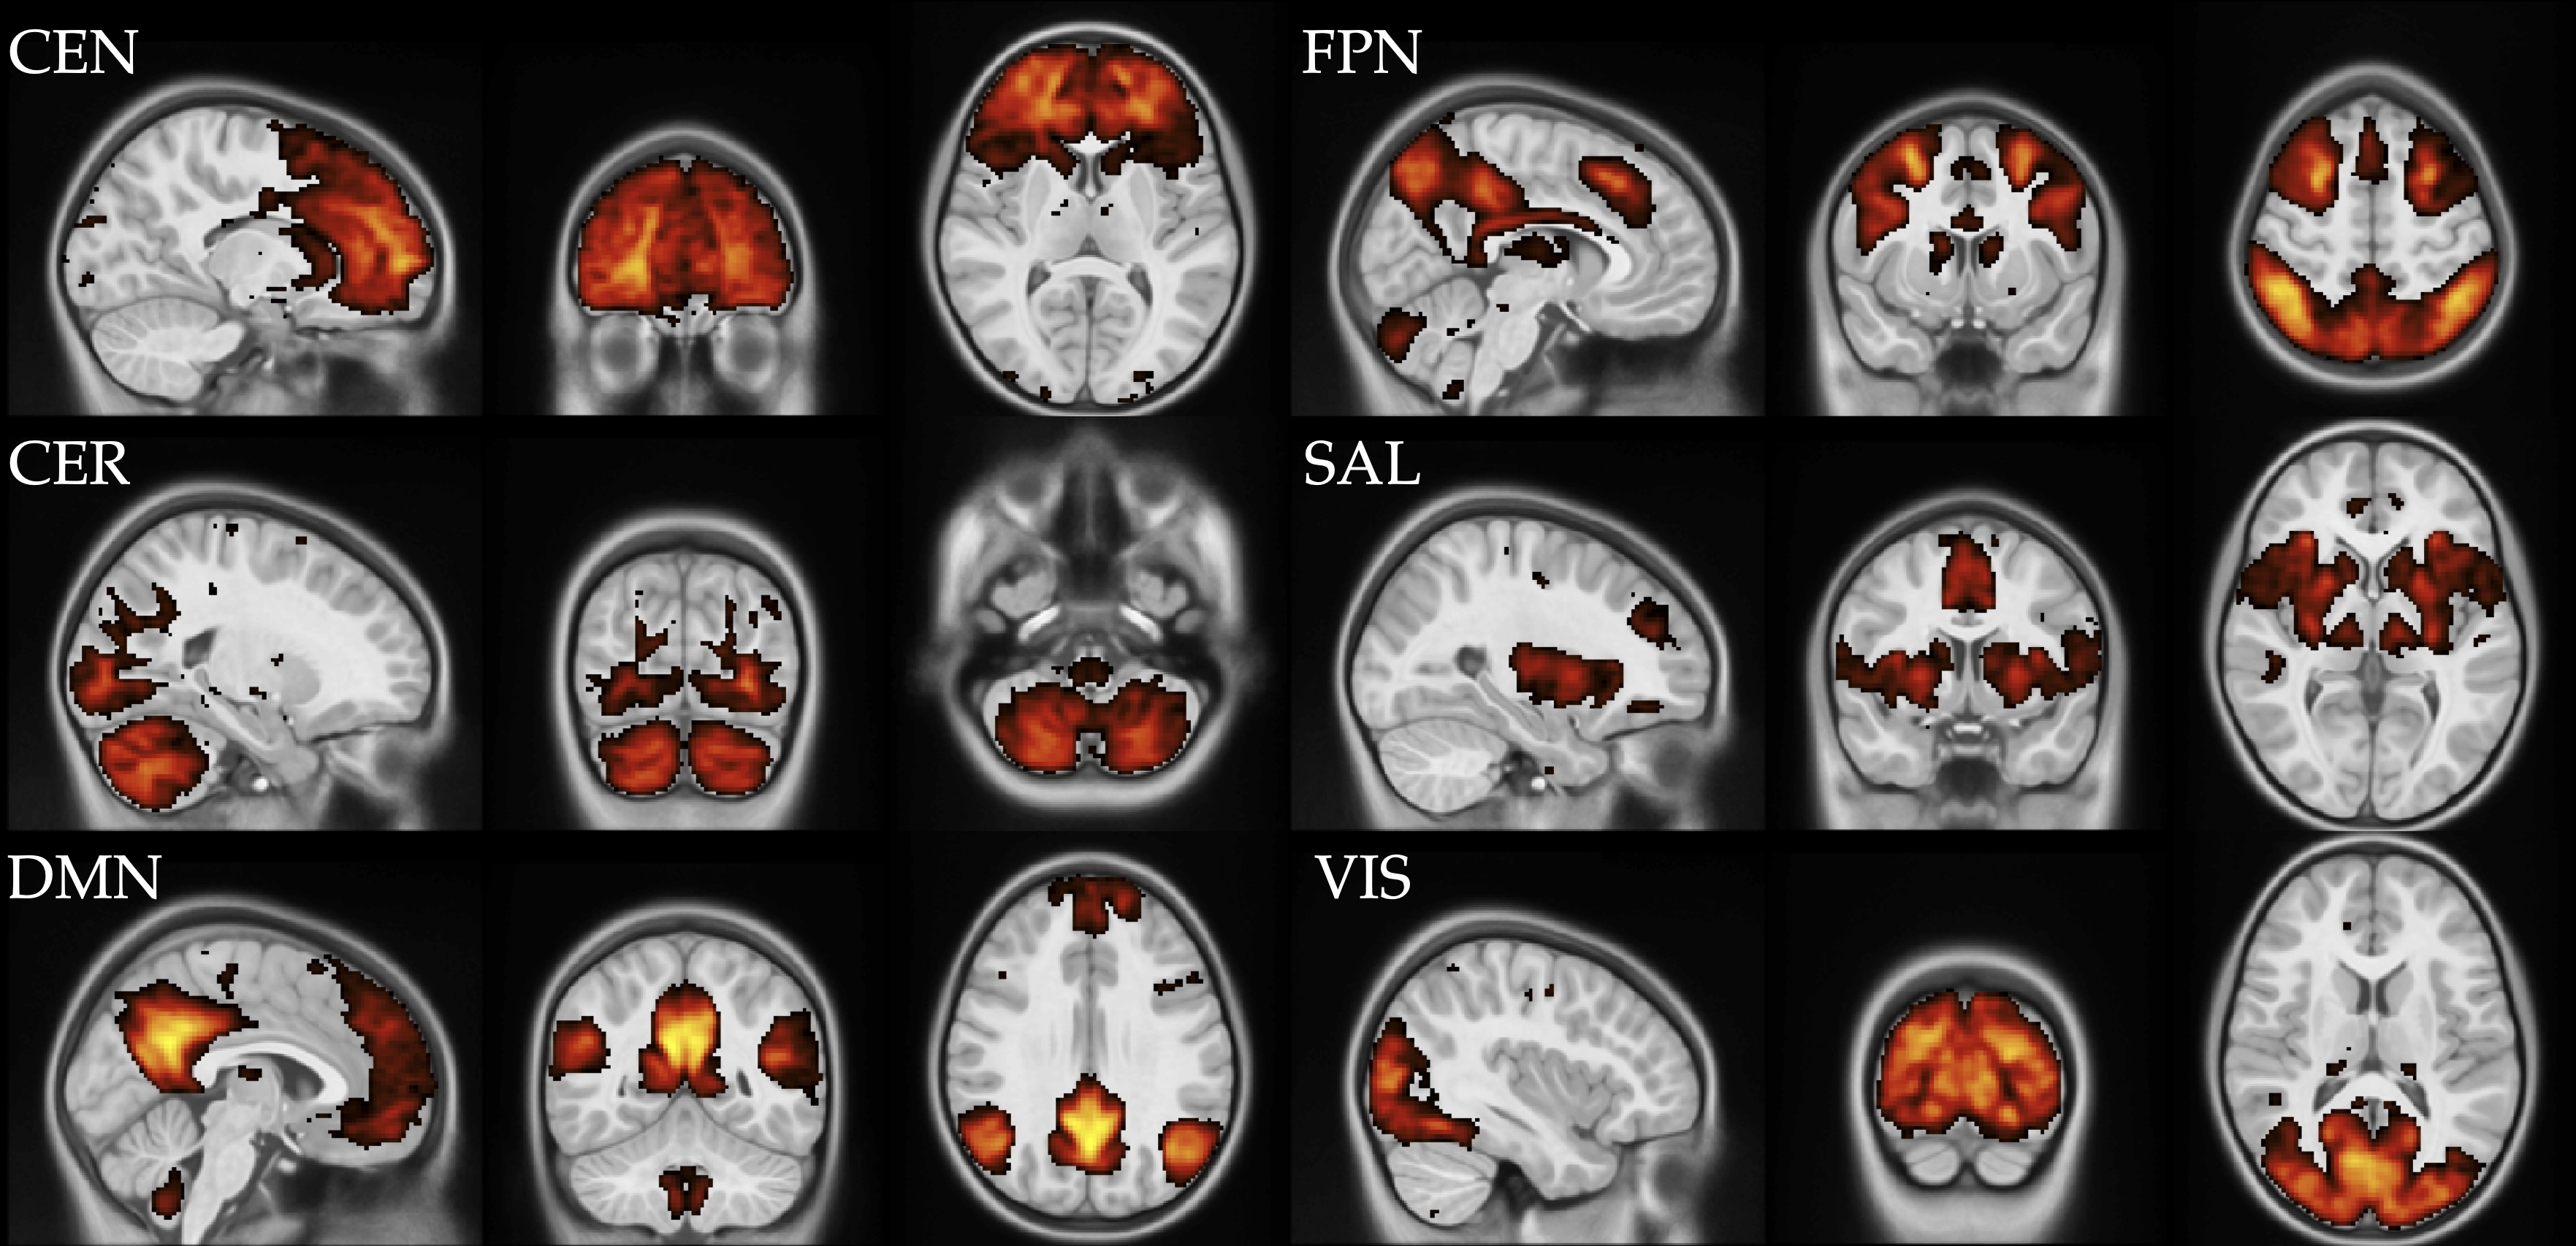
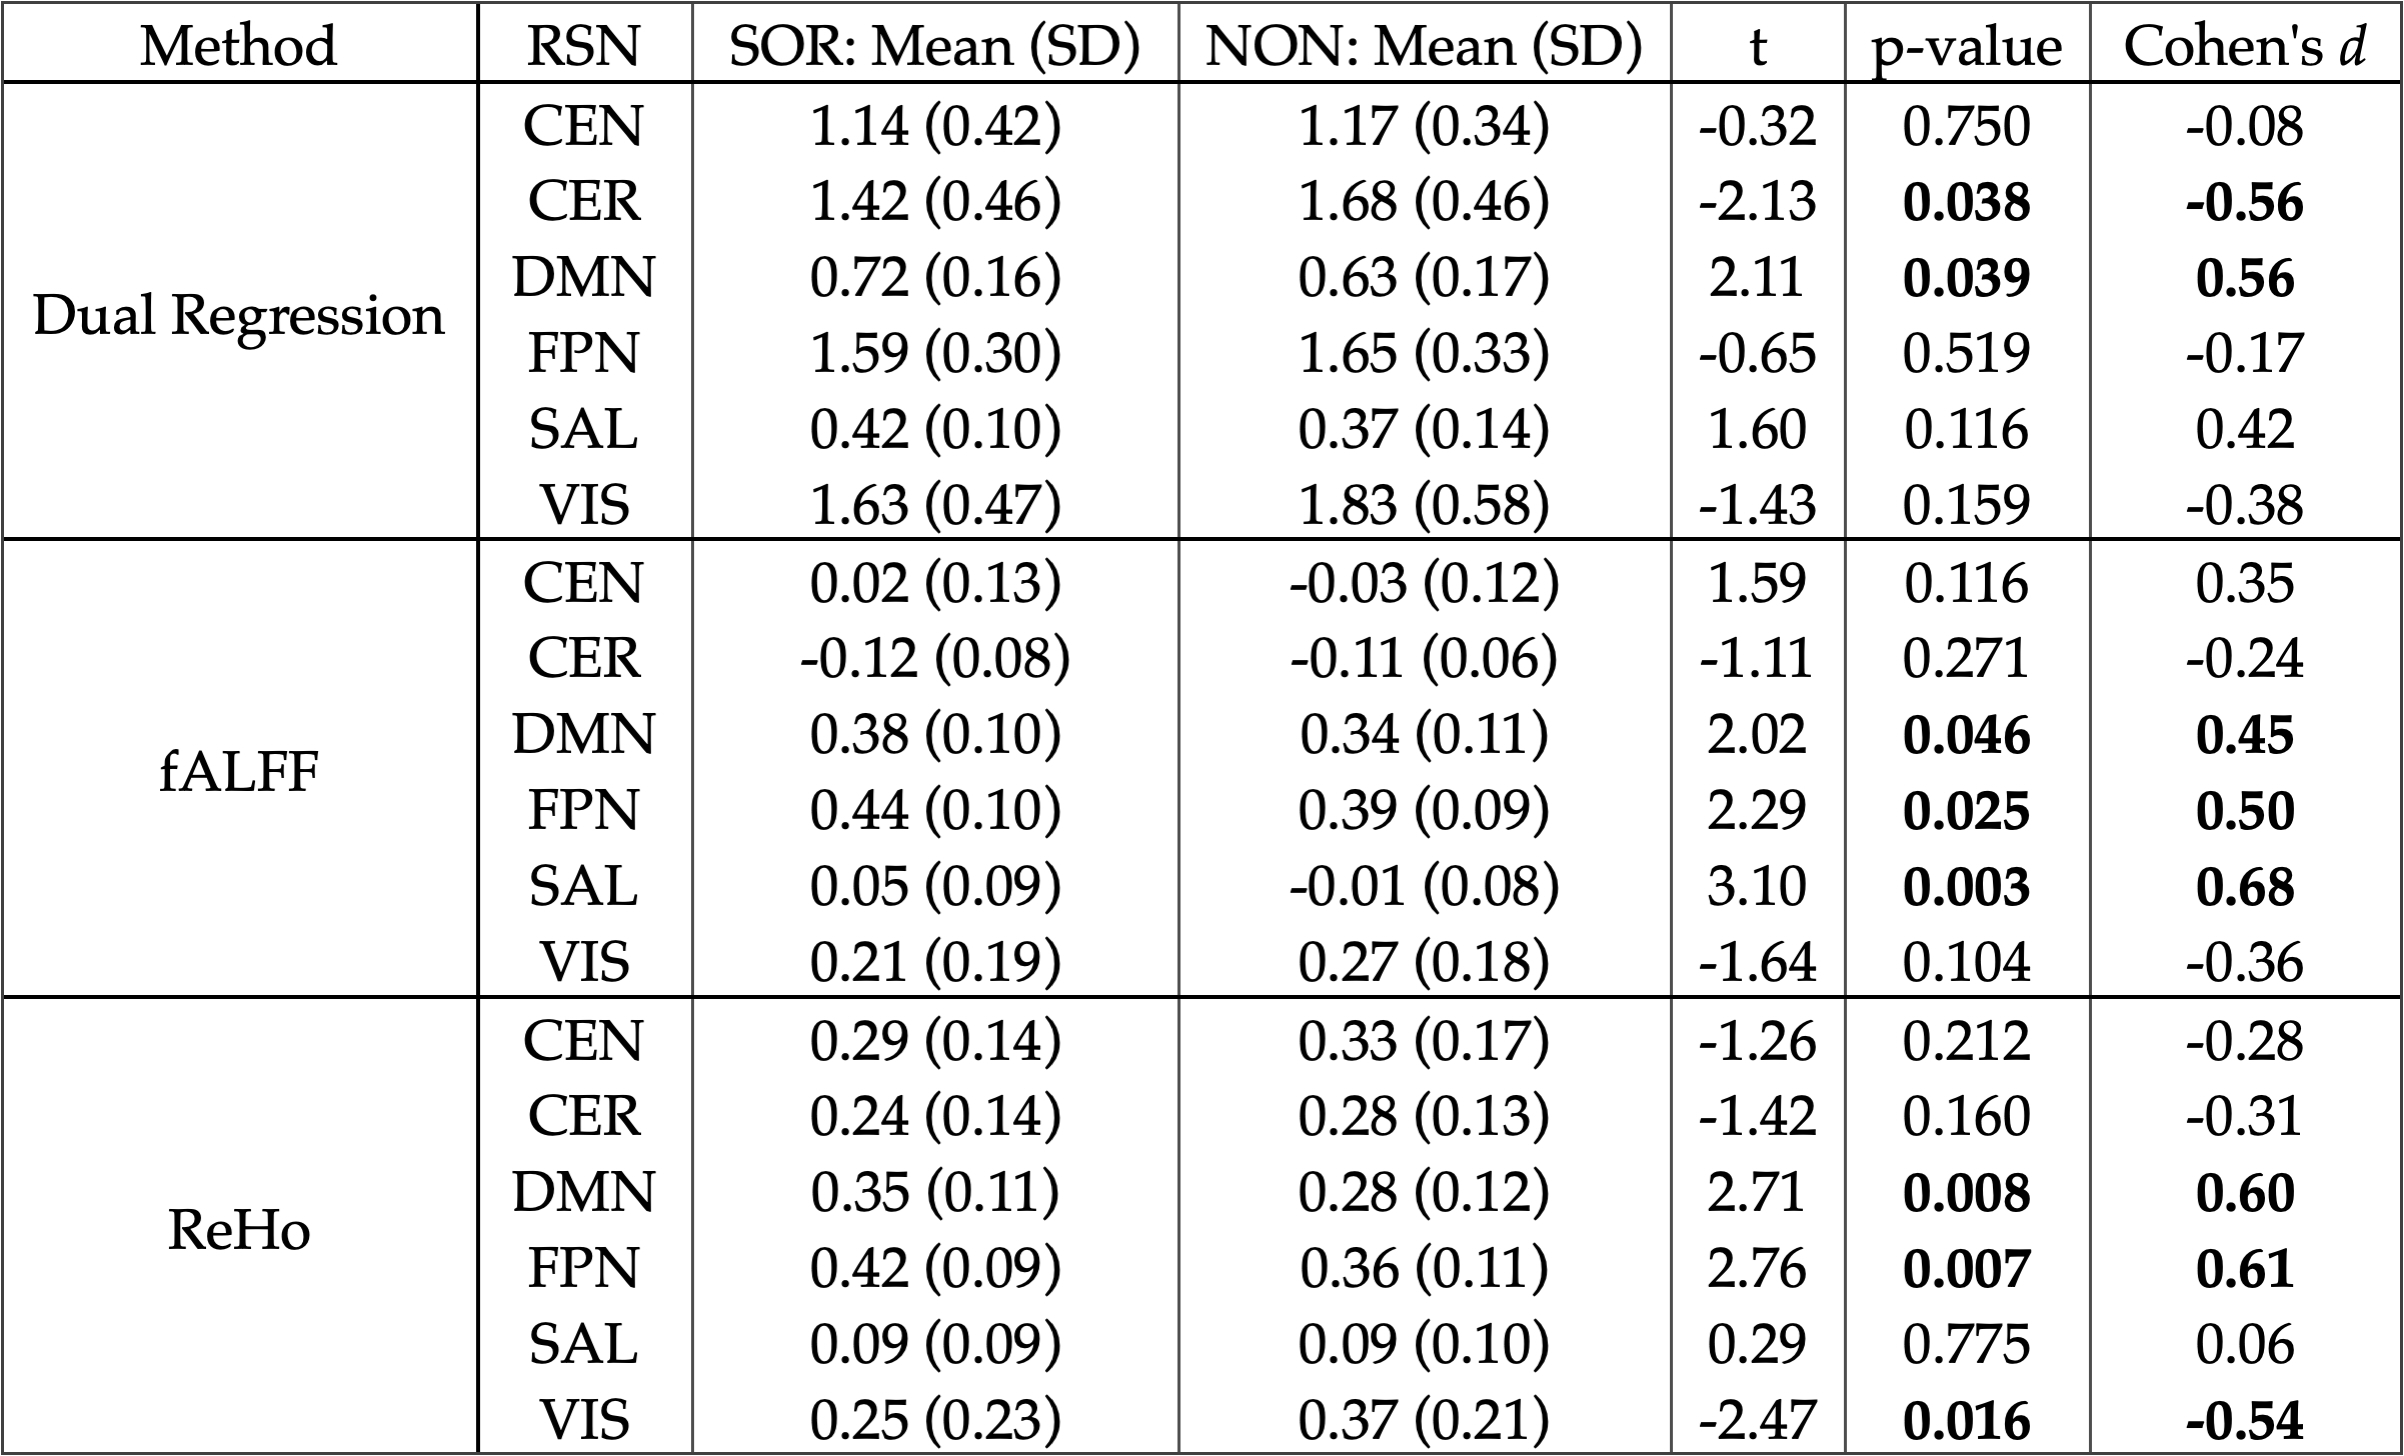
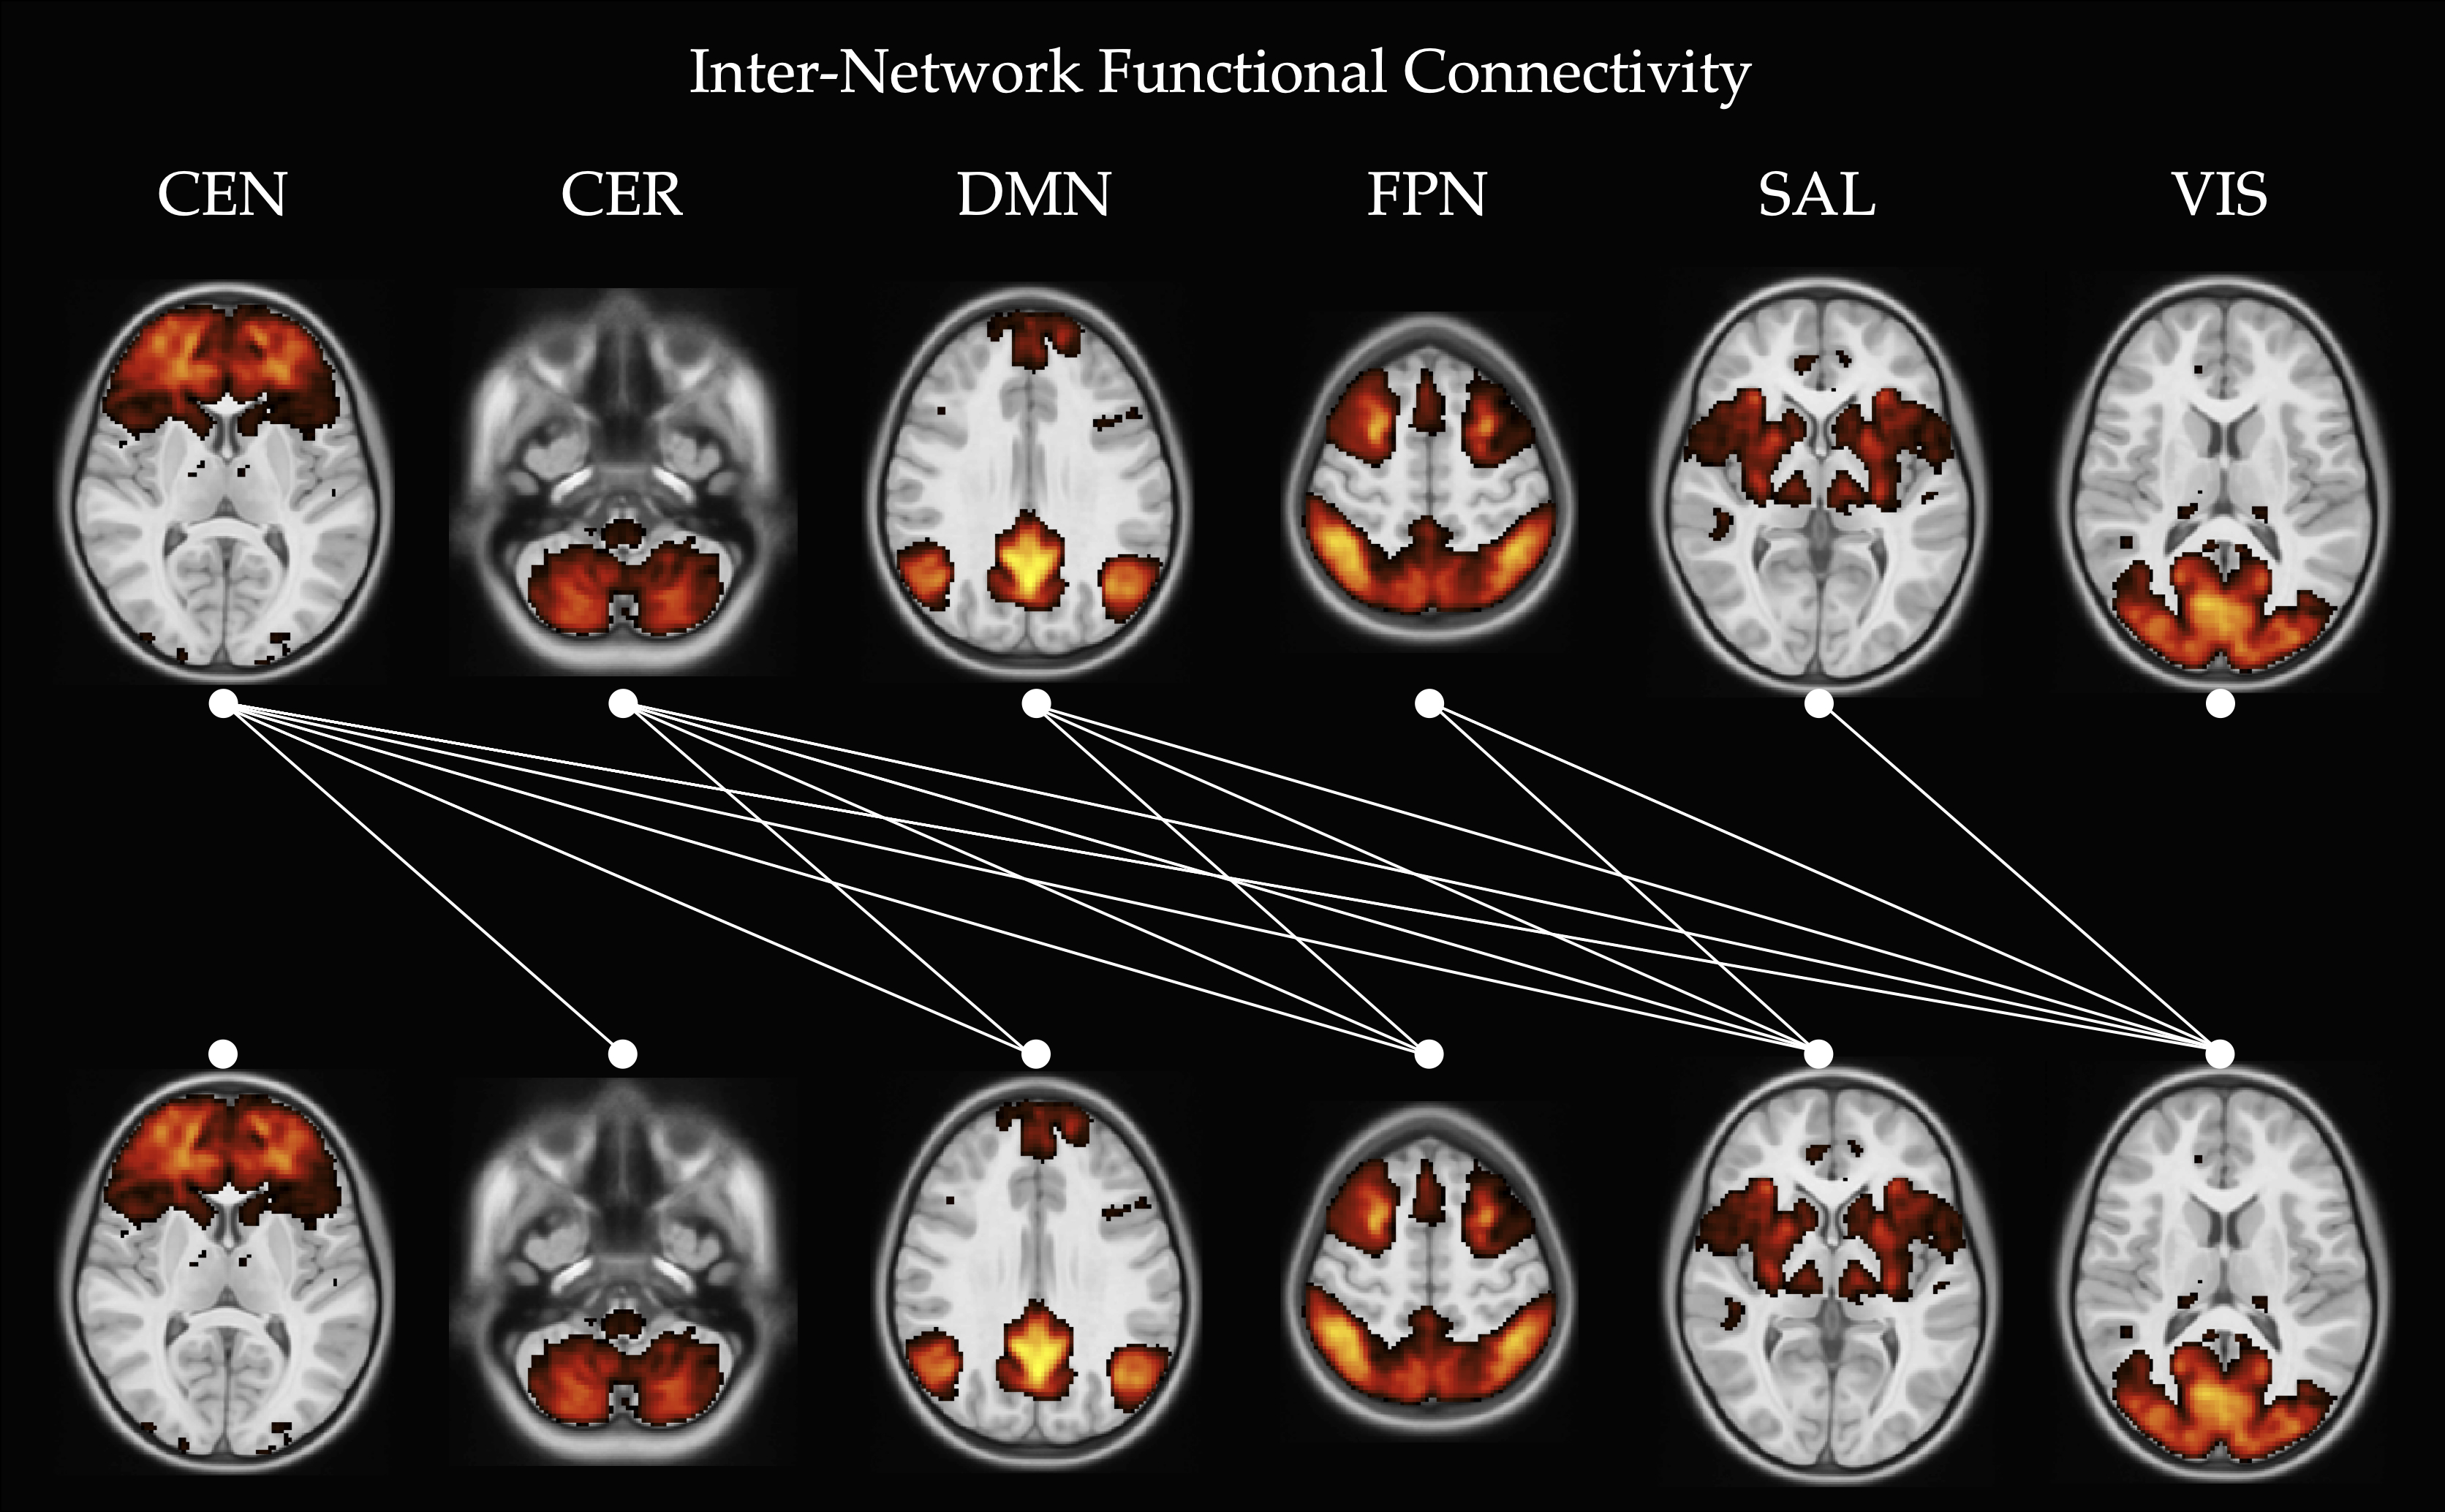
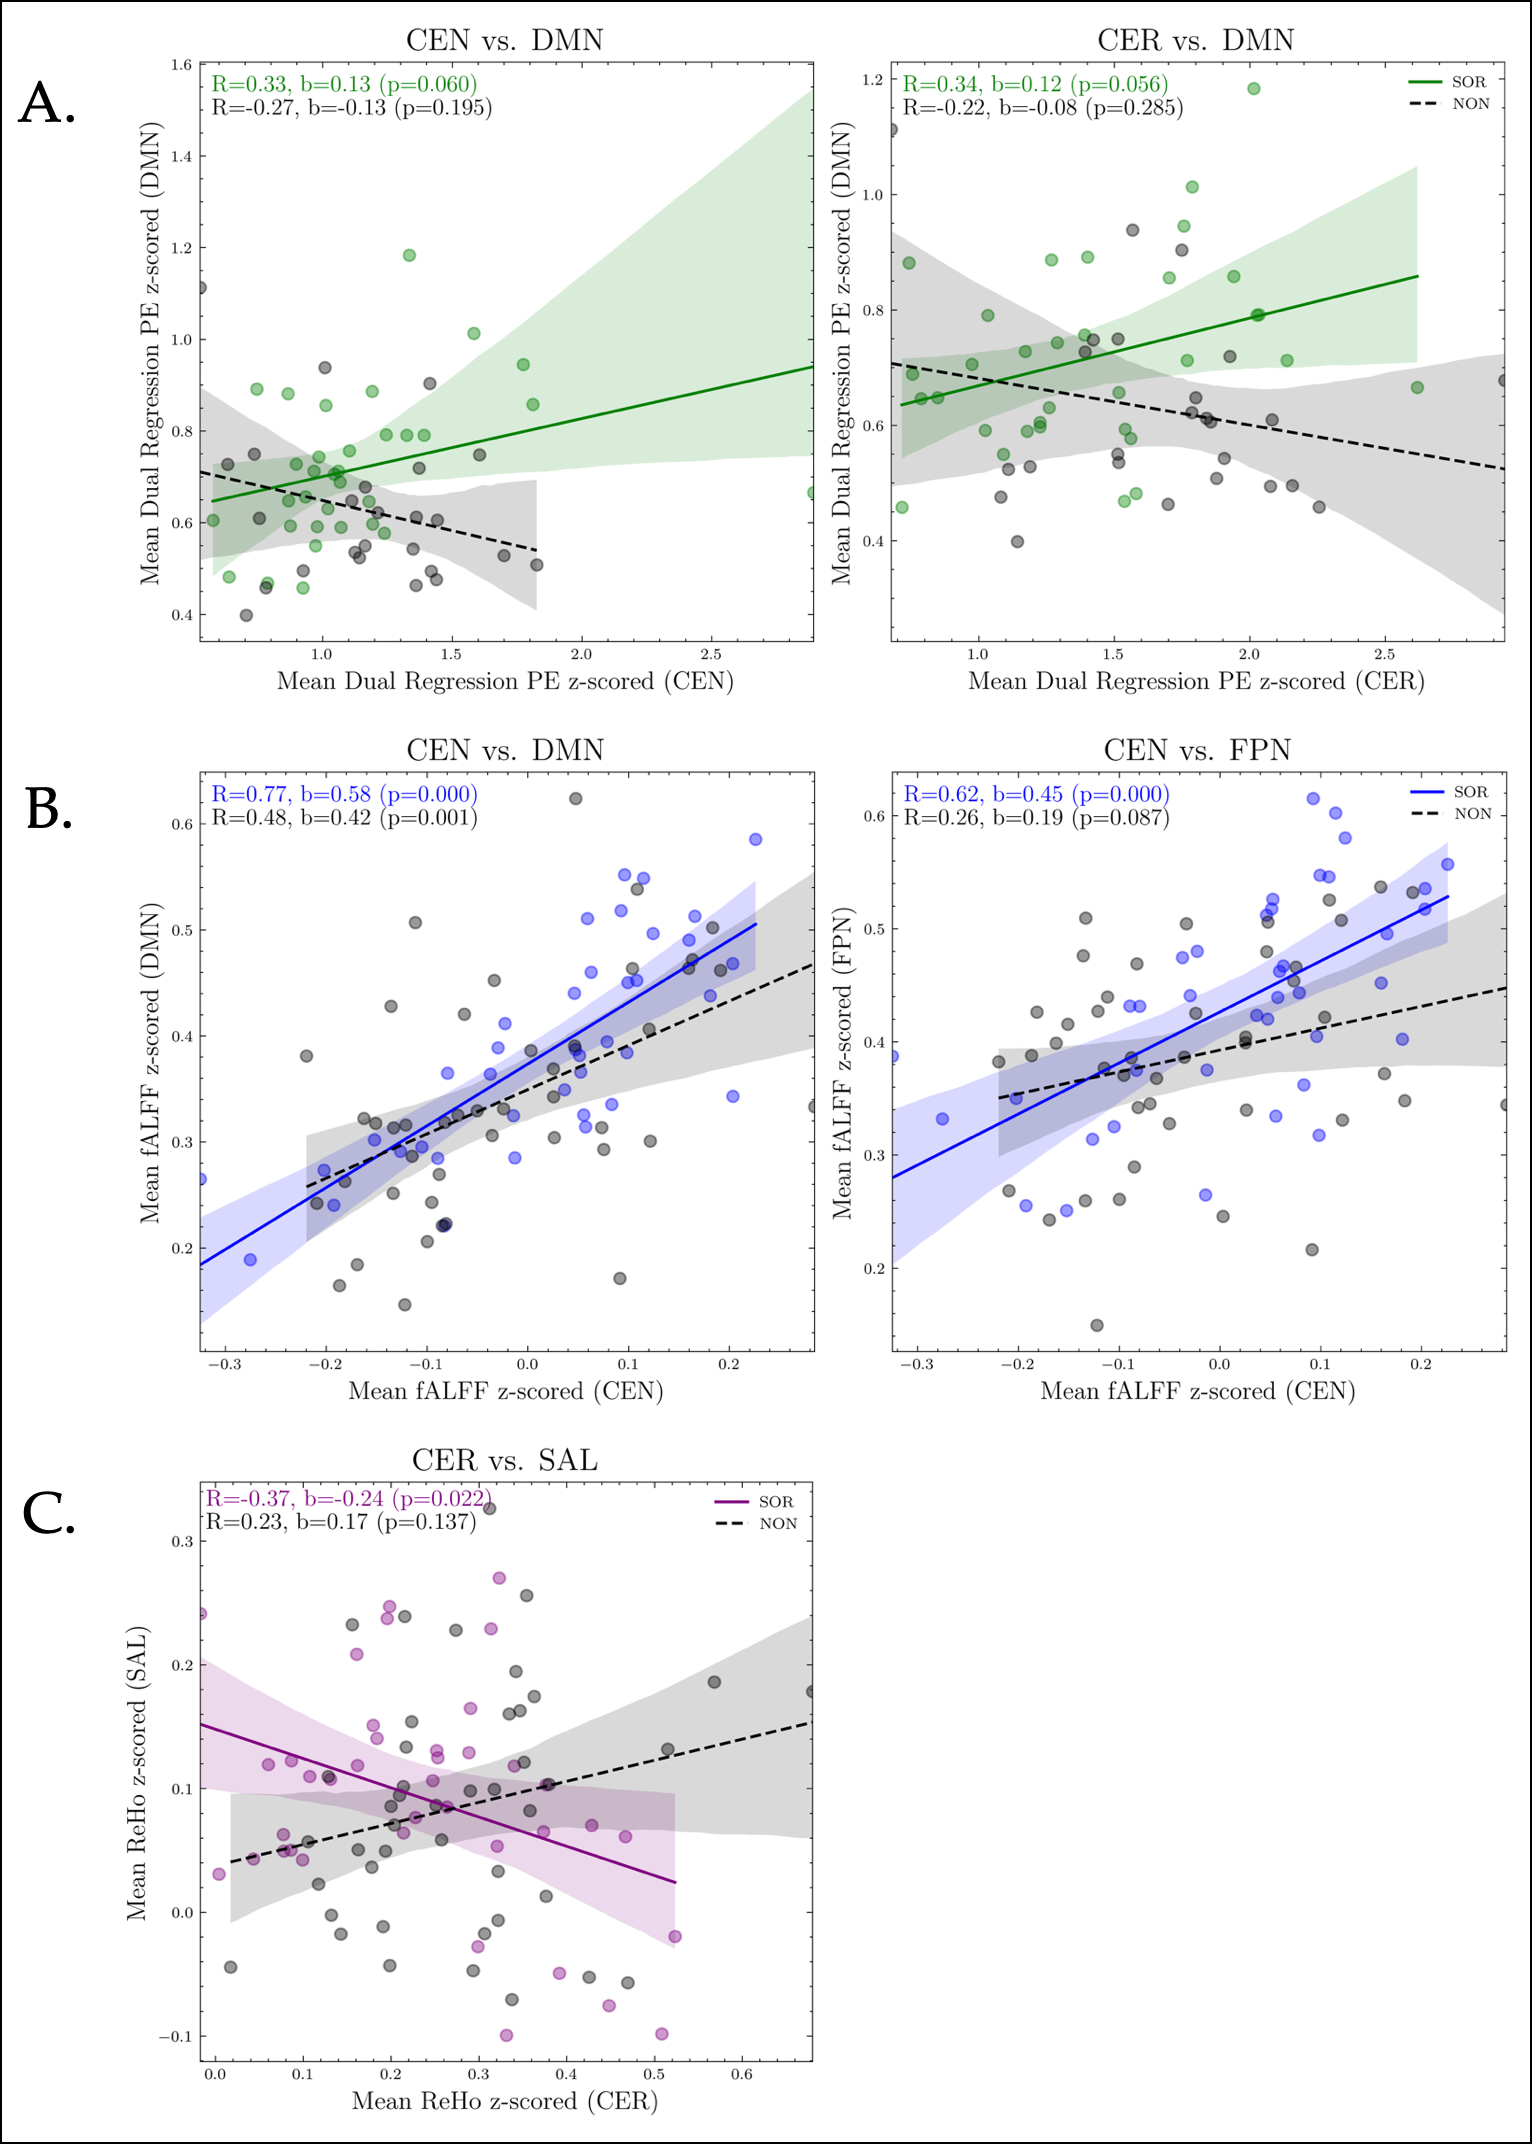
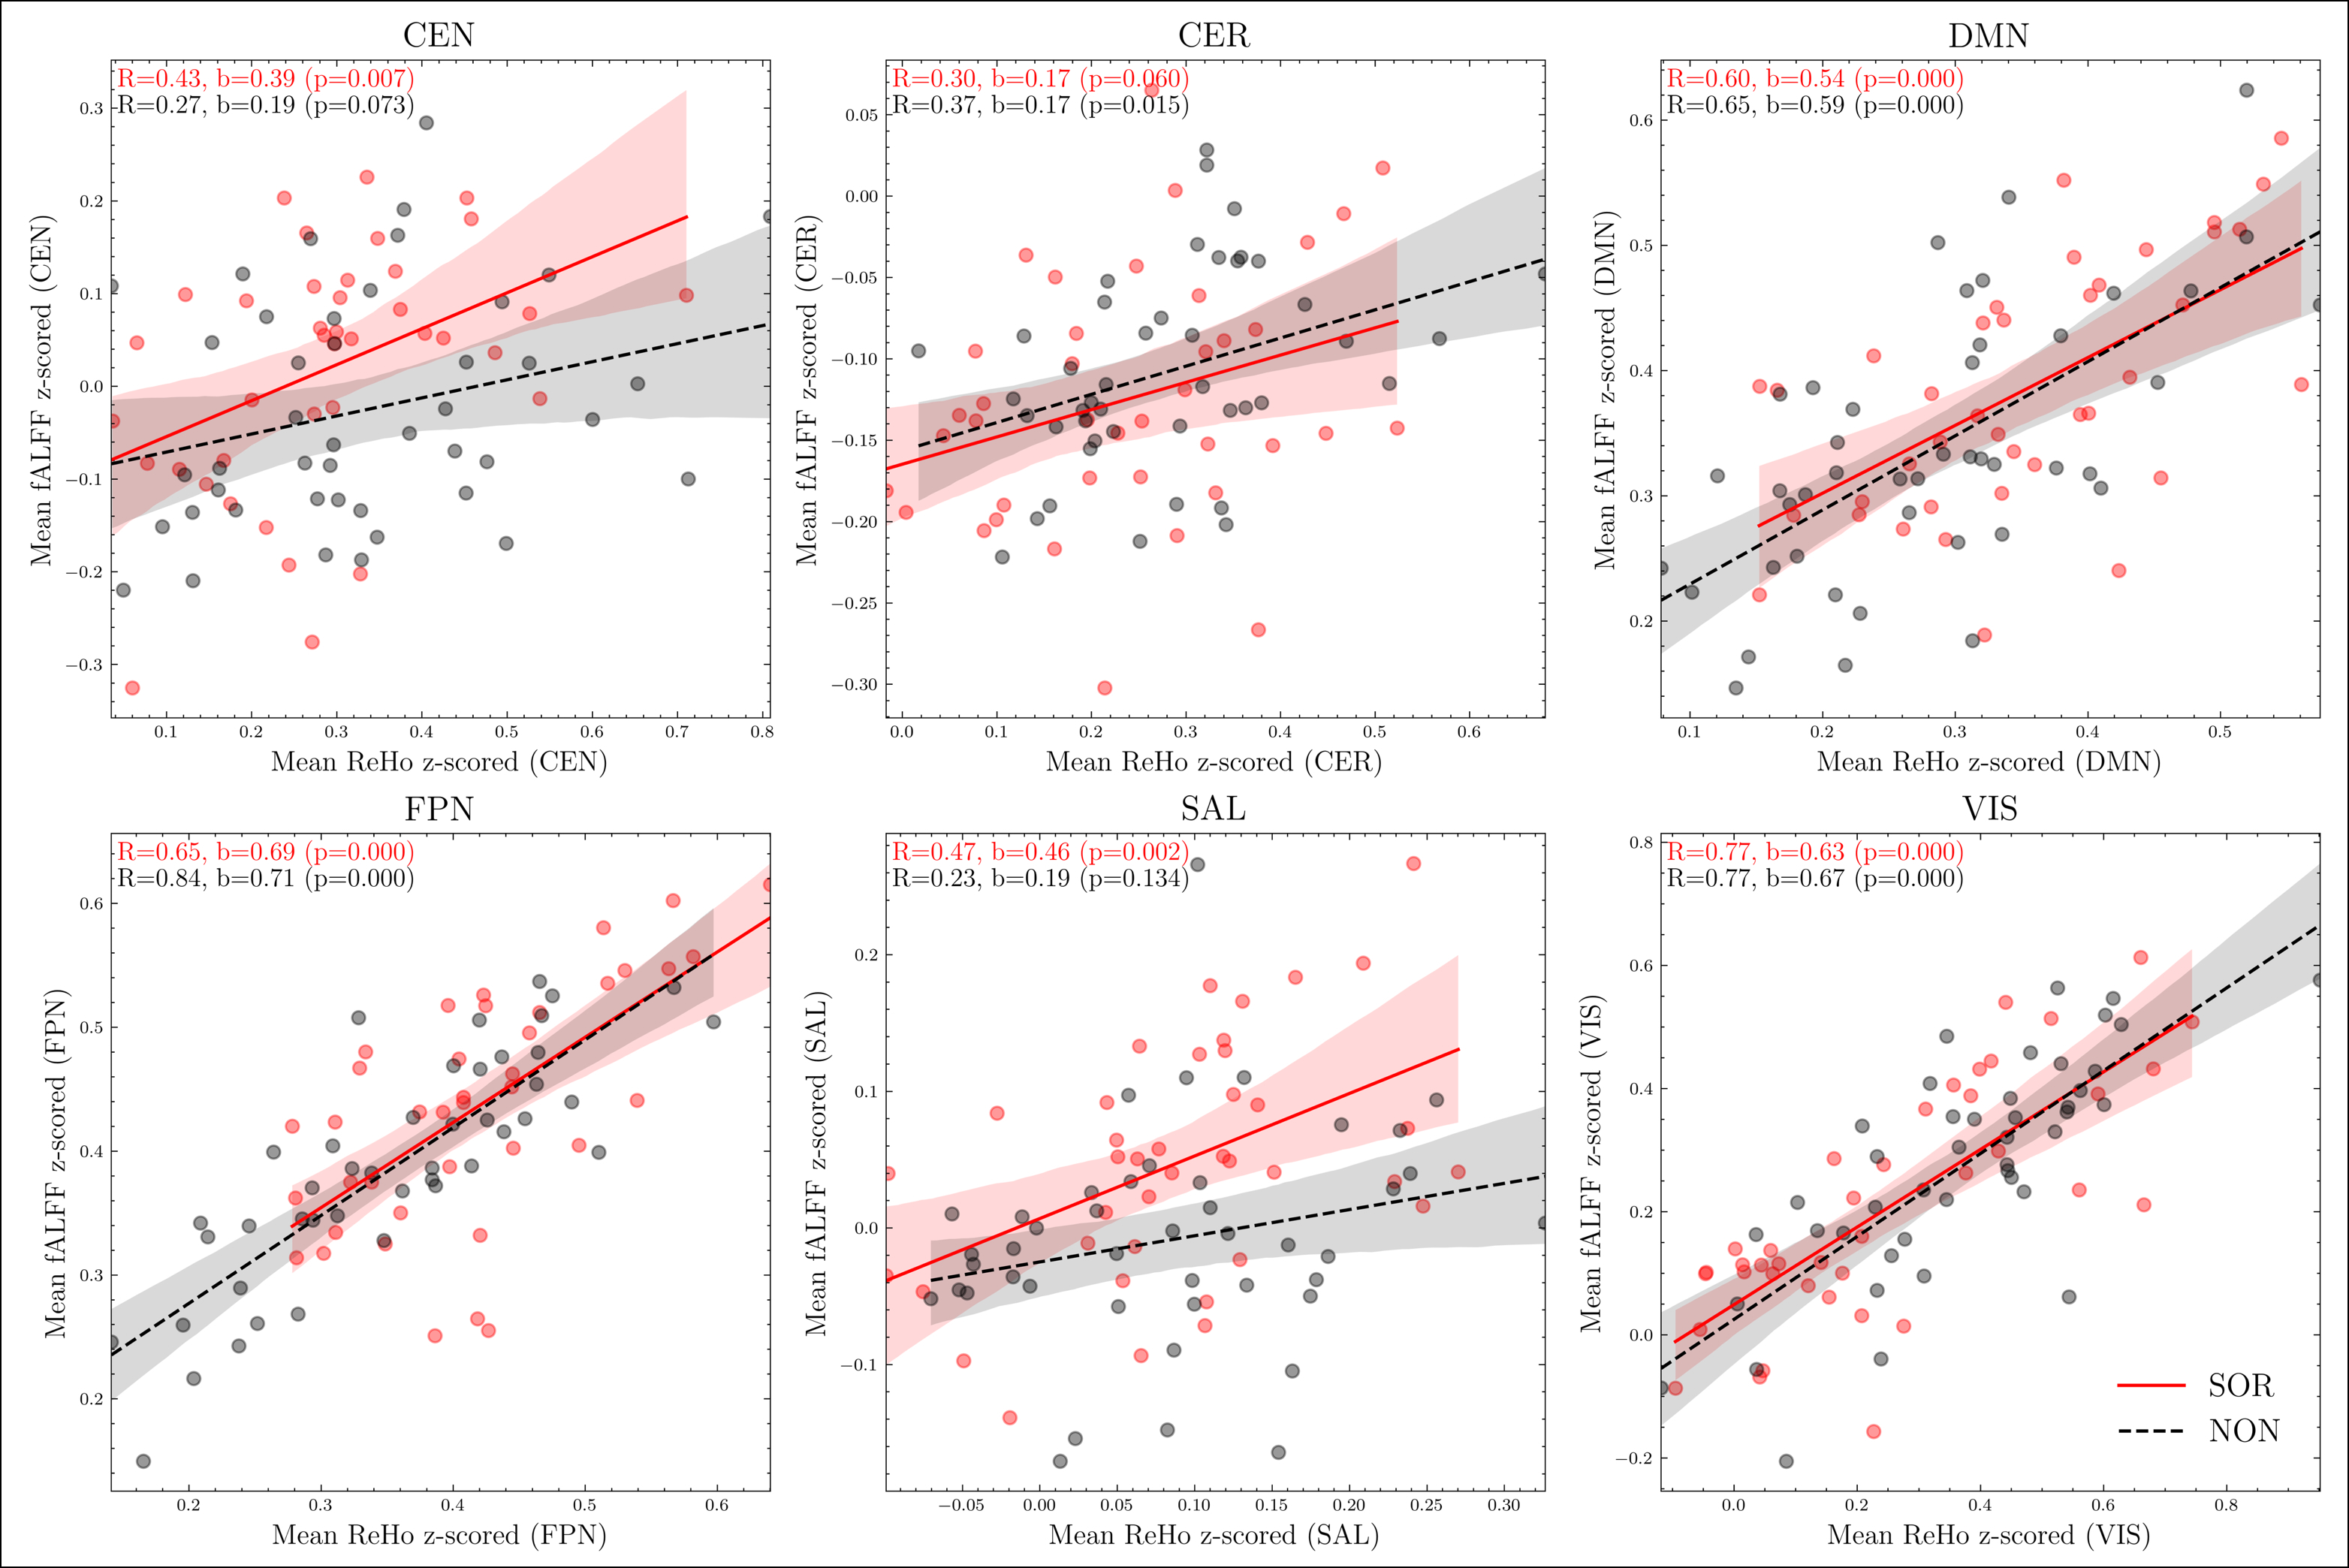
MELODIC dual regression yielded 6 robust resting state networks: the central executive (CEN), cerebellar (CER), default mode (DMN), frontoparietal (FPN), salience (SAL), and visual (VIS) networks (Fig. 1). Functional connectivity in DMN was significantly greater in SOR than non-SOR on DR, fALFF and ReHo metrics (Fig. 2). The SOR group also had higher FC in the FPN by fALFF and ReHo but not DR. SOR exhibited greater FC in SAL by fALFF with a trend towards higher FC on the DR metric, too. Conversely, VIS showed lower FC in SOR versus non-SOR on the ReHo metric, with trends toward lower values on the DR and fALFF measures. Finally, CER also displayed lower FC in SOR on the DR metric, with trends toward lower values on fALFF and ReHo metrics as well. No significant FC differences were found for CEN between SOR and non-SOR. Exploratory analyses of inter-network interactions (Fig. 3) suggest that the SOR group has an anomalously positive DR correlation between the task-negative DMN and task-positive networks such as CEN and CER, whereas the correlation is negative for the non-SOR group (Fig. 4A). Conversely, the SOR group has a negative ReHo correlation between CER and SAL, whereas the non-SOR group trends positive (Fig. 4C). Furthermore, the SOR group shows stronger intra-network correlations between fALFF and ReHo than the non-SOR group for the CEN and SAL networks (Fig. 5).Conclusions
Data-driven analysis of resting state fMRI networks show evidence supporting the hypothesis of reduced FC of sensory and cerebellar networks in children with SOR compared to those with developmental concerns but not SOR, even in the absence of clinical ASD. Conversely, the SOR group exhibited greater FC than non-SOR in most higher-order cortical networks, including DMN, FPN and SAL. Exploratory analyses also indicate altered network interactions and ratio of low-frequency activity to regional homogeneity in SOR; however, these observations need to be confirmed in future hypothesis-driven studies.Acknowledgements
The study was funded by a National Institute of Health R01 grant, award number 5R01MH116950.References
1. DeBoth, K.K. and Reynolds, S., 2017. A systematic review of sensory-based autism subtypes. Research in Autism Spectrum Disorders, 36, pp.44-56.
2. Van Hulle, C. et al., 2015. Trajectories of sensory over-responsivity from early to middle childhood: Birth and temperament risk factors. PLoS ONE, 10(5), e0129968.
3. Green, S.A. et al., 2015. Neurobiology of Sensory Overresponsivity in Youth With Autism Spectrum Disorders. JAMA Psychiatry, 72(8), pp.778-786.
4. Green, S.A. et al., 2016. Salience Network Connectivity in Autism Is Related to Brain and Behavioral Markers of Sensory Overresponsivity. Journal of the American Academy of Child & Adolescent Psychiatry, 55(7), pp.618-626.
5. Mulligan, S., Schoen, S.A., Miller, L.J., Valdez, A. and Magalhaes, D., 2019. The sensory processing 3-dimensions scale: initial studies of reliability and item analyses. The Open Journal of Occupational Therapy, 7(1), article 4.
6. Esteban, O. et al., 2019. fMRIPrep: a robust preprocessing pipeline for functional MRI. Nature Methods, 16, pp.111-116.
7. Pruim, R.H., Mennes, M., van Rooij, D., Llera, A., Buitelaar, J.K. and Beckmann, C.F., 2015. ICA-AROMA: A robust ICA-based strategy for removing motion artifacts from fMRI data. NeuroImage, 112, pp.267-277.
8. Beckmann, C.F. and Smith, S.M., 2004. Probabilistic independent component analysis for functional magnetic resonance imaging. IEEE Transactions on Medical Imaging, 23(2), pp.137-152.
9. Craddock, C. et al. (2013) 'Towards Automated Analysis of Connectomes: The Configurable Pipeline for the Analysis of Connectomes (C-PAC)', Front. Neuroinform., Conference Abstract: Neuroinformatics 2013. doi: 10.3389/conf.fninf.2013.09.00042.
Figures