0440
Distinct Neuroimaging Subtypes within ADHD Population Based on Semi-supervised Learning1Department of Biomedical Engineering, Zhejiang University, Hangzhou, China, 2Department of Developmental and Behavioral Pediatrics, Shanghai Jiao Tong University School of Medicine, Shanghai, China
Synopsis
Keywords: Psychiatric Disorders, Psychiatric Disorders, Cortical Thickness, Disease Subtype, Generative Adversarial Network
Motivation: Attention deficit hyperactivity disorder (ADHD) is a childhood-onset disease whose diagnosis and subtyping methods are primarily based on clinical traits, which is prone to subjectivity and instability. Also, the patient outcome and neuroimaging signatures of these subtypes are not clear.
Goal(s): We aimed to use a data-driven approach for subtyping.
Approach: We used a semi-supervised learning method based on 929 ADHD patients selected from ABCD study.
Results: We identified three distinct subtypes in ADHD based on cortical thickness (under-developed, over-developed, and mixed subtypes). Follow-up analysis found significant differences in cognitive and behavior outcomes, disease progression, and response to medication among the subtypes.
Impact: We identified three distinct subtypes in ADHD based on cortical thickness (under-developed, over-developed, and mixed subtypes), with unique cognitive, behavioral, progression profiles, and treatment responses. These findings may shed insights into personalized treatment in ADHD.
Introduction
Attention deficit hyperactivity disorder (ADHD) patients are typically categorized as atypical inattention, hyperactivity, and/or impulsivity based on clinical symptoms1. However prior studies did not find consistent neuroimaging or medical differences among the three subtypes2–4. To make matters worse, clinical assessments are quite subjective and instable, which may lead to mis-diagnosis. On the other hand, neuroimaging measurements are objective and highly reproducible. Therefore, our study tested a data-driven method to identify subtypes based on cortical thickness (CT), with comprehensive internal and external validations to understand the clinical significance of these subtypes.Method
Data preparationWe used the data from the ABCD(V5) study. ADHD samples were selected based on Kiddie Schedule of Affective Disorders and Schizophrenia for DSM-5 (KSADS-COMP)5. Subjects missing imaging data or covariates (e.g., age, sex, site, race, ethnic, social economic status, and birth maternal conditions) were excluded and we settled with 929 subjects in ADHD group and 5580 subjects in control group. FreeSurfer6 (version 6.0.0) was used for image processing, and covariates are regressed out using Neuro-Combat7.
Semi-supervised deep learning for disease subtyping
We employed SeMI-supervised cLustEring via Generative Adversarial Network (Smile-GAN)8, a nonlinear semi-supervised deep learning algorithm seeking disease subtypes in adolescent with ADHD. Smile-GAN captured the sparse effects of disease on normal measures, using a GAN to synthesize patient data from normal measures such that the synthesized data were indistinguishable from real patient data. Estimated latent variables were used to capture the heterogeneity of the synthesizing process and identify the disease subtype.
Smile-GAN was applied to the CT measures of the baseline ABCD data. We assessed solutions with 2-7 clusters and an ideal choice of 3 was chosen according to Adjusted Rand Index (ARI)9. We did a permutation test using Smile-GAN to cluster random shuffled disease and control datasets 100 times. Comparing the ARI of the actual dataset and the permutation test ARI result, the actual dataset ranked at P < 0.05 to determine the statistical significance of such a choice.
Internal and external validations
To confirm the robustness of the result, we compared the neuroimaging, psychopathology and comorbidity between subtypes and control, and used linear SVM to prove the diagnostic value of the subtypes as internal validation. We further confirmed the results leveraging the longitudinal ABCD data and independent ADHD-20010 data as external validation.
Results
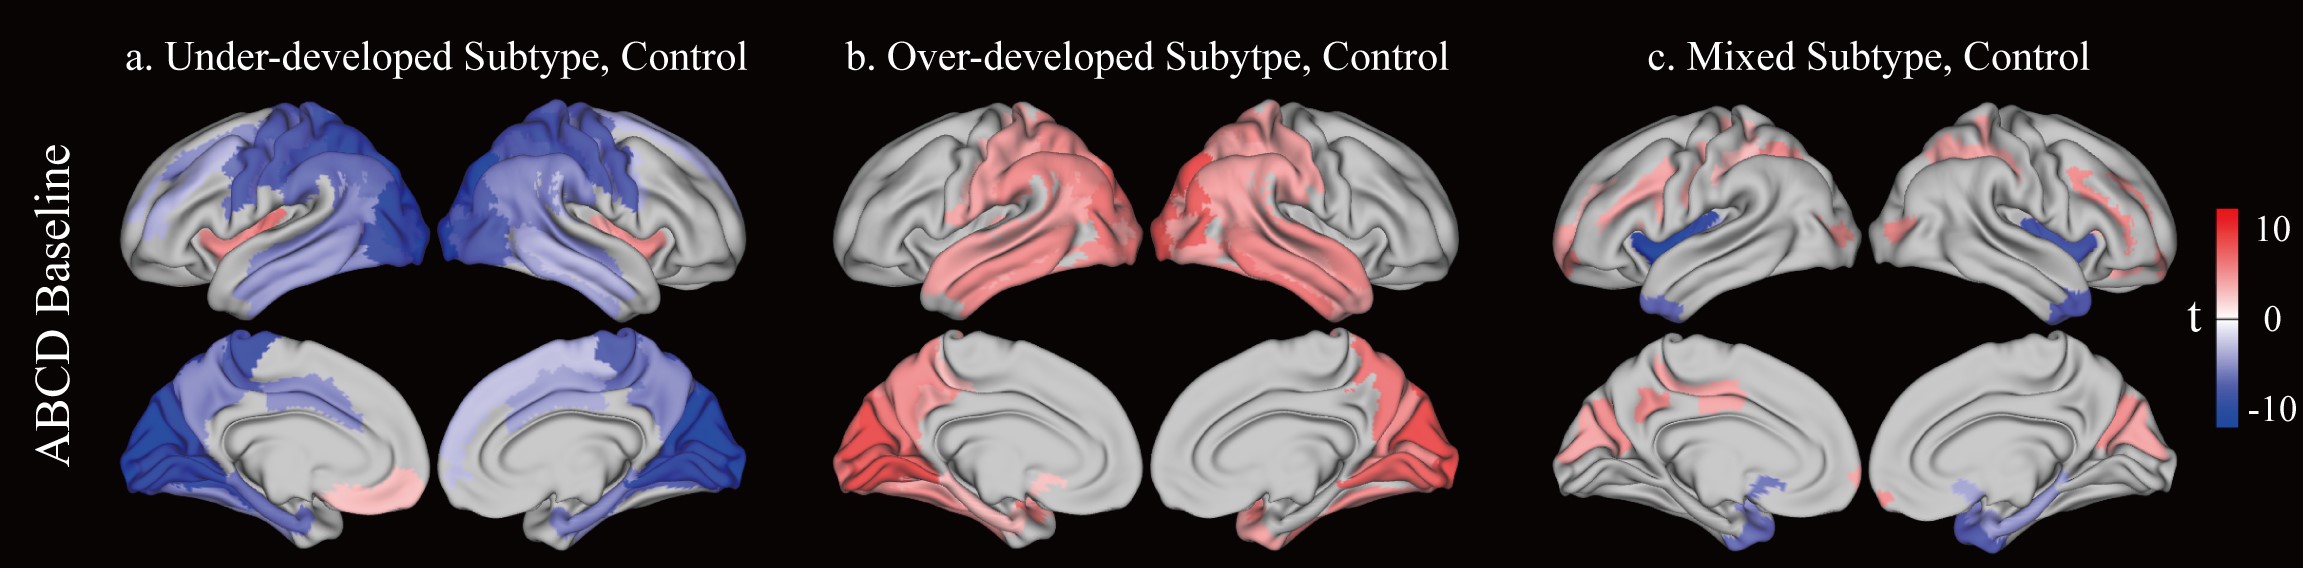
Subtype identification and external validationWe identified three subtypes with distinct CT patterns with respect to the controls at PFDR < 0.005 (Fig. 1A). Subtype 1 showed lower CT in posterior regions (namely underdeveloped subtype, n=363), subtype 2 exhibited higher CT in posterior regions (namely over-developed subtype, n=322), and subtype 3 was characterized by higher CT scattered in dorsal, prefrontal, and posterior regions and lowered CT in temporal regions (namely mixed subtype, n=244).
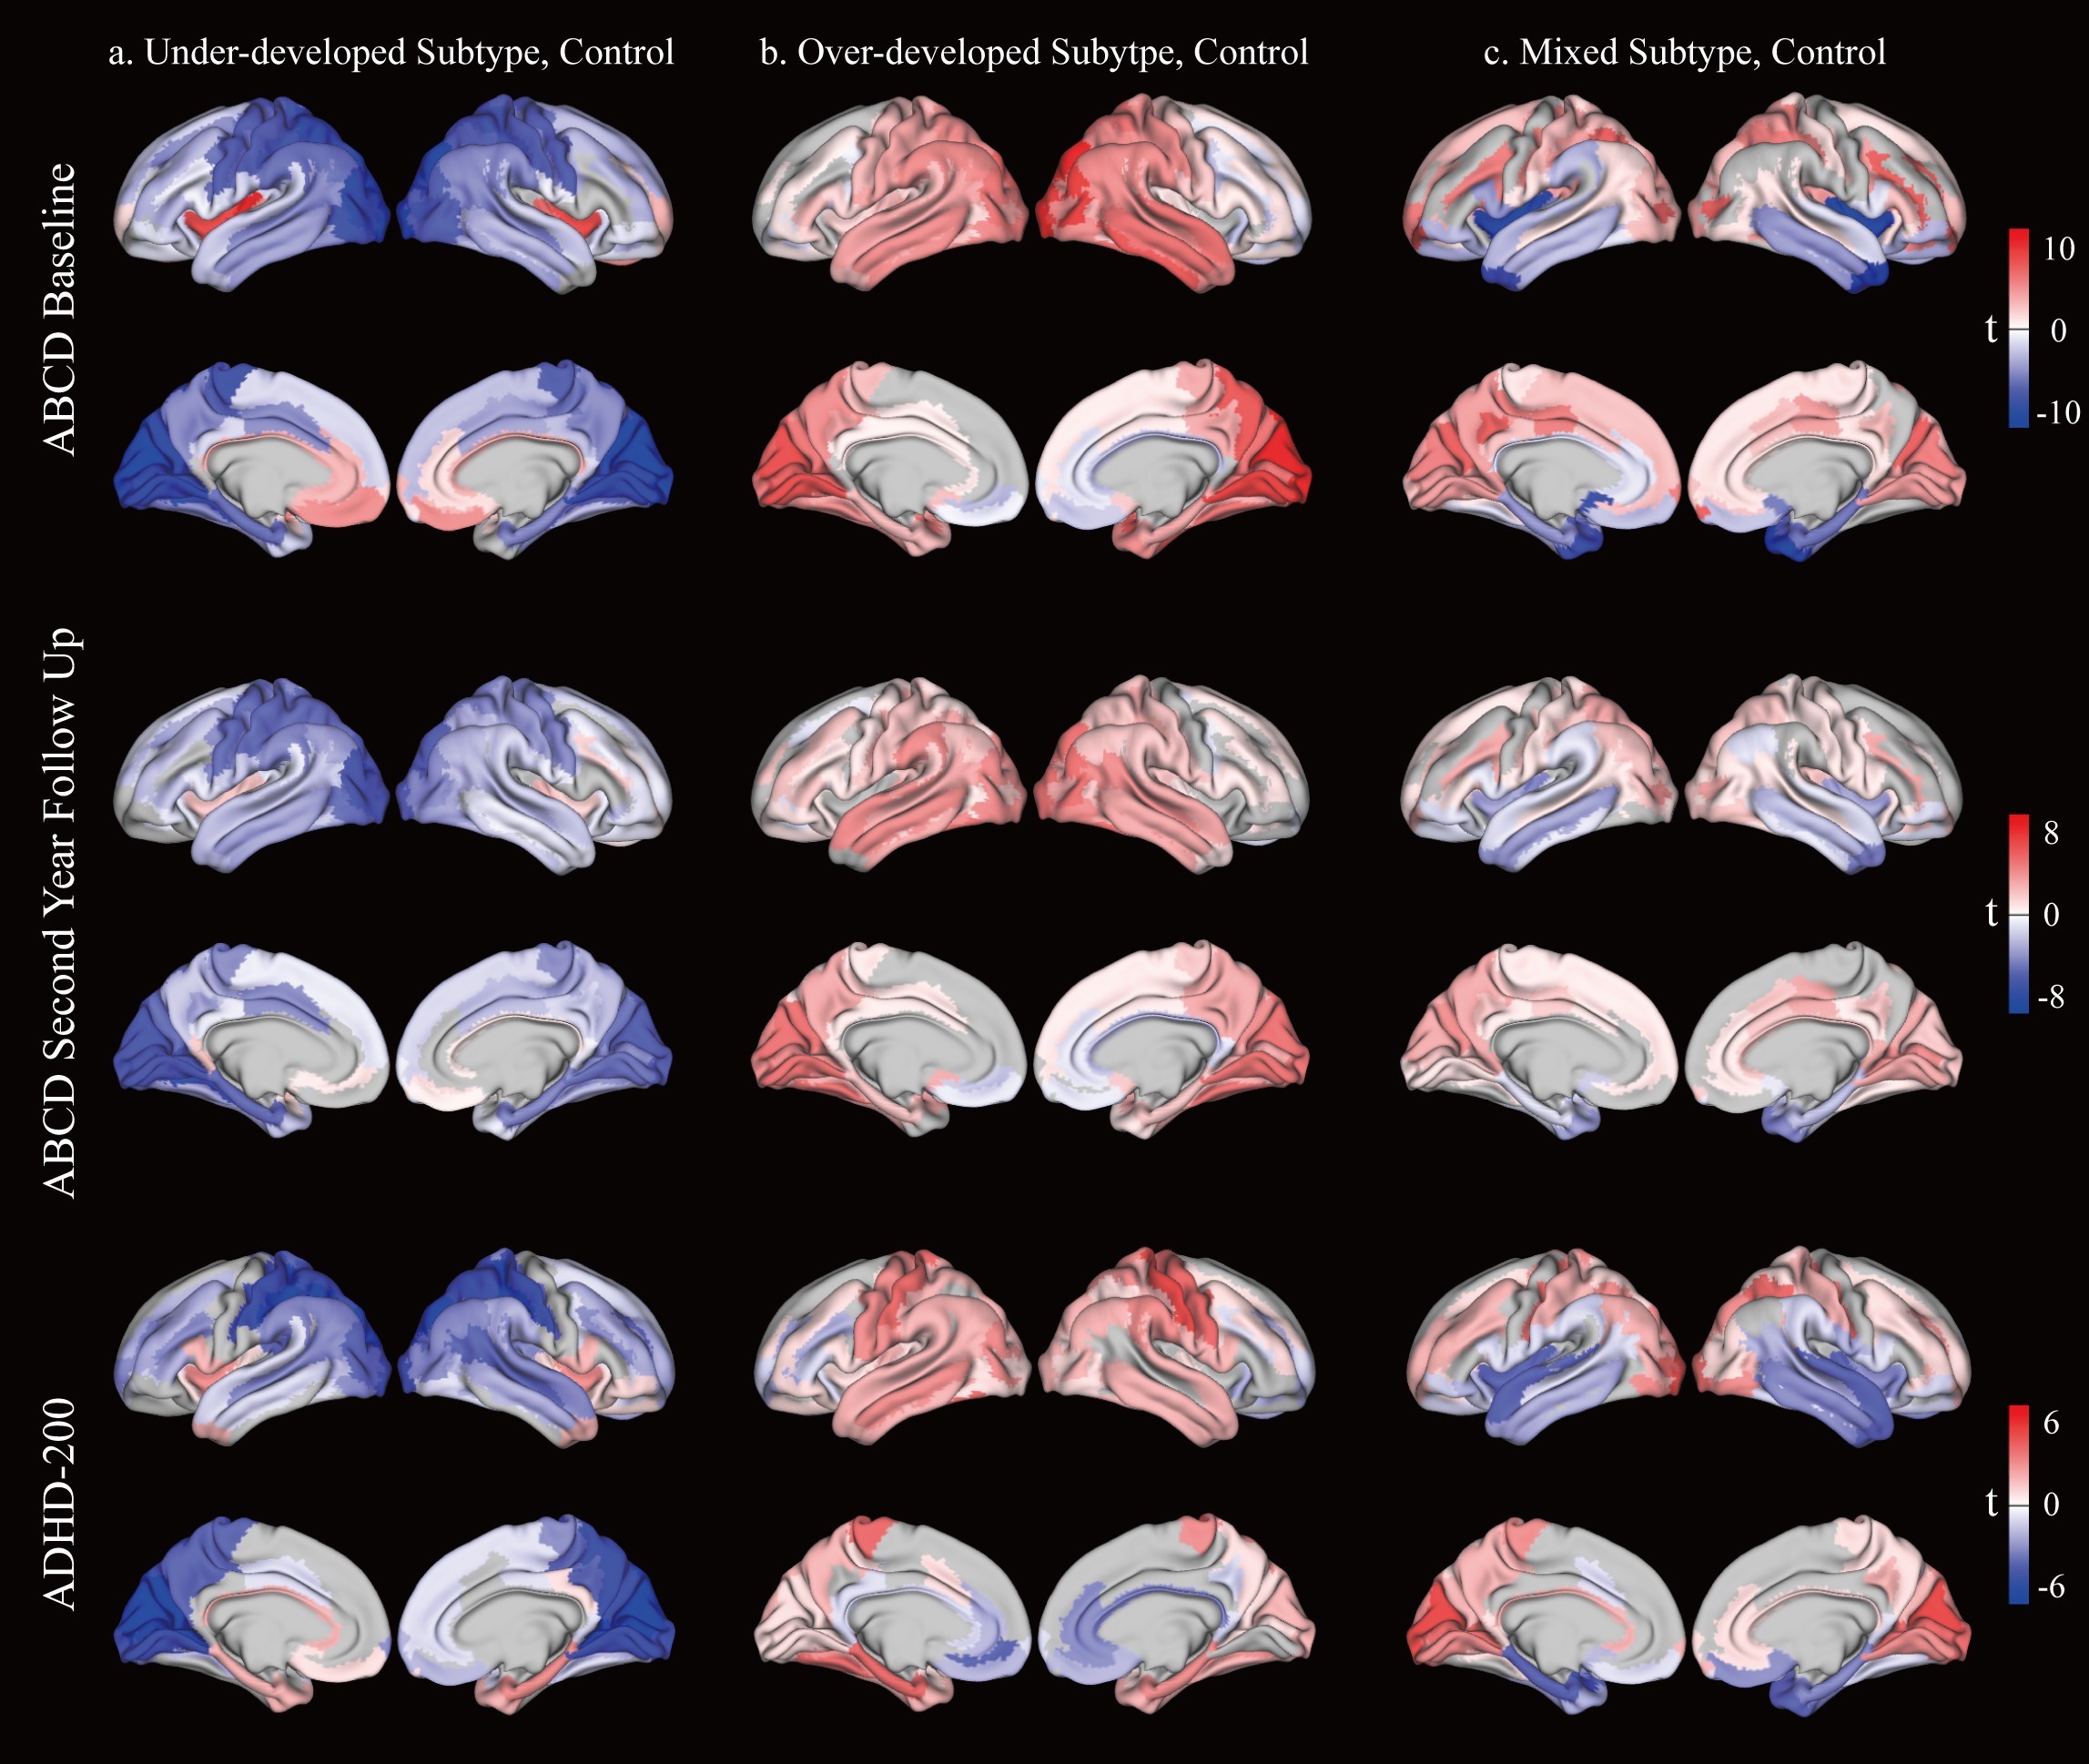
These patterns were also repeated in the second-year-follow-up dataset and ADHD-200 dataset (Fig. 2). The t-value spatial maps within the same subtype were highly similar between the ABCD baseline and ABCD second-year-follow-up or ADHD-200 (r=0.89 or 0.63, respectively).
Diagnostic and clinical values of the subtypes
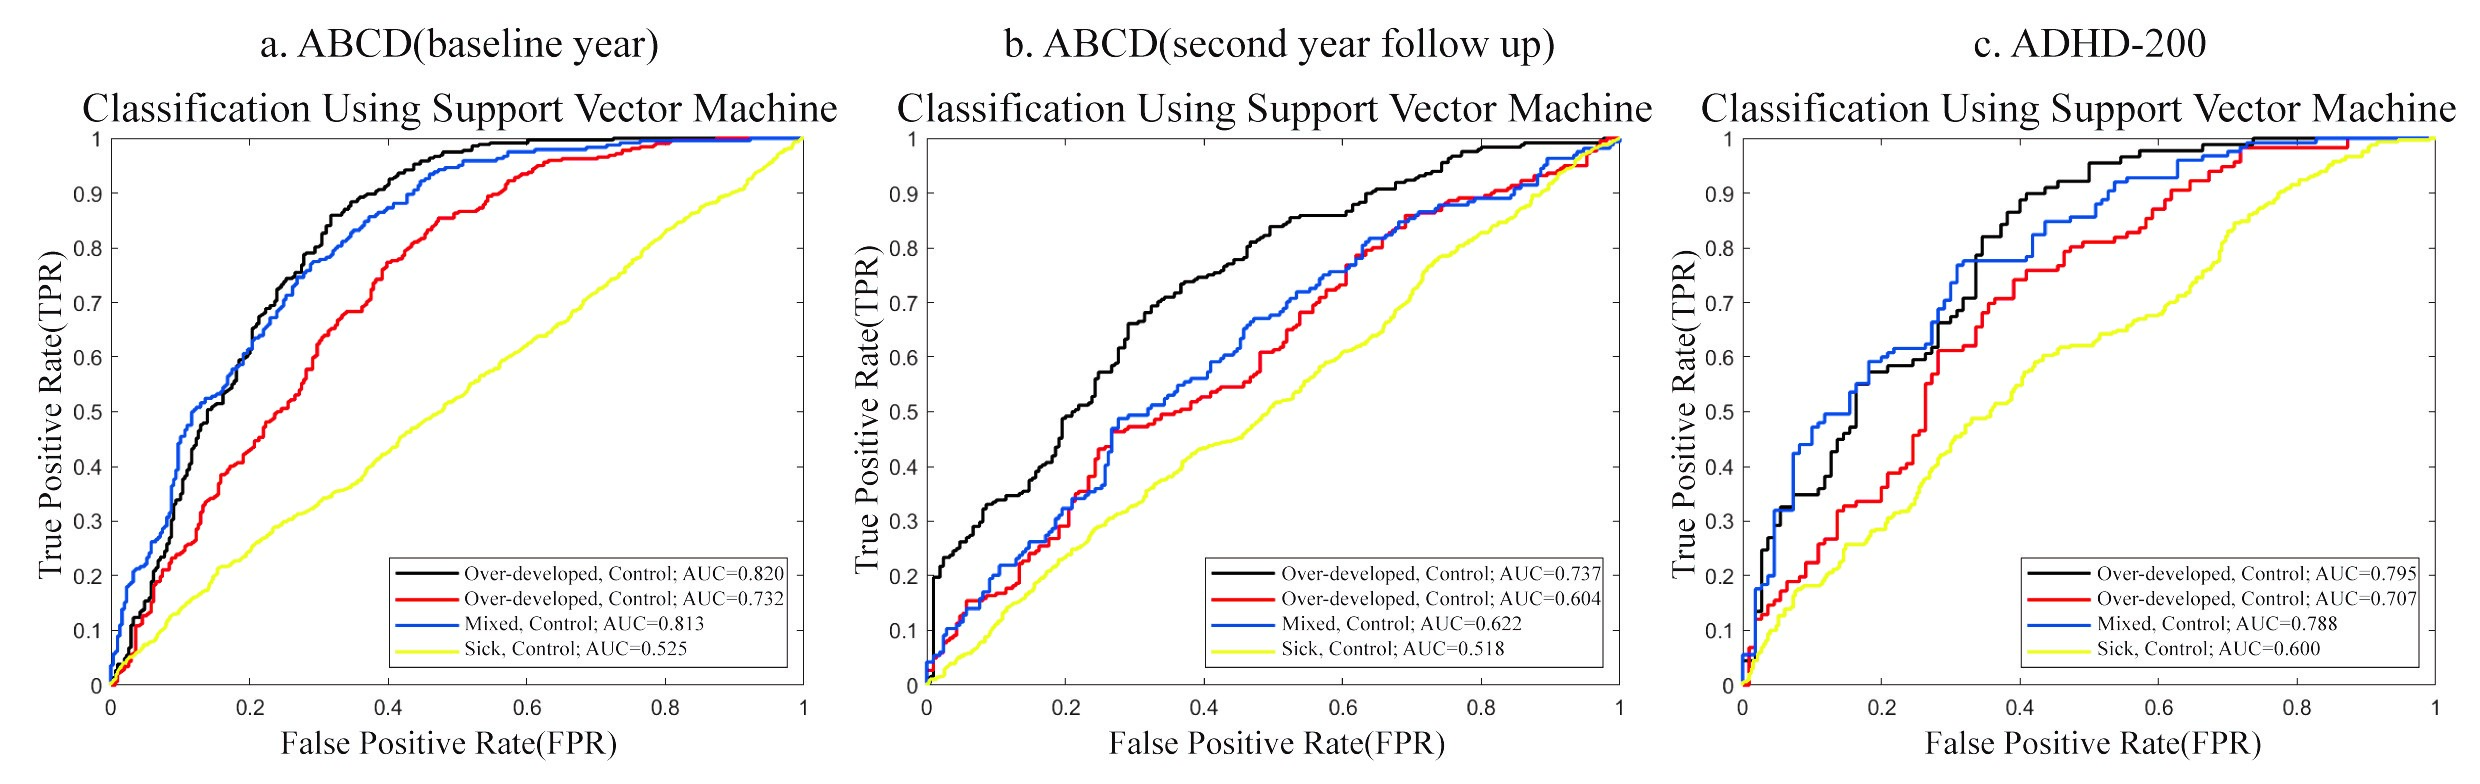
To understand the diagnostic value of the subtypes, we used linear SVM11 models to identify the subtypes and control, which showed high diagnostic ability of 0.82, 0.74, and 0.79 AUC for the three subtypes, respectively, much higher than the AUC around 0.5 for identifying ADHD as a whole without subtyping (Fig. 3).
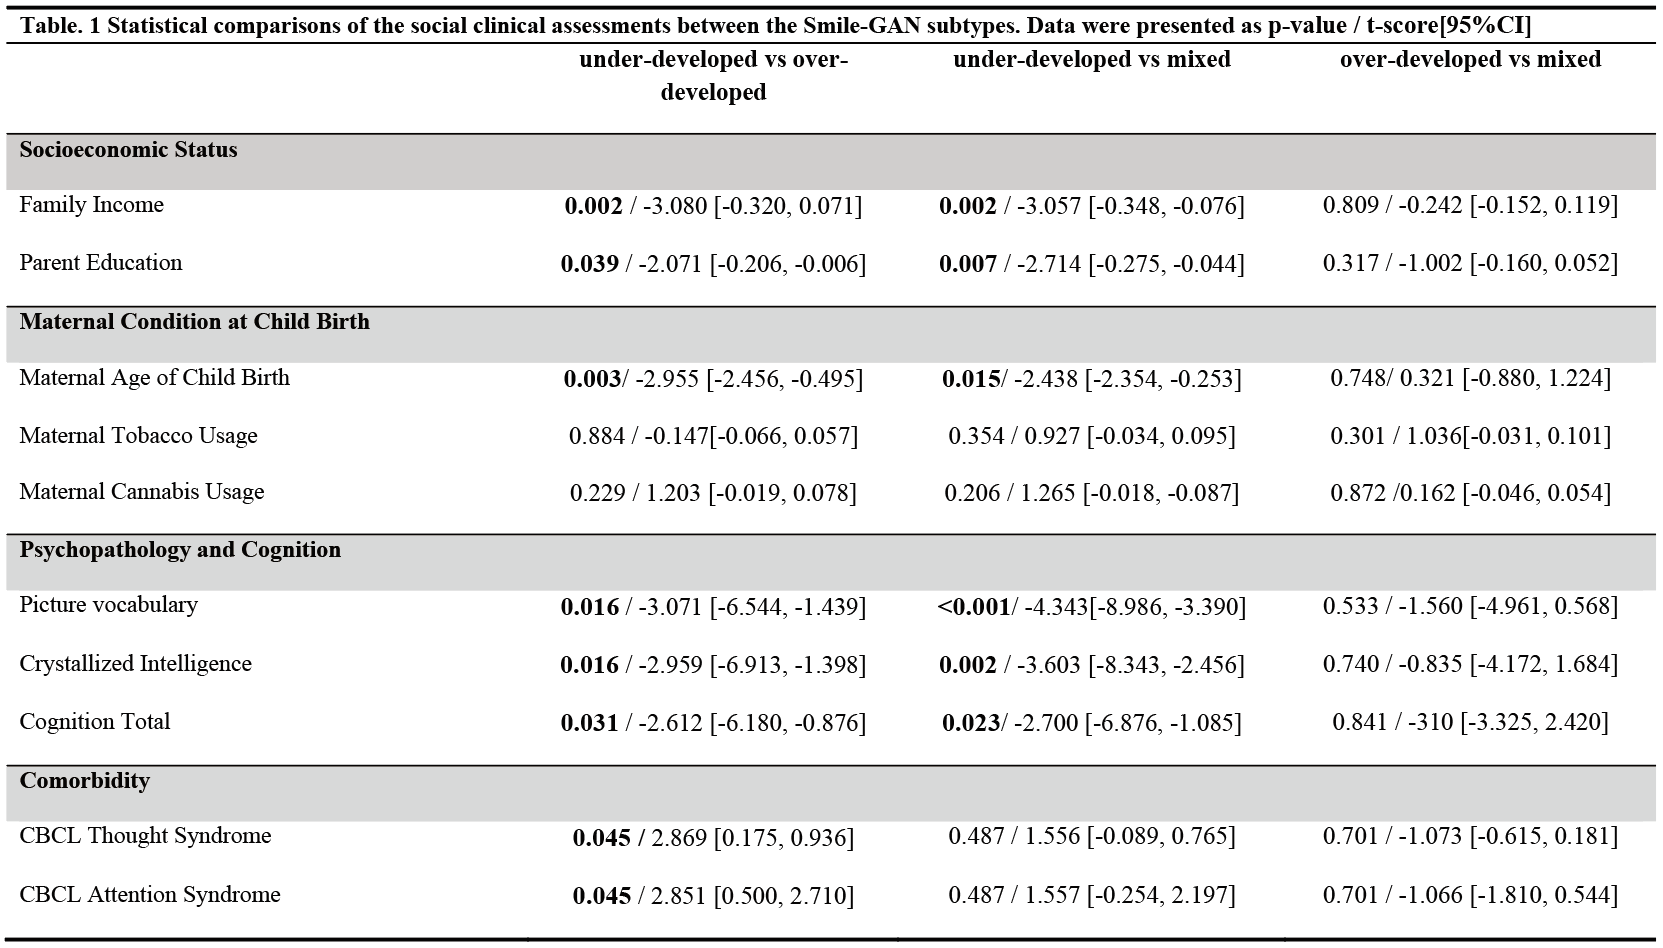
Furthermore, we observed significant differences among three subtypes in disease comorbidity, cognitive function, and social behaviors (Table 1). Overall, we found significant lower cognitive score and social behaviors and higher comorbidity in the underdeveloped subtype in comparison with the other two.
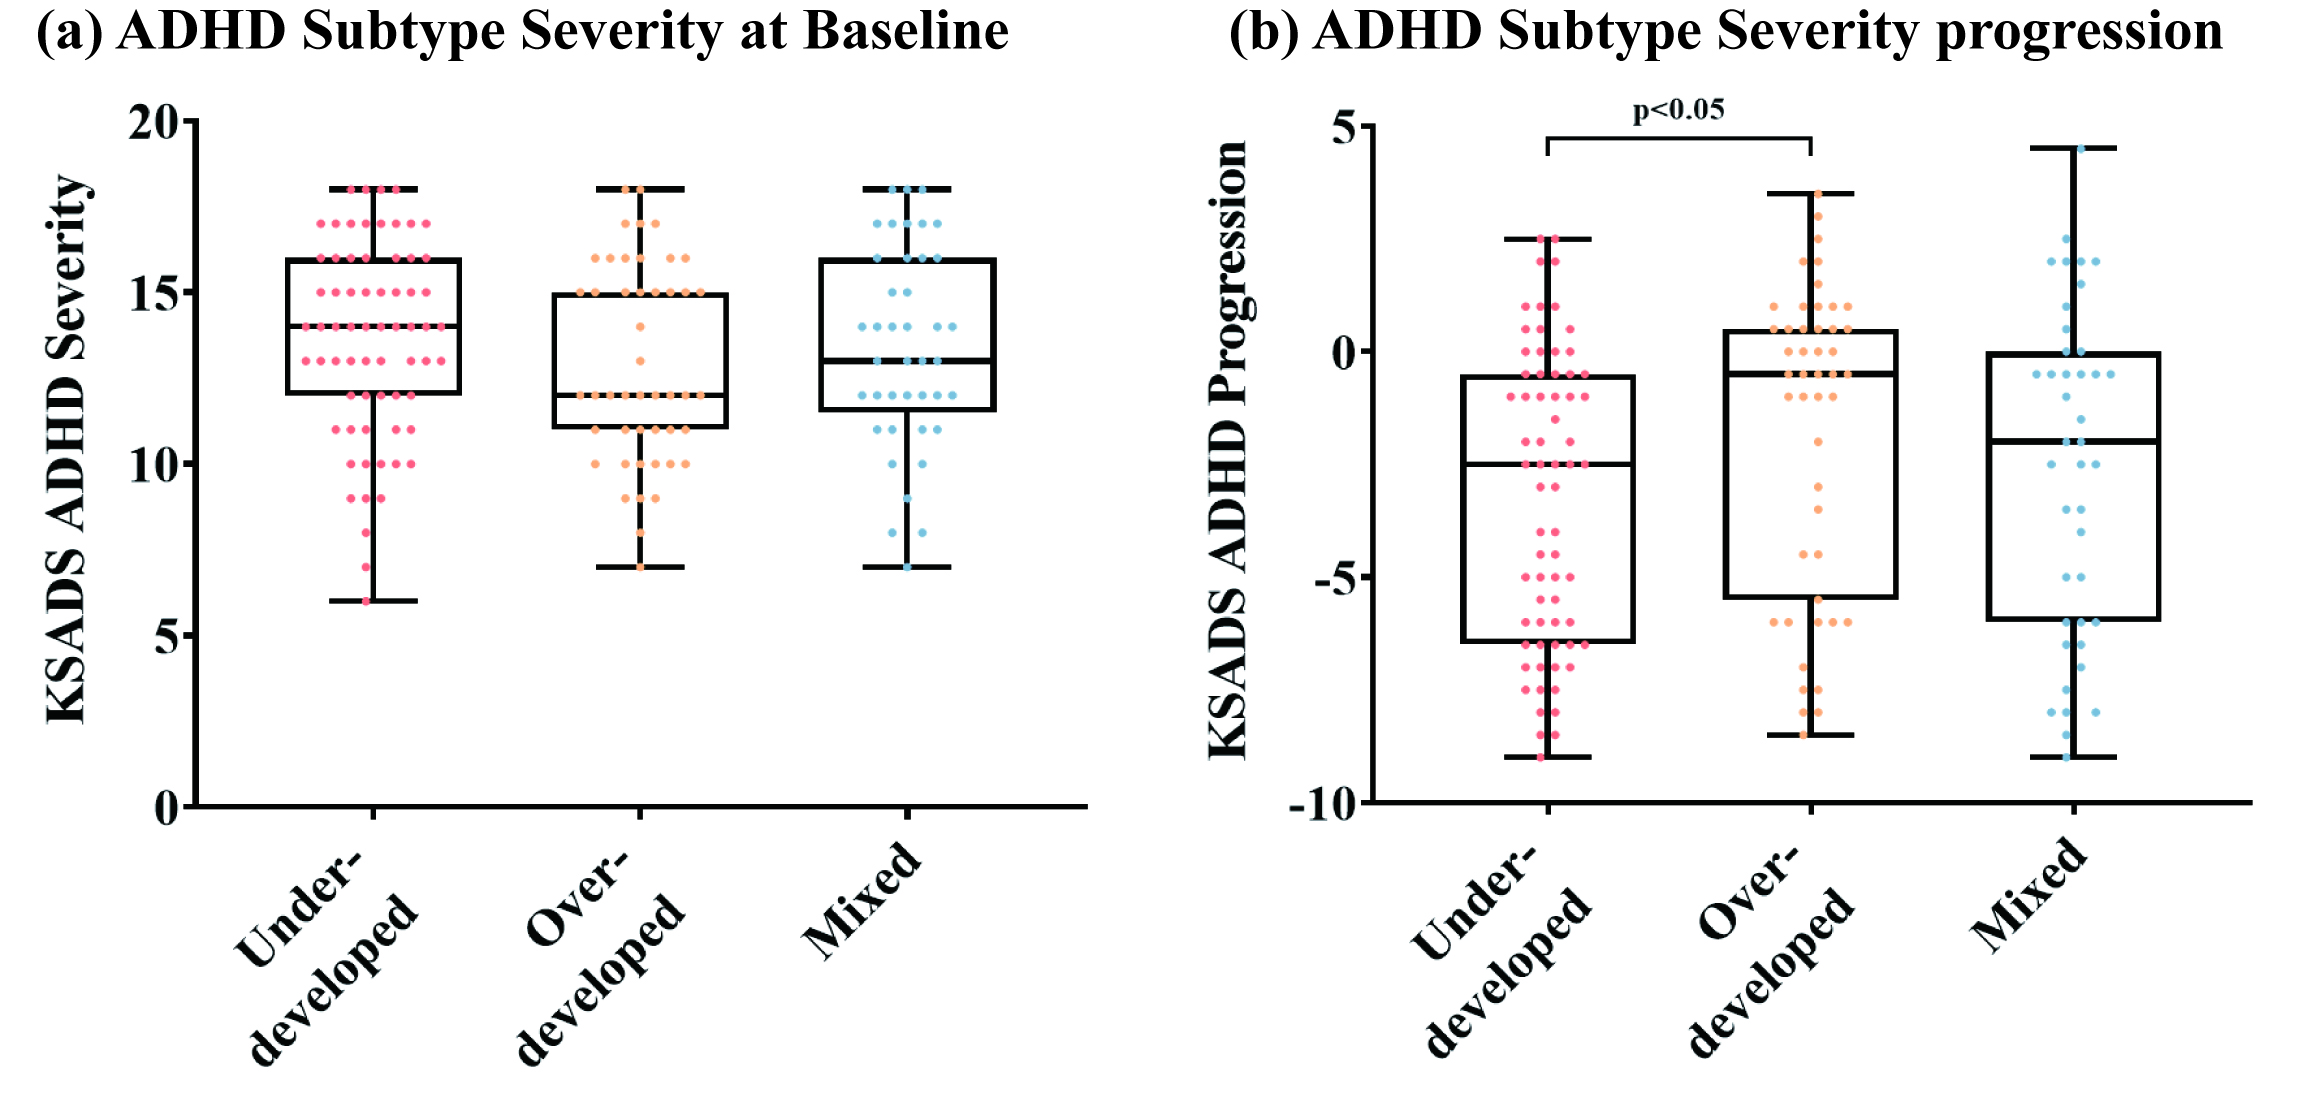
We further looked at whether the three subtypes had different response to stimulant medication, by comparing KSADS-COMP ADHD diagnostic score changes between different groups in three years (n=155). The underdeveloped subtype showed lower response to medication than the other two groups, in terms of the change of KSADS-COMP diagnostic score from baseline to second-year-follow-up (Fig. 4A), although there was no difference in their KSADS-COMP diagnostic scores at baseline (Fig. 4B).
Discussion and Conclusion
We used a data-driven method to disentangle the heterogeneity of ADHD and identified ADHD subtypes with distinct and replicable neuroimaging traits, followed by a comprehensive analysis that revealed the group differences in terms of diagnostic power, disease comorbidity, cognitive function, social behaviors and medication response. This neuroimaging-based subtyping, if validated in a wider population, may help predict treatment effects and the design personalized.Acknowledgements
This work was supported by the Ministry of Science and Technology of the People’s Republic of China (2021ZD0200202), the National Natural Science Foundation of China (81971606, 82122032), and the Science and Technology Department of Zhejiang Province (202006140, 2022C03057). Data used in the preparation of this article were obtained from the Adolescent Brain Cognitive DevelopmentSM (ABCD) Study (https://abcdstudy.org), held in the NIMH Data Archive (NDA).References
1. American Psychiatric Association, American Psychiatric Association, eds. Diagnostic and Statistical Manual of Mental Disorders: DSM-5. 5th ed. American Psychiatric Association; 2013.
2. Hoogman M, Muetzel R, Guimaraes JP, et al. Brain Imaging of the Cortex in ADHD: A Coordinated Analysis of Large-Scale Clinical and Population-Based Samples. Am J Psychiatry. 2019;176(7):531-542.
3. Dall’Aglio L, Kim HH, Lamballais S, Labrecque J, Muetzel RL, Tiemeier H. Attention-deficit hyperactivity disorder symptoms and brain morphology: Examining confounding bias. ELife. 11 (2022): e78002.
4. Levman J, Forgeron C, Shiohama T, et al. Cortical thickness abnormalities in attention deficit hyperactivity disorder revealed by structural magnetic resonance imaging: Newborns to young adults. Int J Dev Neurosci. 2022;82(7):584-595.
5. Kaufman J, Birmaher B, Brent D, et al. Schedule for Affective Disorders and Schizophrenia for School-Age Children-Present and Lifetime Version (K-SADS-PL): Initial Reliability and Validity Data. J Am Acad Child Adolesc Psychiatry. 1997;36:980–8.
6. Fischl B. FreeSurfer. NeuroImage. 2012;62(2):774-781.
7. Pomponio R, Erus G, Habes M, et al. Harmonization of large MRI datasets for the analysis of brain imaging patterns throughout the lifespan. NeuroImage. 2020;208:116450.
8. Yang Z, Nasrallah IM, Shou H, et al. A deep learning framework identifies dimensional representations of Alzheimer’s Disease from brain structure. Nat Commun. 2021;12(1):7065.
9. Hubert L, Arabie P. Comparing partitions. J Classif. 1985;2(1):193-218.
10. Bellec P, Chu C, Chouinard-Decorte F, Benhajali Y, Margulies DS, Craddock RC. The Neuro Bureau ADHD-200 Preprocessed repository. NeuroImage. 2017;144:275-286.
11. Joachims T. Making large-scale SVM learning practical. Technical report, 1998.
Figures