0439
Dynamic alterations in spontaneous neural activity in patients with attention-deficit/hyperactivity disorder: a resting-state fMRI study1The First Affiliated Hospital of Dalian Medical University, Dalian, China, 2Taihe Hospital, Hubei University of Medicine, Shiyan, China
Synopsis
Keywords: Psychiatric Disorders, fMRI (resting state), attention-deficit/hyperactivity disorder
Motivation: The dALFF and dfALFF of ADHD have not been fully revealed and publicized.
Goal(s): We investigate dALFF and dfALFF in ADHD and further explore whether dALFF and dfALFF can be used to test the feasibility of differentiating ADHD from HC.
Approach: The ALFF and fALFF methods were combined with sliding-window approaches to investigate the abnormal time-varying local brain activity of ADHD.
Results: ADHD showed statistically significant differences in dALFF and dfALFF. Clinical scores and executive function were correlated with the quantitative values of dynamic differential brain regions. ADHD and HC can be effectively distinguished using an auxiliary diagnostic model based on random forest.
Impact: From the perspective of dynamic local brain activity, this study provides insight into the brain dysfunction of ADHD. Understanding dALFF/dfALFF variability can be helpful in understanding neurophysiological mechanisms and possibly guiding ADHD diagnosis.
Introduction and purpose
The diagnosis of attention-deficit/hyperactivity disorder (ADHD) and other mental disorders is currently made by clinical psychiatrists through subjective examinations, the accuracy of diagnosis depends on the skill of doctors, and there are no objective biomarkers for early detection. When functional magnetic resonance imaging (fMRI) scans are performed, it is implicitly assumed that brain activity stays stationary. The evidence suggests that the activity of brain fluctuates over time, according to an increasing number of studies1-6. The focus of previous neuroimaging studies on patients with ADHD has mainly been on static and dynamic functional connectivity7-11. There is little understanding of the characteristics of dynamic local brain activity in ADHD. In this study, the amplitude of low-frequency fluctuation (ALFF) and fractional amplitude of low frequency fluctuations (fALFF) methods were combined with sliding-window approaches to investigate the abnormal time-varying local brain activity of ADHD. To investigate the dynamic amplitude of low-frequency fluctuation (dALFF) and dynamic fractional amplitude of low-frequency fluctuation (dfALFF) in patients with ADHD and health control (HC). In addition, we will investigate whether dALFF/dfALFF can be used to distinguish ADHD from HC.Materials and methods
48 cases of clinically confirmed ADHD and 44 HC underwent MRI examinations on a 3.0-Tesla MRI scanner (Signa Architect, GE Healthcare, Milwaukee, WI, USA) equipped with a 48-channel phased-array head coil. Clinical data, Swanson Nolan and pelham-IV rating scale (SNAP-IV) and the Behavior Rating Inventory of Executive Function (BRIEF) were collected. Preprocessing of the rs-fMRI data was performed using the GRETNA toolbox (DOI: 10.3389/fnhum.2015.00386) based on MATLAB 2013b platform. The analysis of dALFF and dfALFF were performed using the DPABI based Time Dynamics Analysis (TDA) toolbox (http://www.rfmri.org/dpabi) (doi: 10.1007/s12021-016-9299-4). Two sample t-test was conducted to compare the difference of dALFF/dfALFF between the ADHD and HC groups, based on a general linear mode (GLM) using Statistical Parametric Mapping (SPM, http://www.fil.ion.ucl.ac.uk/spm) toolbox. In this procedure, ages, gender, and years of education were treated as nuisance covariates. The Family Wise Error (FWE) was applied for multiple comparisons and corrections at cluster level. The cluster threshold (uncorrected level) was set at P < 0.001. After correction, the significance threshold was set at P < 0.05. The dALFF/dfALFF images were used for the subsequent multivariate pattern analysis (MVPA) without any further feature preprocessing. Here, we used a mask defined by clusters with significant group differences in dALFF/dfALFF variability without feature selection. For the classification algorithm, we selected random forest with default parameter settings (the number of decision trees is set to 500 by default). The DPABI toolbox was utilized to extract the average dALFF/dfALFF values for each of the statistically different clusters separately. Afterwards, the Spearman correlation analysis was used to explore the correlation between dALFF/dfALFF and neuropsychological scale scores.Results
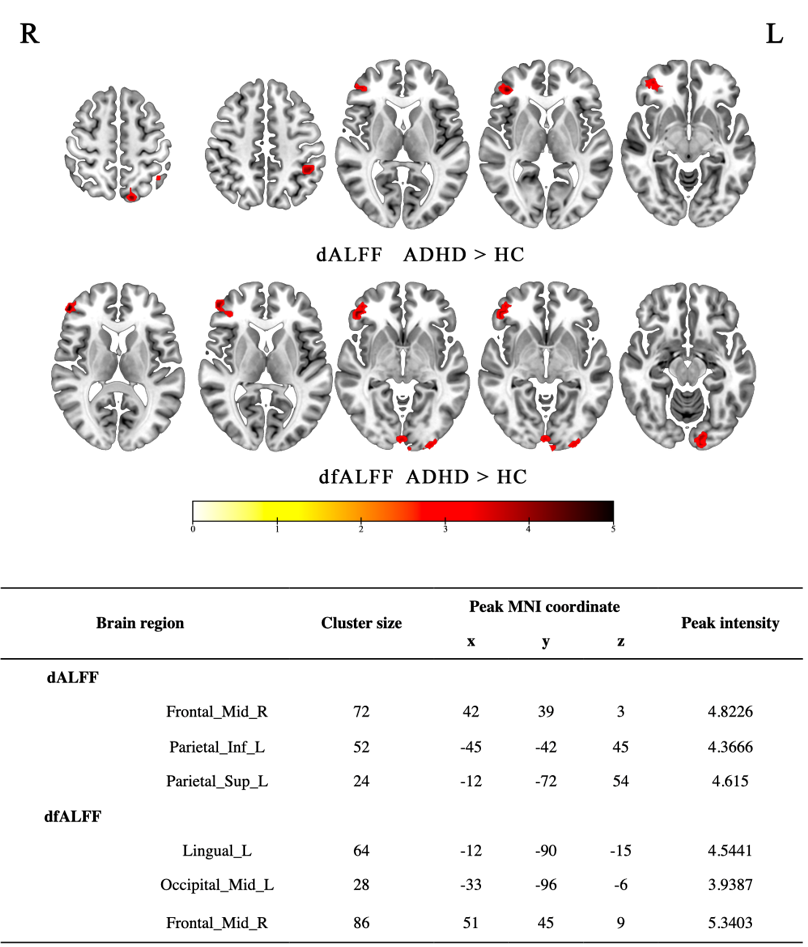
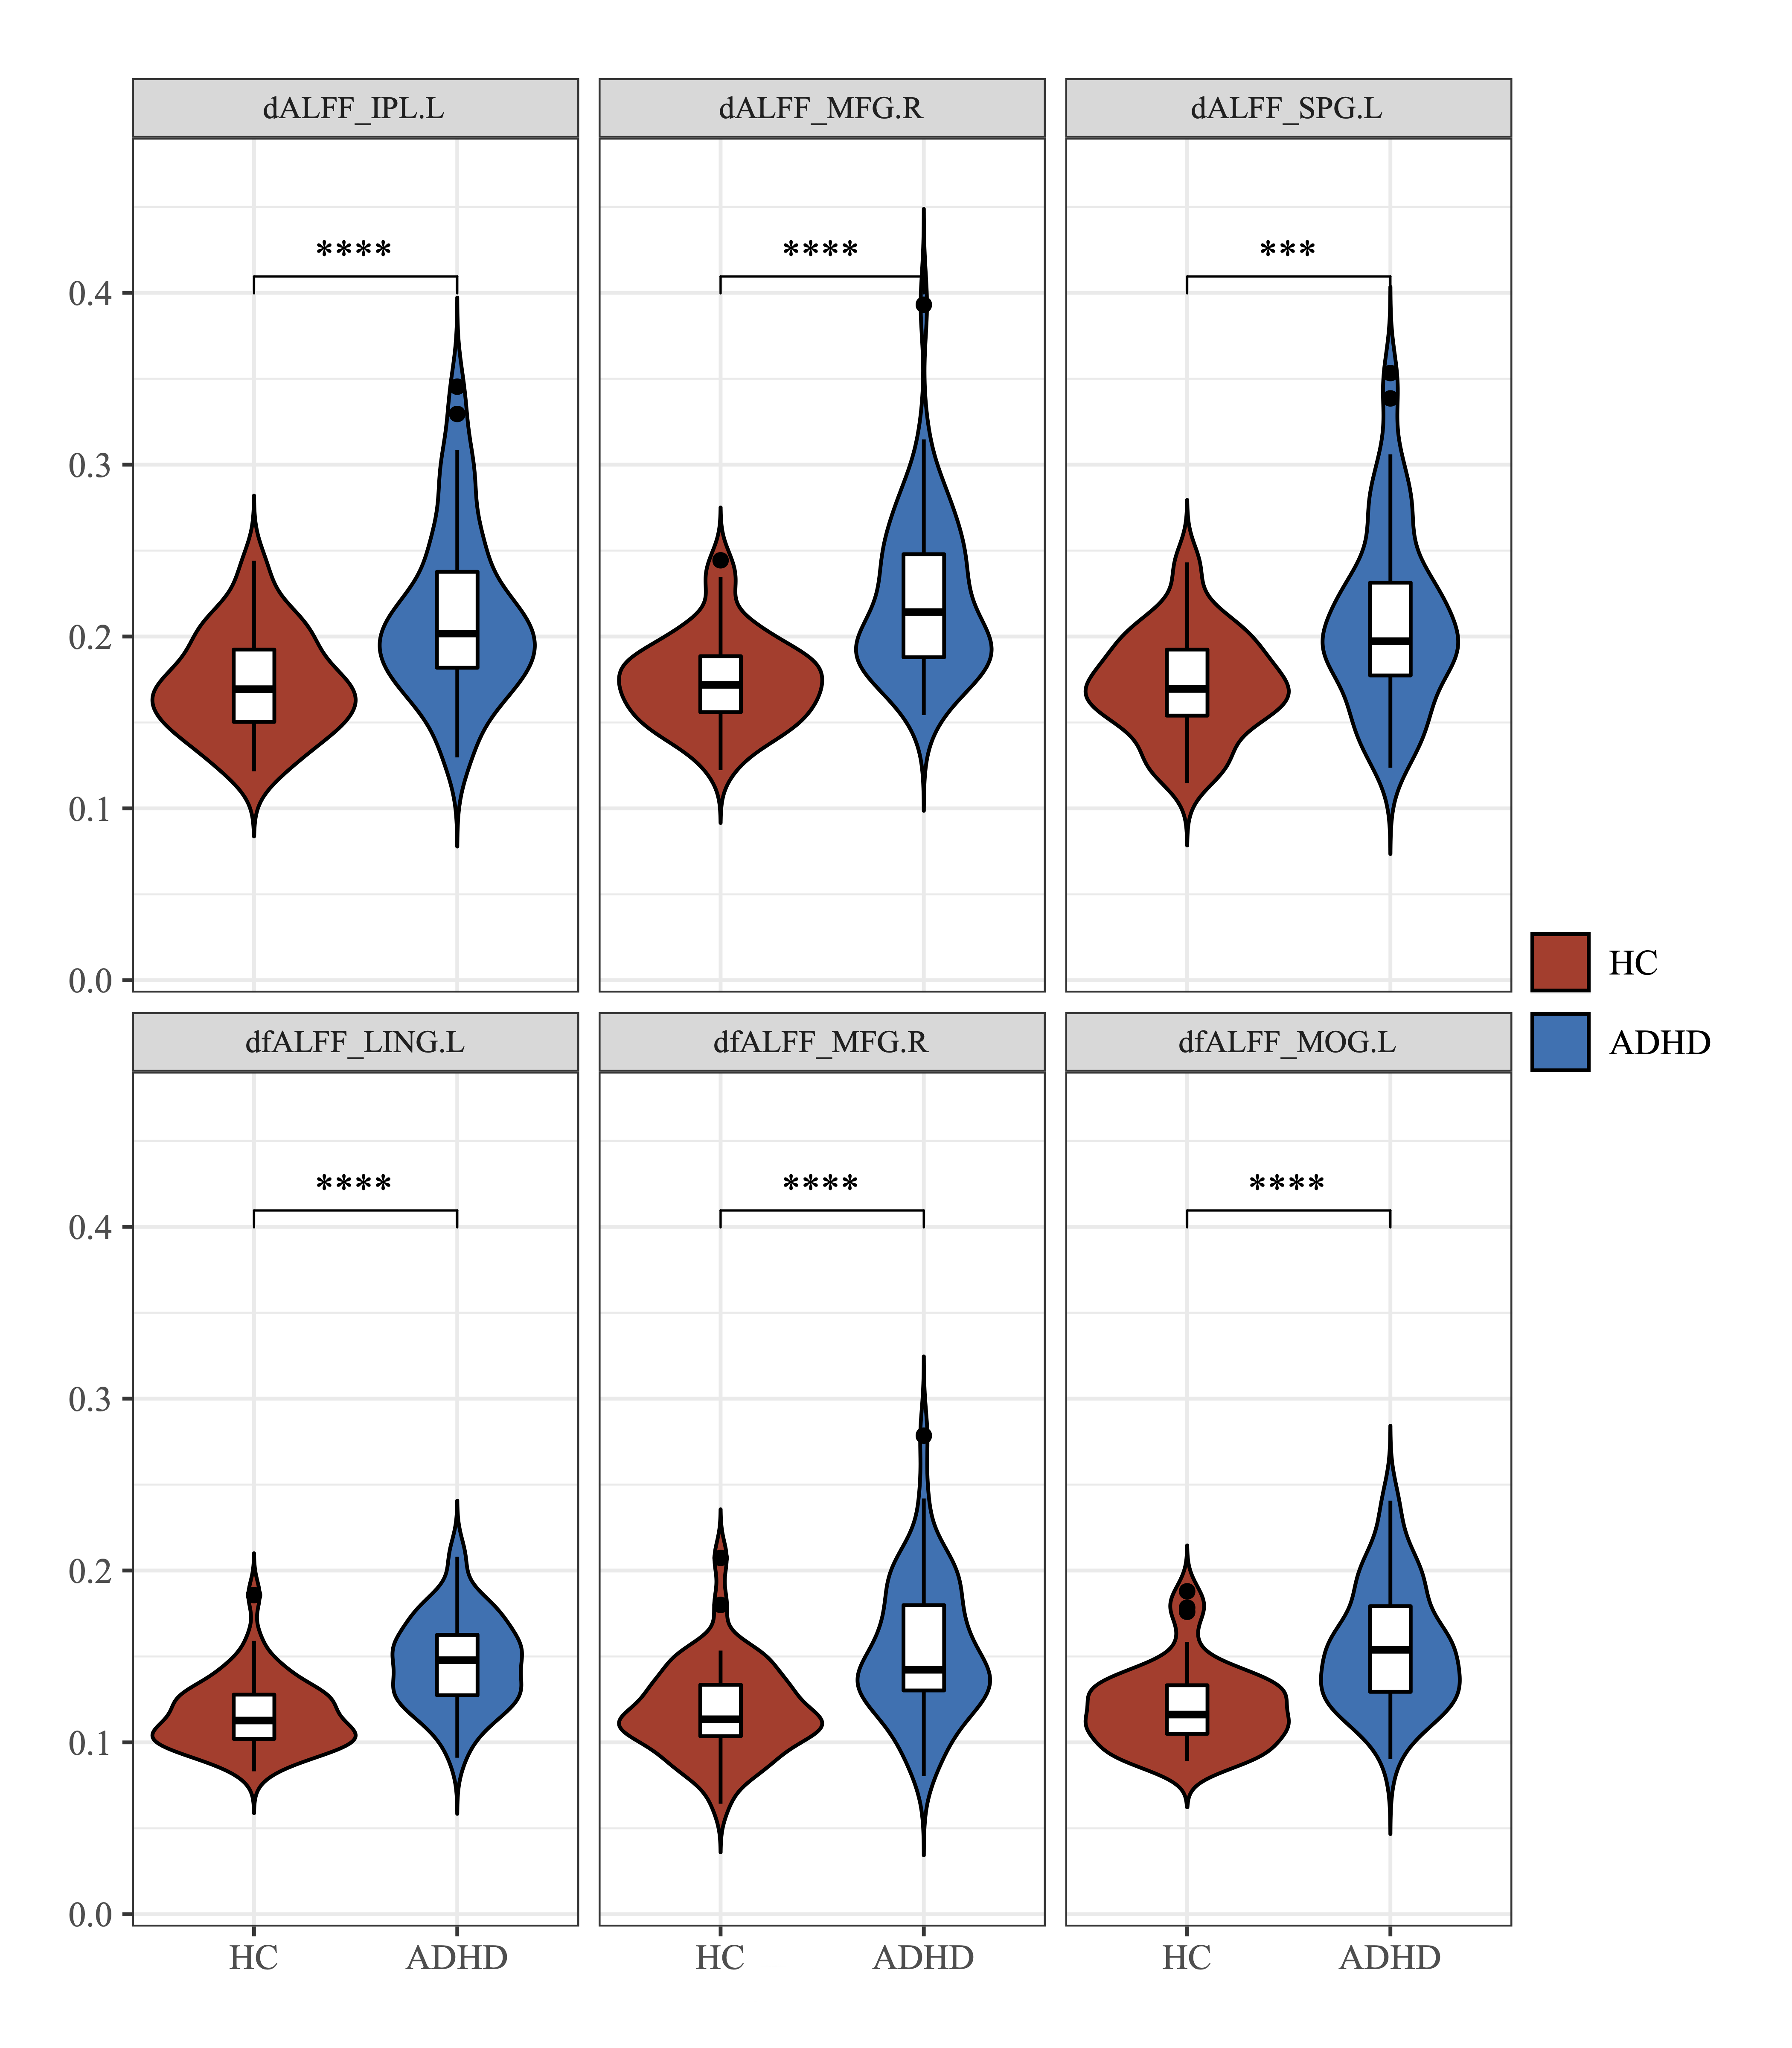
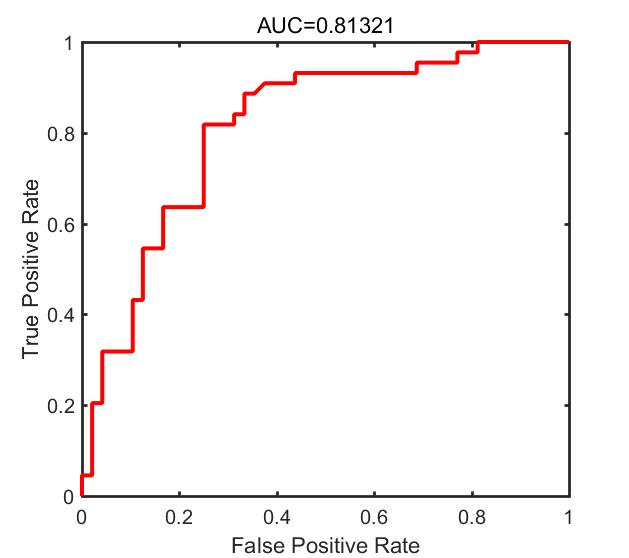
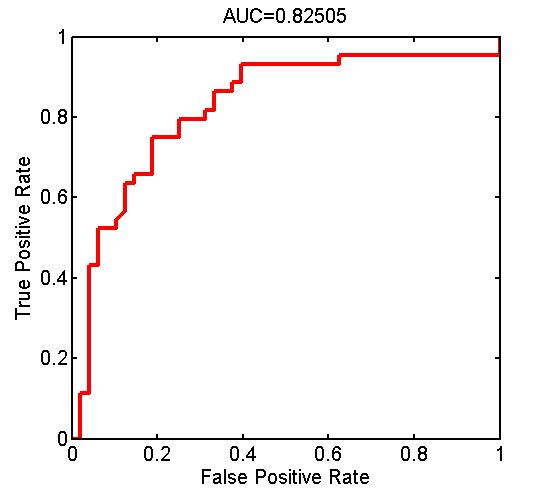
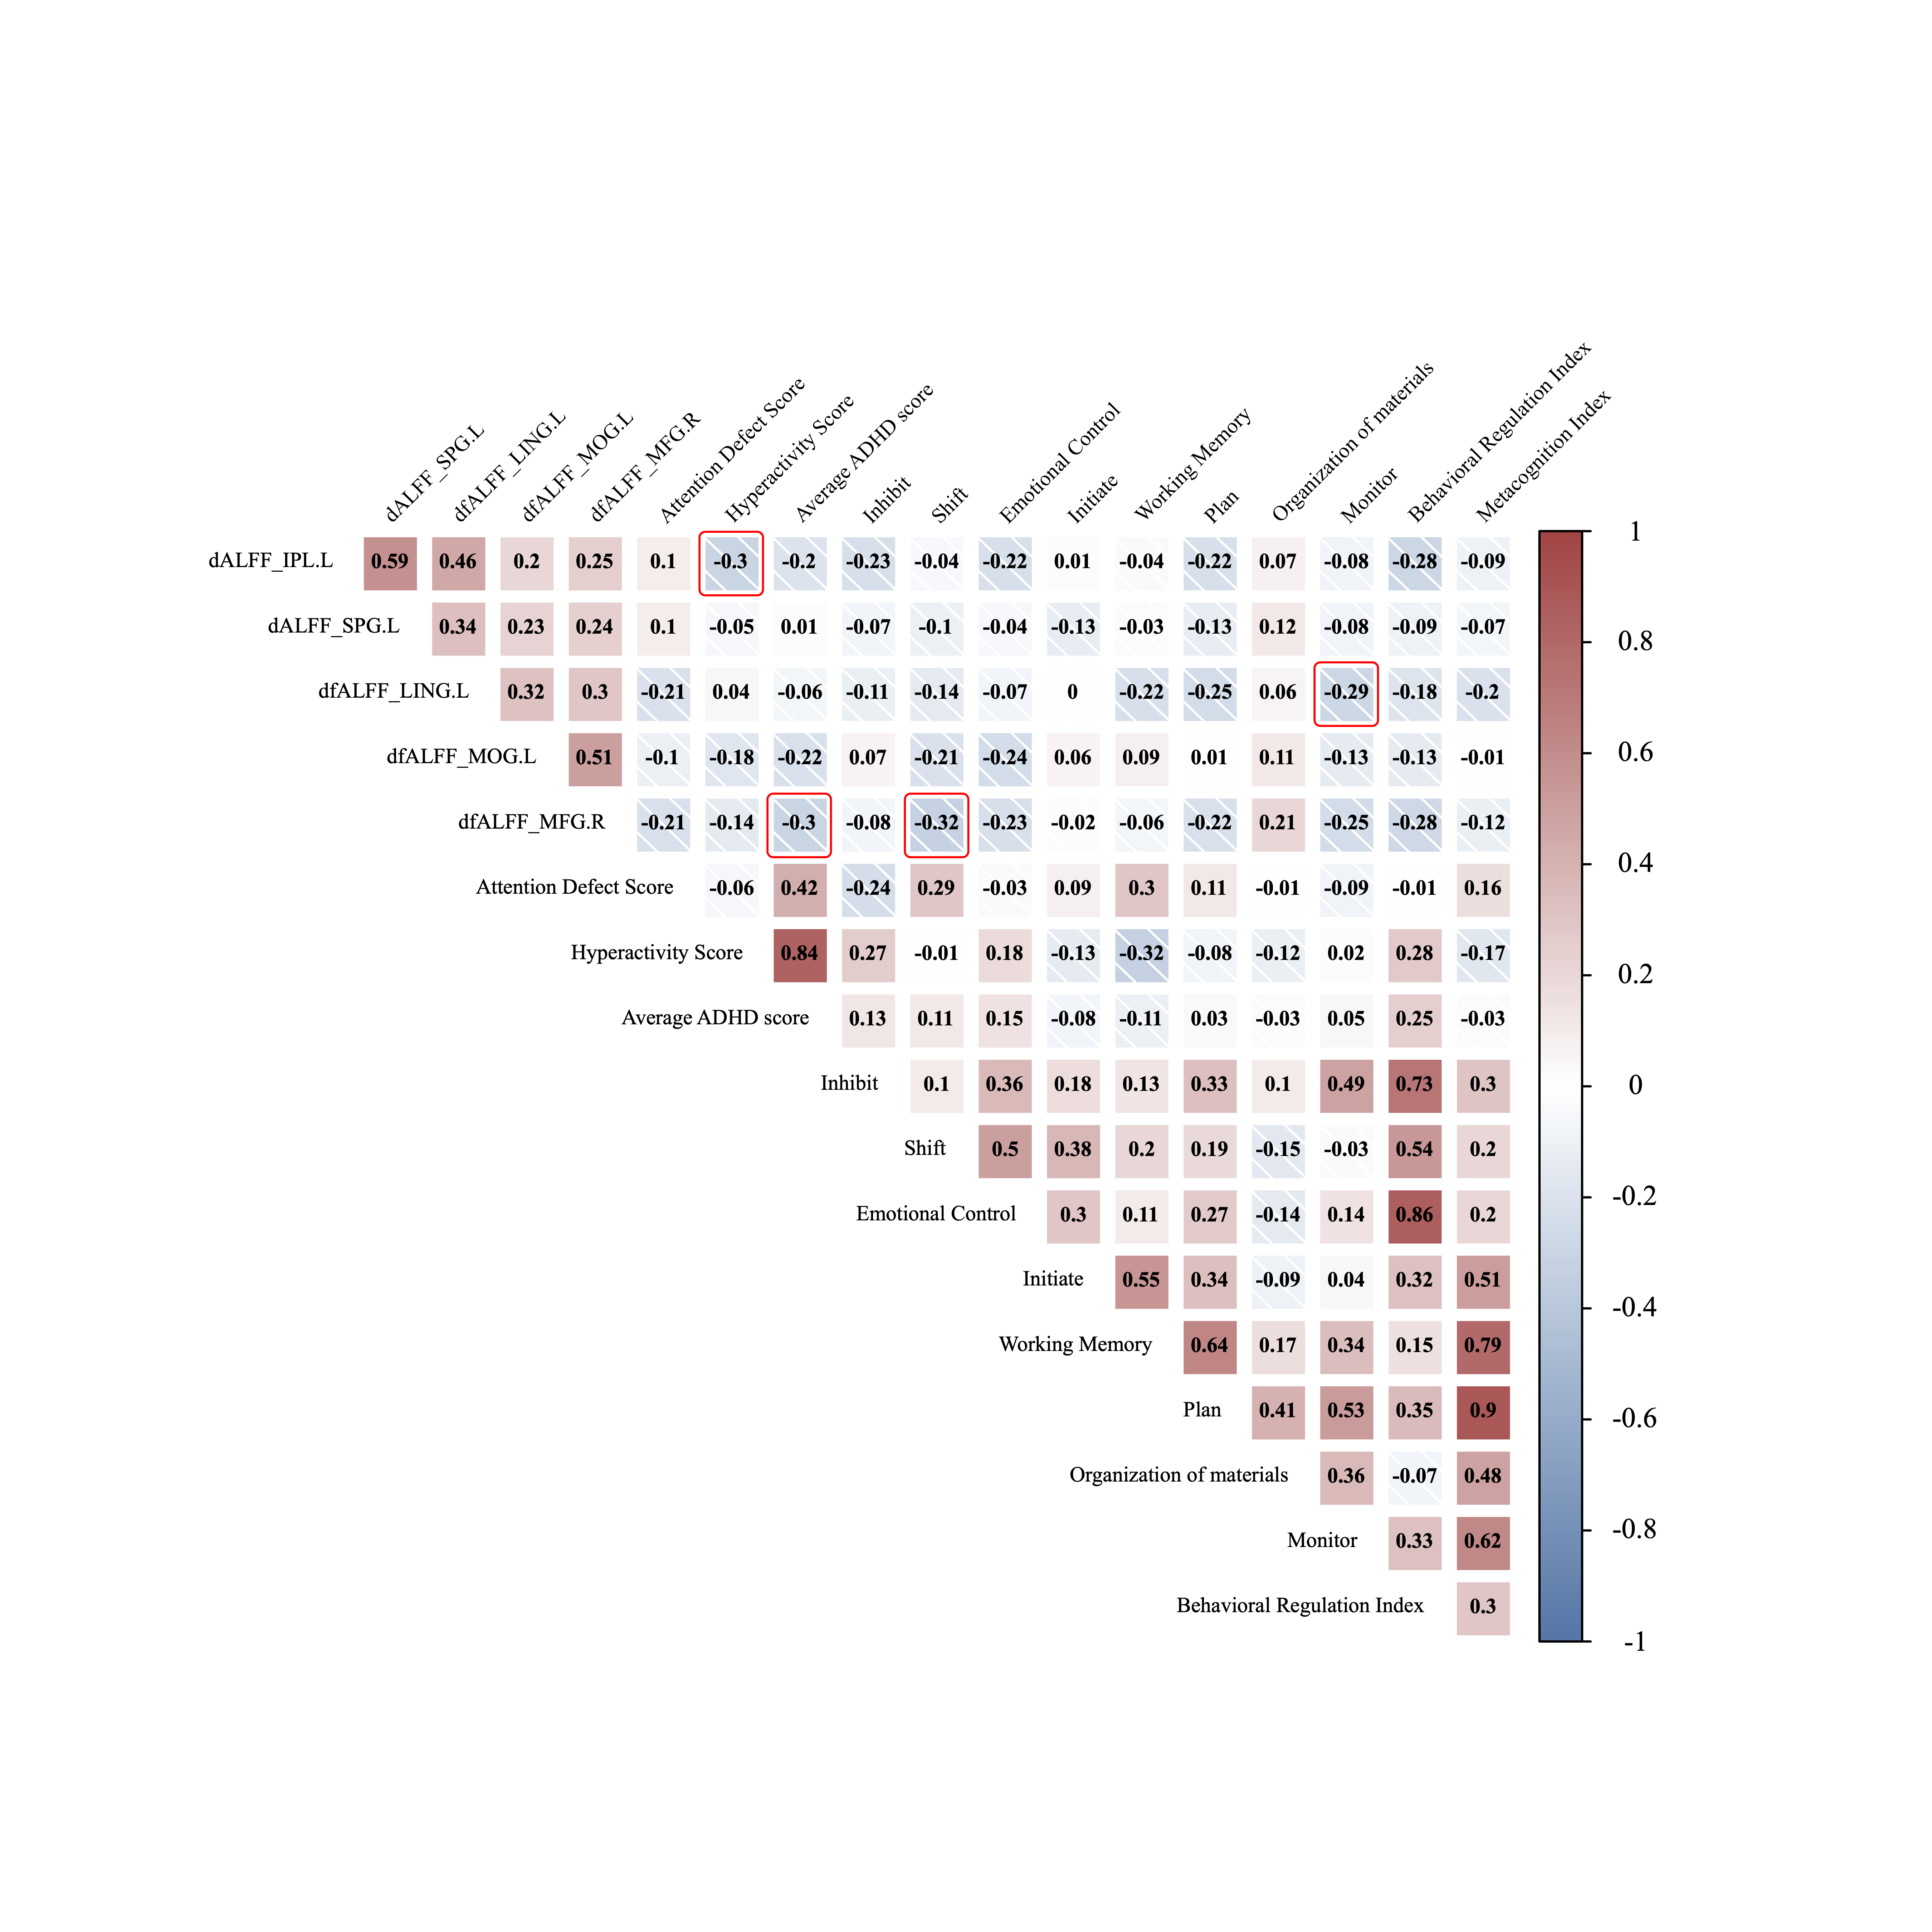
Brain regions with increased dALFF variability of ADHD were located in right middle frontal gyrus (MFG), left inferior (IPL) and superior parietal gyrus (SPG) compared with HC (Fig.1-2). Meanwhile, ADHD observed increased dfALFF variability in left lingual gyrus (LING), right MFG and left middle occipital gyrus (MOG) compared with HC (Fig.1-2). (FWE corrected at cluster level with ages, gender, educated years as covariates, P < 0.05) The classification with altered dALFF variability as features achieved a mean accuracy of 73.913%, AUC of 0.810 (Fig.3). The classification with altered dfALFF variability as features achieved a mean accuracy of 76.087%, AUC of 0.825 (Fig.4). The mean value of the dALFF variability for the difference cluster peaked on the left IPL was negatively correlated with the hyperactivity score (r = -0.295, P = 0.042); The mean value of the dfALFF variability for the difference cluster peaked on the left LING was negatively correlated with the monitor score of BRIEF (r = -0.288, P = 0.047); The mean value of the dfALFF variability for the difference cluster peaked on the right MFG was negatively correlated with the average ADHD score (r = -0.298, P = 0.039), and negatively correlated with the shift score of BRIEF (r = -0.318, P = 0.028) (Fig.5).Conclusion
In ADHD patients, dynamic brain activity is abnormal, and dALFF/dfALFF variability is highly accurate for separating ADHD from HCs. New insights into ADHD pathophysiology were revealed by our study.Acknowledgements
noReferences
1. Sun J, Liu Z, Rolls ET, et al. Verbal Creativity Correlates with the Temporal Variability of Brain Networks During the Resting State. Cerebral Cortex 2019;29:1047-1058.
2. Fu Z, Tu Y, Di X, et al. Characterizing dynamic amplitude of low-frequency fluctuation and its relationship with dynamic functional connectivity: An application to schizophrenia. NeuroImage 2018;180:619-631.
3. Allen EA, Damaraju E, Plis SM, Erhardt EB, Eichele T, Calhoun VD. Tracking Whole-Brain Connectivity Dynamics in the Resting State. Cerebral Cortex 2014;24:663-676.
4. Li R, Wang L, Chen H, et al. Abnormal dynamics of functional connectivity density in children with benign epilepsy with centrotemporal spikes. Brain Imaging and Behavior 2018;13:985-994.
5. Zhang J, Cheng W, Liu Z, et al. Neural, electrophysiological and anatomical basis of brain-network variability and its characteristic changes in mental disorders. Brain 2016;139:2307-2321.
6. Hutchison RM, Womelsdorf T, Allen EA, et al. Dynamic functional connectivity: Promise, issues, and interpretations. NeuroImage 2013;80:360-378.
7. Fateh AA, Huang W, Mo T, et al. Abnormal Insular Dynamic Functional Connectivity and Its Relation to Social Dysfunctioning in Children With Attention Deficit/Hyperactivity Disorder. Frontiers in Neuroscience 2022;16.
8. Wang X-H, Jiao Y, Li L. Identifying individuals with attention deficit hyperactivity disorder based on temporal variability of dynamic functional connectivity. Scientific Reports 2018;8.
9. Park B-y, Hong J, Lee S-H, Park H. Functional Connectivity of Child and Adolescent Attention Deficit Hyperactivity Disorder Patients: Correlation with IQ. Frontiers in Human Neuroscience 2016;10.
10. Cortese S, Kelly C, Chabernaud C, et al. Toward Systems Neuroscience of ADHD: A Meta-Analysis of 55 fMRI Studies. American Journal of Psychiatry 2012;169:1038-1055.
11. Booth JR, Burman DD, Meyer JR, et al. Larger deficits in brain networks for response inhibition than for visual selective attention in attention deficit hyperactivity disorder (ADHD). Journal of Child Psychology and Psychiatry 2004;46:94-111.
Figures