0438
Abnormal Topology and Connectivity of Structural Covariance Network Related to Diagnosis and Phenotyping in Major Depressive Disorder1Department of Radiology, Taihe Hospital, Hubei University of Medicine, Shiyan, China, 2Wuhan Mental Health Center, Wuhan, China, 3West China Hospital of Sichuan University, Chengdu, China, 4GE Healthcare, MR Research China, Beijing, China
Synopsis
Keywords: Psychiatric Disorders, Brain Connectivity
Motivation: Findings on brain network abnormalties in major depressive disorder (MDD) were mixed owing to small-scale and single-site designs. The diagnostic value of network topology and connectivity remain unclear.
Goal(s): To identify robust structural network abnormalities in MDD and relevant clinical phenotypes and to discern the diagnostic value of network topology and connectivity.
Approach: Group-level comparsion and individual-level machine learning classification was performed based on structural covariance network connectivity and topological metrics.
Results: Different patterns of network topology and connectivity abnormalities were observed between first-episode drug-naive and recurrent patients with MDD. Topological metrics enabled more accurate classification performance on MDD diagnosis and phenotyping.
Impact: Our findings advance the current understanding of network-level neurobiological mechanisms of MDD, providing a solid basis for future development of network topology-based diagnosis models.
Introduction
The neuropathological underpinnings of major depressive disorder (MDD) have been increasingly elucidated as disruption of brain networks rather than mere isolated regional abnormalities1. Brain networks are typically depicted through inter-regional connectivity matrices, which allows for the examination of topology and connectivity patterns2. Although numerous studies have supported that depression is linked to the disruption of structural covariance network (SCN) at both the topological and connectivity levels, most findings were inconsistent in small-scale and single-site studies3-6. In addition, prior group comparisons failed to account for the heterogeneity within the disease. One crucial question that remains unanswered is which level of network measurements (i.e., topology or connectivity) offers a more precise reflection of individual variation in MDD and thereby enables more accurate classification and phenotyping. This study, using a multi-site MRI dataset, aimed to characterize robust and reliable signatures of SCN disruption in MDD. Moreover, it seeks to discern the diagnostic value of brain network topology and connectivity.Methods
The dataset used in this study was shared by the DIRECT consortium, which contained a total of 955 MDD patients and 1009 healthy controls (HC) from 23 sites after data selection and quality control7. Patients were further categorized into first-episode drug-naïve (FEDN) and recurrent subgroups. Three-dimensional T1-weighted brain structural images were acquired at each site. All eligible raw images underwent unified image preprocessing procedures, and preprocessed gray matter volume (GMV) maps were parcellated into 246 regions according to the Brainnetome atlas8. Individualized SCN were established to represent the similarities of regional GMV probability distribution9. We used the BCT toolbox to calculate network topological metrics. ComBat harmonization was used for site effects correction. We first investigated case-control differences in topological metrics and structural connectivity between all/FEDN/recurrent MDD patients and HC. Next, we separately used topological metrics and connectivity as features to build linear support vector machine models for classification between patients and HC. The performance of topology- and connectivity-based models were assessed using accuracy, sensitivity, specificity and area under ROC curve (AUC).Results
Compared with HC, MDD patients exhibited increased global efficiency, abnormal regional centralities (i.e., thalamus, precentral gyrus, middle cingulate cortex and default mode network (DMN)) and altered circuit connectivity (i.e., ventral attention network (VAN) and frontoparietal network (FPN)). FEDN and recurrent patients exhibited different patterns of deficits in network topology and connectivity. Specifically, FEDN patients showed aberrant centralities in the thalamus, while topological deficits of DMN regions were found in recurrent patients. Both FEDN and recurrent patients showed hyperconnectivity of the VAN, while hypoconnectivity associated with FPN was only observed in recurrent patients.Based on network topological metrics, the SVM model achieved an accuracy of 73.3% (95%CI: 71.4-75.3%, AUC: 0.816) between MDD patients and HC. When using network connectivity as features, the classification accuracy dropped to 63.4% (95%CI: 61.3-65.6%, AUC: 0.690). Based on network topology, FEDN patients were distinguished from HC with an accuracy of 77.7% (95% CI: 74.8-80.6%, AUC: 0.849). With regard to network connectivity features, we observed a decreased accuracy of 67.5% (95%CI: 64.2-70.7%, AUC: 0.677). By setting network topological metrics as features, recurrent patients were differentiated from HC with an accuracy of 76.1% (95% CI: 73.1-79.1%, AUC: 0.791). For the network connectivity features, a comparable classification accuracy of 77.53% (95%CI: 74.6-80.5%, AUC: 0.838) was observed between recurrent patients and HC.
Discussion
Based on a sufficiently powered multi-site MRI dataset, we identified a robust pattern of SCN disruption in MDD at both topology and connectivity levels. Increased global efficiency in MDD patients indicated higher network integration10. Enhanced integration and preserved segregation represent a shift towards randomization pattern of gray matter connectome in MDD11, leading to impaired capability of fault tolerance12. Abnormal regions were found in multiple regions and circuitry involved in diverse depression-related psychological or behavioral processes, including psychomotor processing, cognitive control, social processing, emotion regulation and decision making13-16. Of note, deficits within the DMN and FPN were more specific to recurrent patients, which might be involved in antidepressant effects and cognitive worsen accompanied by repeated depressive episodes17,18. The individual-level classification analysis revealed that topological metrics outperformed connectivity in distinguishing MDD patients from HC, which could be potentially considered as a more reliable marker in MDD diagnosis. The same finding was replicated when characterizing FEDN patients, but was not observed for recurrent patients. We speculated that the reason might be that connectivity abnormalities may not be significant at early stage.Conclusion
Our findings advance the current understanding of connectome-level neurobiological mechanisms of MDD, providing a basis for development of high-order topological instead of connectivity markers for MDD diagnosis and phenotyping.Acknowledgements
We would like to thank the DIRECT consortium for data sharing.References
1. Gong Q, He Y. Depression, neuroimaging and connectomics: a selective overview. Biol Psychiatry 2015; 77(3): 223-35.
2. Fornito A, Bullmore ET. Connectomics: a new paradigm for understanding brain disease. Eur Neuropsychopharmacol 2015; 25(5): 733-48.
3. Chen C, Liu Z, Xi C, Tan W, Fan Z, Cheng Y et al. Multimetric structural covariance in first-episode major depressive disorder: a graph theoretical analysis. J Psychiatry Neurosci 2022; 47(3): E176-e85.
4. Xiong G, Dong D, Cheng C, Jiang Y, Sun X, He J et al. Potential structural trait markers of depression in the form of alterations in the structures of subcortical nuclei and structural covariance network properties. Neuroimage Clin 2021; 32: 102871.
5. Chen T, Kendrick KM, Wang J, Wu M, Li K, Huang X et al. Anomalous single-subject based morphological cortical networks in drug-naive, first-episode major depressive disorder. Hum Brain Mapp 2017; 38(5): 2482-94.
6. Li H, Yang J, Yin L, Zhang H, Zhang F, Chen Z et al. Alteration of single-subject gray matter networks in major depressed patients with suicidality. J Magn Reson Imaging 2021; 54(1): 215-24.
7. Yan CG, Chen X, Li L, Castellanos FX, Bai TJ, Bo QJ et al. Reduced default mode network functional connectivity in patients with recurrent major depressive disorder. Proc Natl Acad Sci U S A 2019; 116(18): 9078-83.
8. Fan L, Li H, Zhuo J, Zhang Y, Wang J, Chen L et al. The Human Brainnetome Atlas: A New Brain Atlas Based on Connectional Architecture. Cereb Cortex 2016; 26(8): 3508-26.
9. Kong XZ, Wang X, Huang L, Pu Y, Yang Z, Dang X et al. Measuring individual morphological relationship of cortical regions. J Neurosci Methods 2014; 237: 103-7.
10. Rubinov M, Sporns O. Complex network measures of brain connectivity: uses and interpretations. Neuroimage 2010; 52(3): 1059-69.
11. Suo XS, Lei DL, Li LL, Li WL, Dai JD, Wang SW et al. Psychoradiological patterns of small-world properties and a systematic review of connectome studies of patients with 6 major psychiatric disorders. J Psychiatry Neurosci 2018; 43(6): 427.
12. Latora V, Marchiori M. Efficient behavior of small-world networks. Phys Rev Lett 2001; 87(19): 198701.
13. Buyukdura JS, McClintock SM, Croarkin PE. Psychomotor retardation in depression: biological underpinnings, measurement, and treatment. Prog Neuropsychopharmacol Biol Psychiatry 2011; 35(2): 395-409.
14. Tolomeo S, Christmas D, Jentzsch I, Johnston B, Sprengelmeyer R, Matthews K et al. A causal role for the anterior mid-cingulate cortex in negative affect and cognitive control. Brain 2016; 139(Pt 6): 1844-54.
15. Apps MA, Lockwood PL, Balsters JH. The role of the midcingulate cortex in monitoring others' decisions. Front Neurosci 2013; 7: 251.
16. Taber KH, Wen C, Khan A, Hurley RA. The limbic thalamus. J Neuropsychiatry Clin Neurosci 2004; 16(2): 127-32.
17. Li B, Liu L, Friston KJ, Shen H, Wang L, Zeng LL et al. A treatment-resistant default mode subnetwork in major depression. Biol Psychiatry 2013; 74(1): 48-54.
18. Semkovska M, Quinlivan L, O'Grady T, Johnson R, Collins A, O'Connor J et al. Cognitive function following a major depressive episode: a systematic review and meta-analysis. Lancet Psychiatry 2019; 6(10): 851-61.
Figures
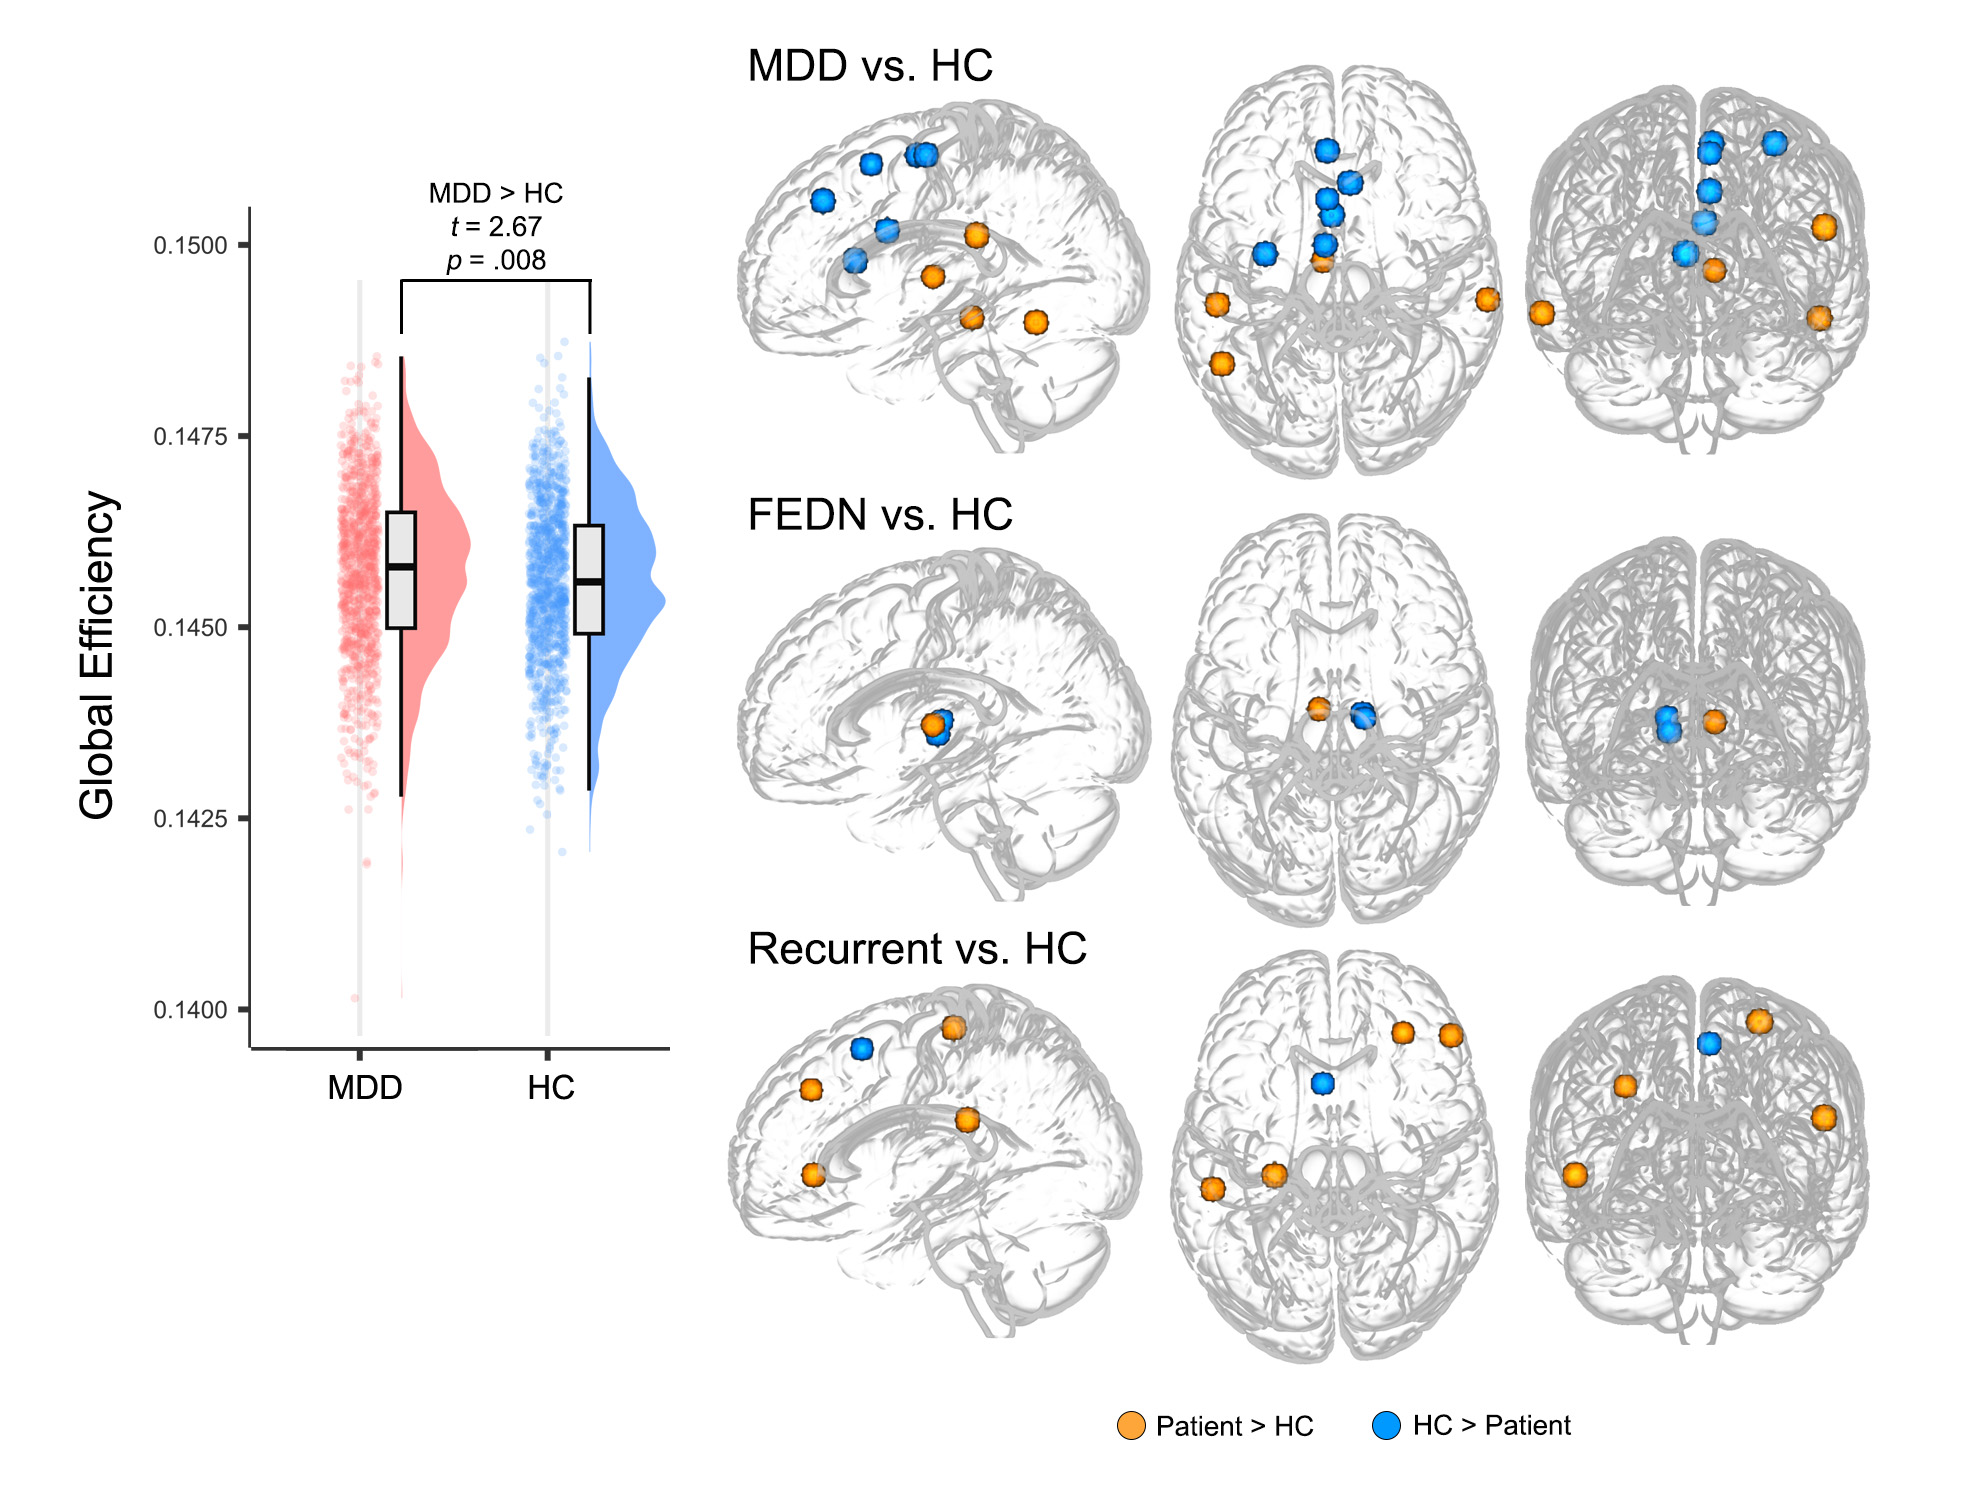
Figure 1 Group differences in global and nodal topological metrics.
The left panel shows the significant case-control difference in global efficiency. Nodes with significant differences after Bonferroni correction in either degree, betweenness and eigenvector centrality are presented in the right panel. The color of nodes indicates the direction of group differences.
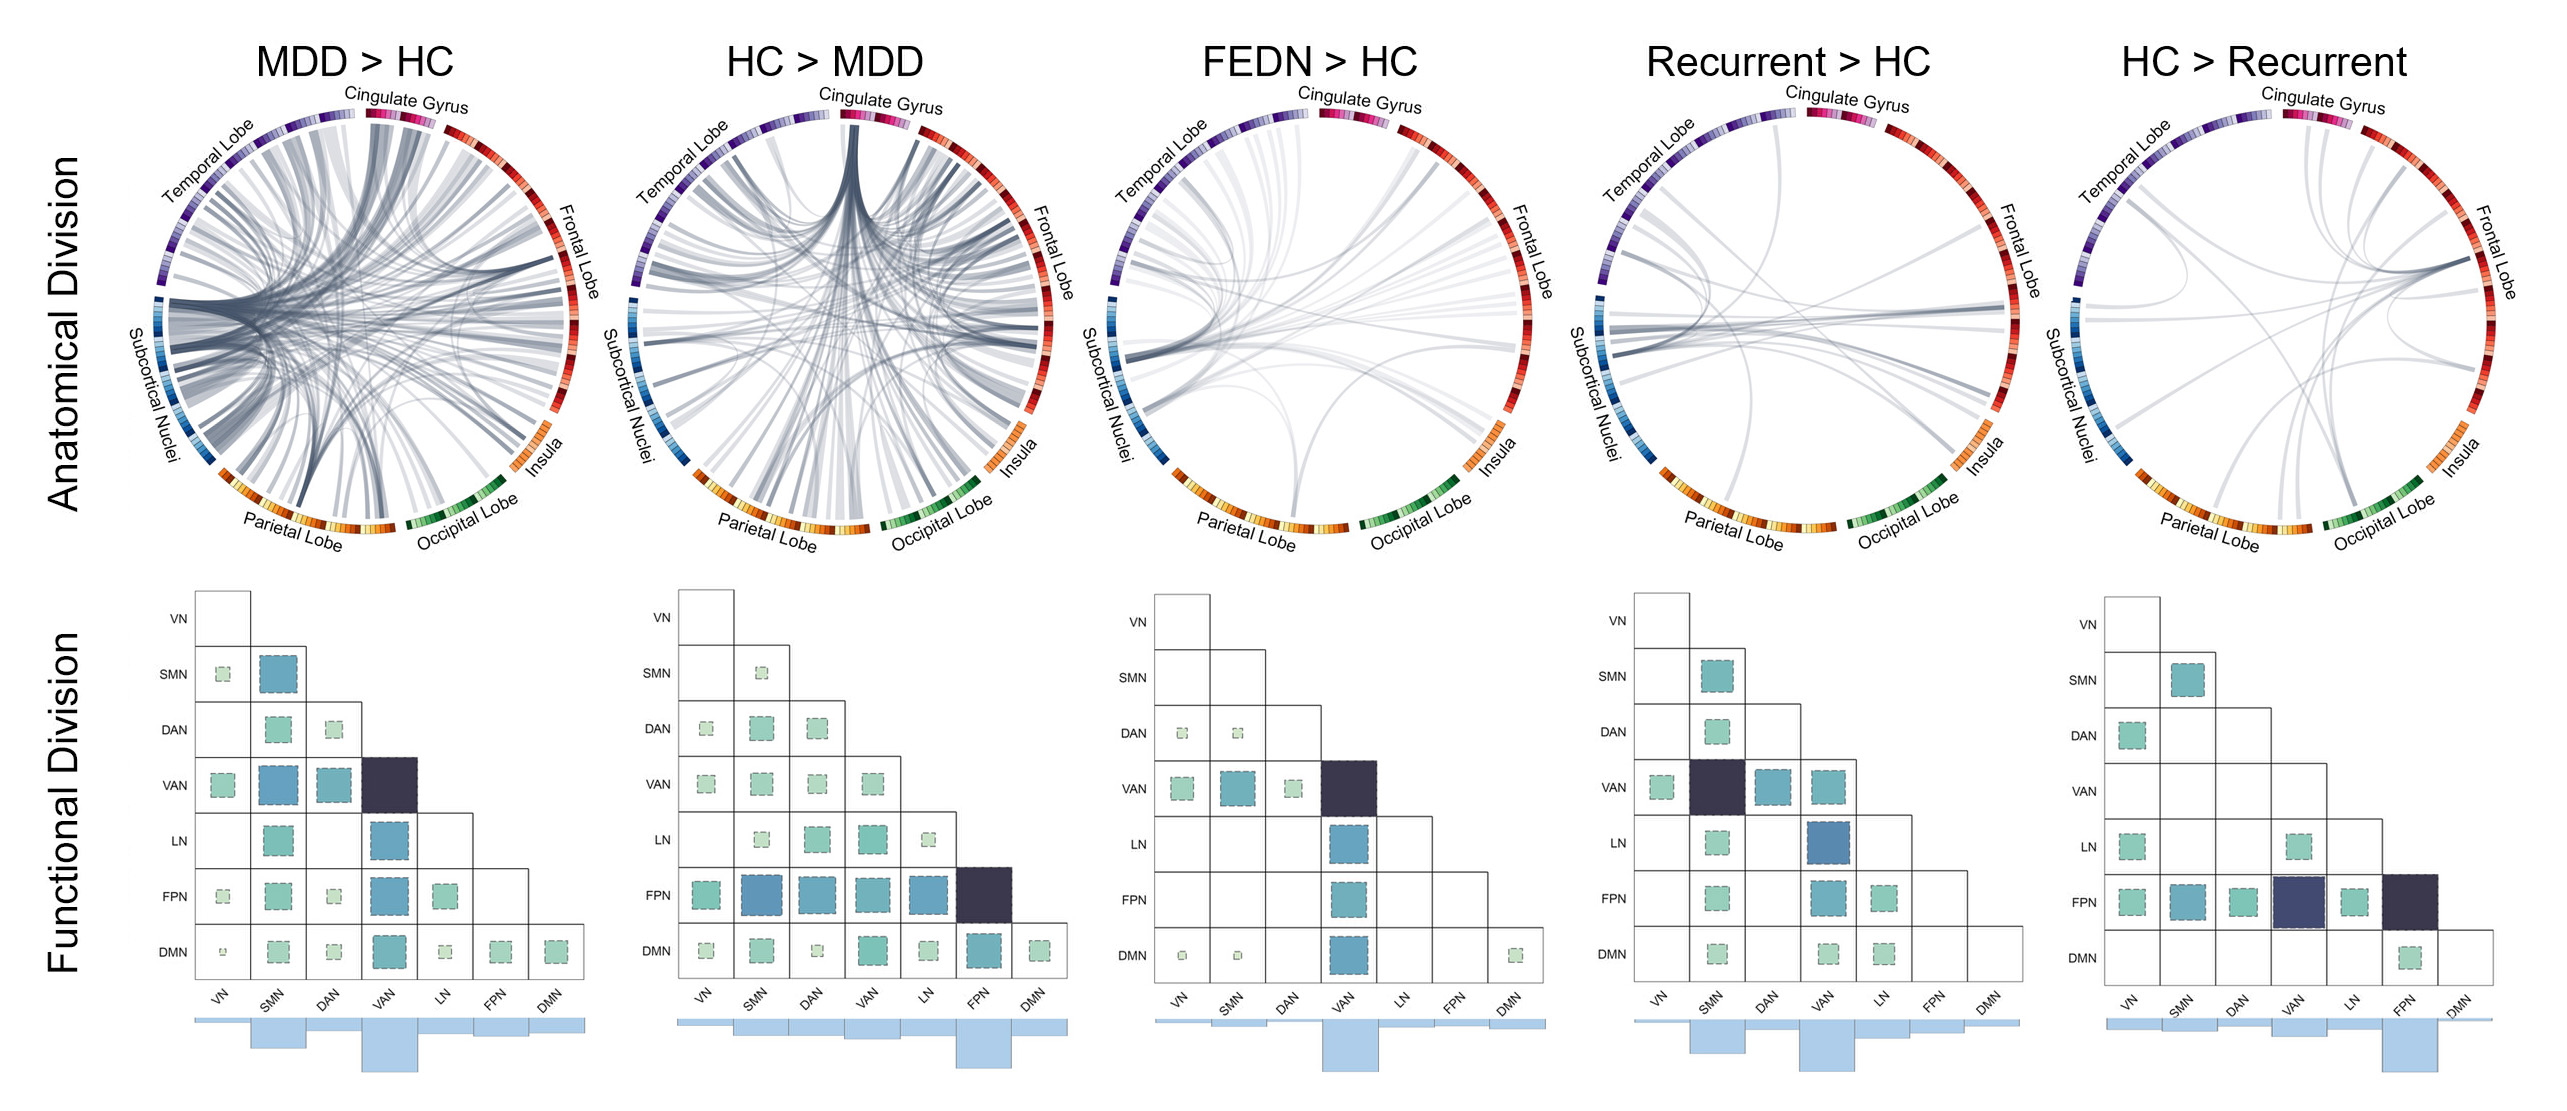
Figure 2 Abnormal connectivity patterns in MDD and clinical subgroups.
The upper panels show the significant connectivity patterns. The lower panels show the divisions of functional network of nodes. The darker color and the larger square denote the higher functional network connection weights. The histograms at the bottom show the sum of network connection weights.
Abbreviations: DMN, default mode network; FPN, frontoparietal network; VAN, ventral attention network; DAN, dorsal attention network; SMN, sensorimotor network; LN, limbic network; VN, visual network.
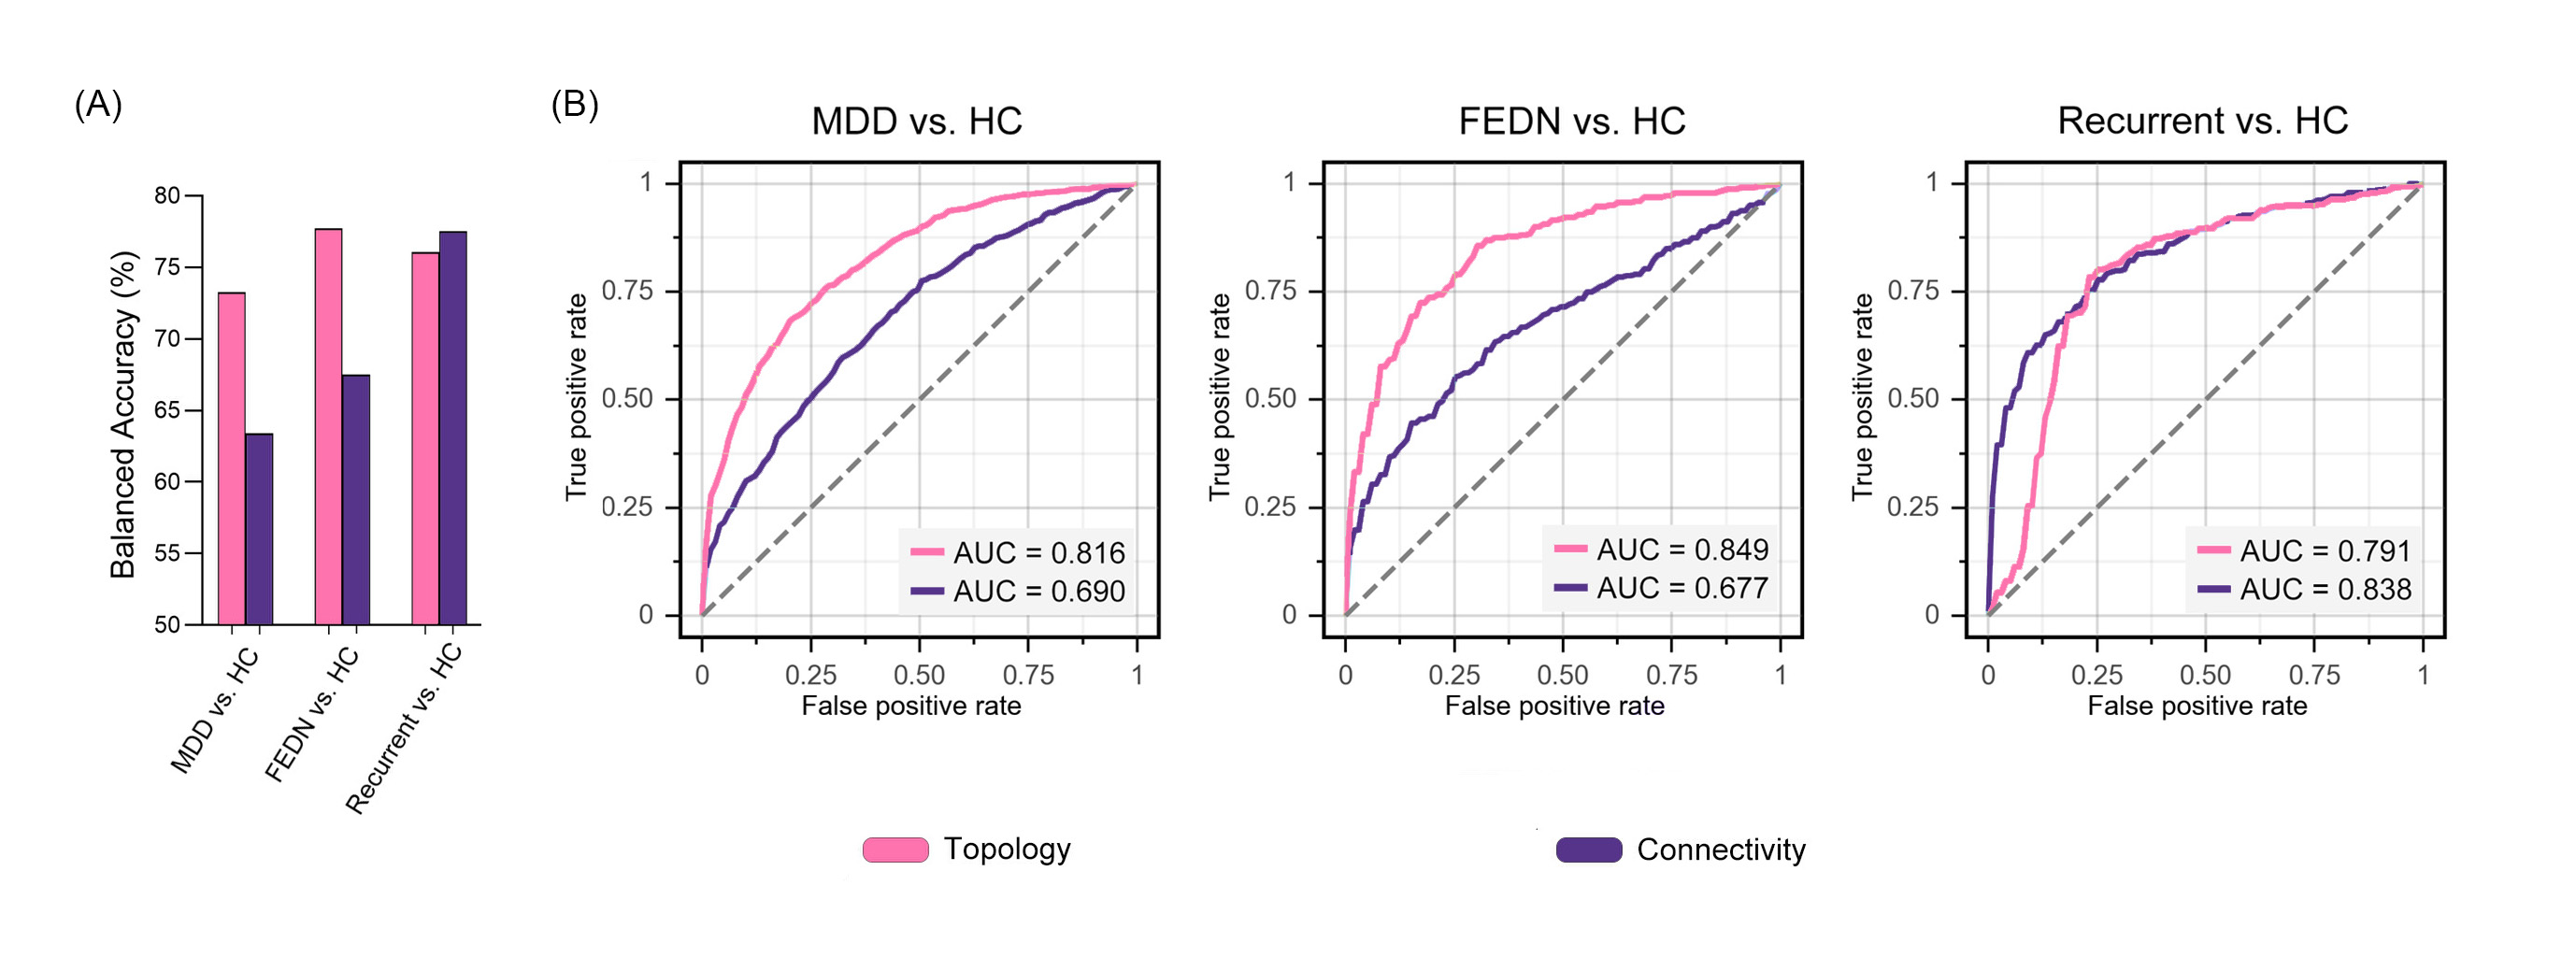
Figure 3 The Individual-level classification performance of topology- and connectivity-based models.
(A) Comparison of balanced accuracy between topology- and connectivity-based models across different classification tasks; (B) Receiver operating characteristic (ROC) curves of six models.