0436
Pilot Results Investigating Treatment Effects on Neurometabolites in Major Depressive Disorder: A 7T MRS Study of the Posterior Cingulate Cortex1Department of Psychiatry, Psychotherapy and Psychosomatics, RWTH Aachen University, Aachen, Germany, 2Institute of Neuroscience and Medicine, INM-4, Forschungszentrum Jülich, Juelich, Germany, 3JARA – BRAIN – Translational Medicine, Aachen, Germany, 4Center for Computational Life Science, RWTH Aachen University, Aachen, Germany, 5Department of Neurology, RWTH Aachen University, Aachen, Germany, 6Institute of Neuroscience and Medicine, INM-11, Forschungszentrum Jülich, Juelich, Germany
Synopsis
Keywords: Psychiatric Disorders, Psychiatric Disorders, MRS, MDD, Neurotransmitters, UHF
Motivation: This research addresses a critical gap by investigating the impact of depression treatment on neurometabolites in the PCC.
Goal(s): This exploratory study aims to investigate the relationship between neurometabolite levels in the PCC and assess its impact on treatment.
Approach: Structural MRI and MRS data were acquired from 16 MDD patients and 16 healthy controls. The concentration of neurometabolites was quantified. ANOVA models were used to assess differences between groups.
Results: Treatment effectively reduced depressive symptoms but did not significantly alter neurometabolite levels in the PCC. Factors such as medication, small sample size, and short follow-up intervals may have contributed to these results.
Impact: This research highlights that, despite effective treatment response in improving depressive symptoms in MDD patients, neurometabolite levels in the PCC were not significantly altered, emphasizing the necessity for further, more extensive research to comprehensively understand MDD and its treatment.
Introduction
Major depressive disorder (MDD) is a multifaceted condition resulting from a complex interplay between biological, behavioural, psychosocial, and cultural factors throughout an individual's lifespan1. Neurobiological investigations have revealed that depression is linked to neuronal atrophy in cortical and limbic brain regions, as well as disruptions in brain connectivity and network function. These changes result from structural, functional, and neurochemical deficiencies, with a notable dysfunction in the GABA and glutamate systems2. Building upon these observations, a recent review showed a global decrease in cortical GABA levels in MDD, with a tendency toward a localized decrease in Glx concentrations in the anterior cingulate cortex3. While most prior investigations have focused on comparing neurometabolite levels in healthy individuals and MDD patients, only a limited number of studies have explored the impact of treatment on levels of neurometabolites in MDD patients4–8. Thus, to address this limitation, we conducted an exploratory study using an MR spectroscopy (MRS) technique at a 7-Tesla (7T) ultrahigh field scanner to examine the impact of treatment on levels of neurometabolites in the posterior cingulate cortex (PCC) region of MDD patients. Since the PCC serves as a central node in the default mode network, showing abnormal structural, functional, and metabolic activity in MDD patients9, it has been chosen as a region of interest.Methods
Data Acquisition: The MR data were acquired from 32 subjects (16 depressed patients (age: 33 ± 12, 8 females) and 16 age and gender-matched healthy controls (HC, considered as baseline) subjects (age: 33 ± 12)) using a 7T MAGNETOM Terra scanner (Siemens Healthineers). The MDD patients were without psychotic symptoms and were undergoing treatment. MR measurements were conducted at 4–6-week intervals during the treatment. The treatment involved medication (Escitalopram, Bupropion, Sertralin, Citalopram) and psychotherapy. The Beck Depression Inventory (BDI-II) score was used to assess changes in depression symptoms over the course of the treatment. The structural MRI and MRS data were acquired in the same session, during both measurements.Structural MRI: MP2RAGE sequence - TR/TE 4500ms/1.99ms, voxel-size 0.75 mm3 isotropic resolution.
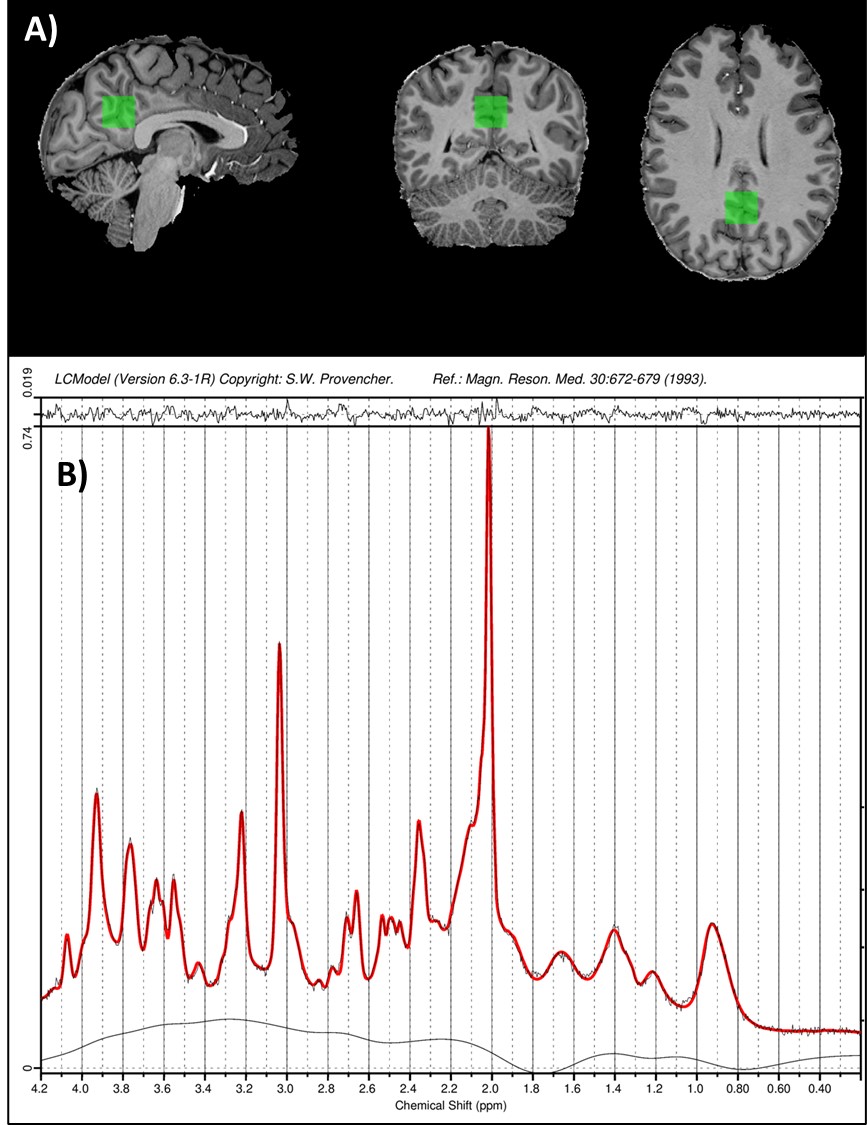
Single-voxel MRS: STEAM sequence10–12 with ultra-short echo-time: TE = 4.6ms; TM = 28 ms; TR = 8200ms; 64 averages; voxel-size 20×20×20mm3. The sequence included water suppression (VAPOR) and outer-volume suppression modules13. MR-spectra were pre-processed (motion, frequency and phase drift corrections) and fitted using the FID-A package14 and LCModel (6.3-0I)15, respectively. The metabolite concentrations with a Cramer-Rao lower bound above 20% were excluded. The absolute concentrations of Asp, Glu, Gln, GSH, Ins, NAA, NAAG and GABA were calculated16.
Statistical Analysis: To study the effect of experimental group differences, a univariate ANOVA model was designed separately for each neurometabolite with absolute concentrations as dependent variables, experimental groups (HC and MDD session-1) as factors, and age, gender, and BDI-II as covariates. Similarly, to assess longitudinal changes in neurometabolite levels, a repeated measures ANOVA model was designed for each neurometabolite with absolute concentrations as dependent variables, with-in subject as factors (MDD session-1 and session-2), and age and gender as covariates. To increase the reliability of the findings, bootstrapping was performed with 1000 samples.
Results
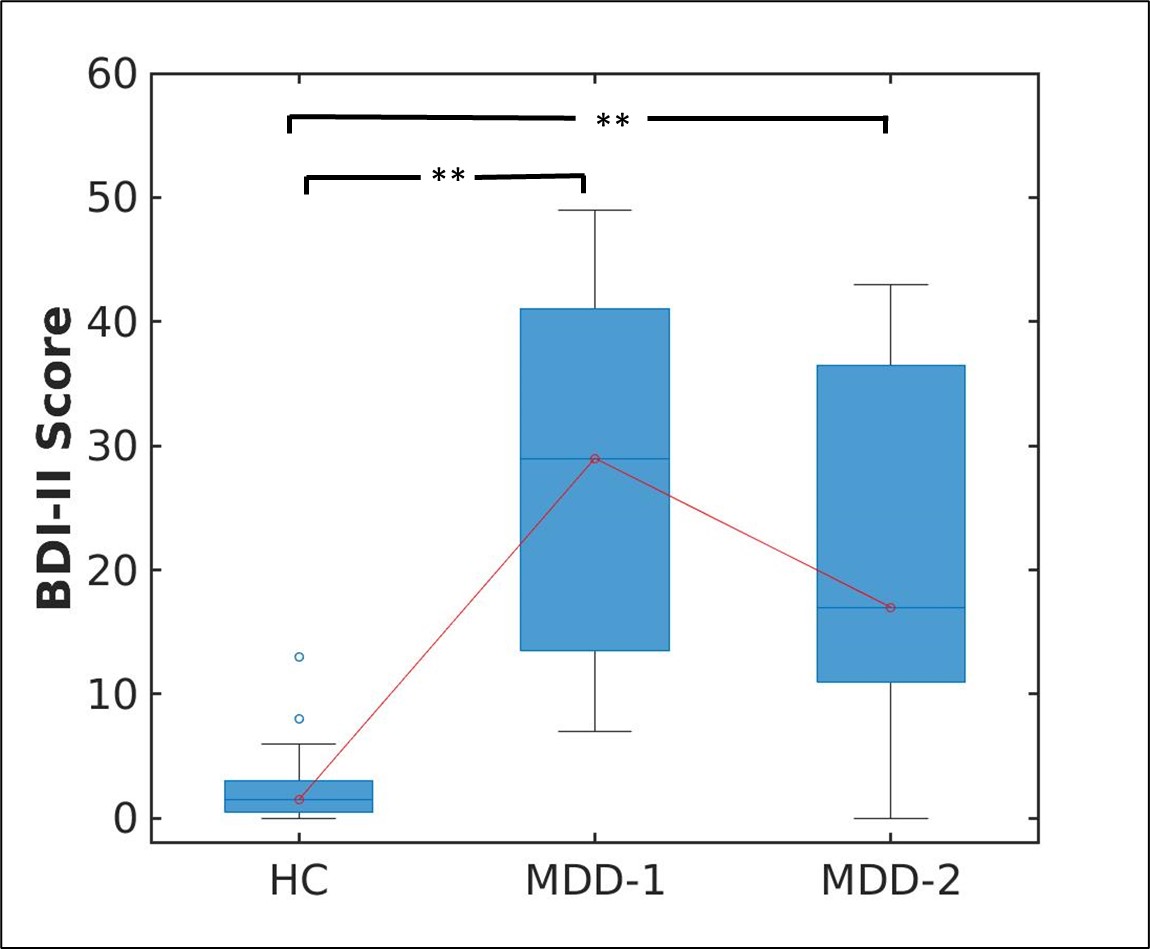
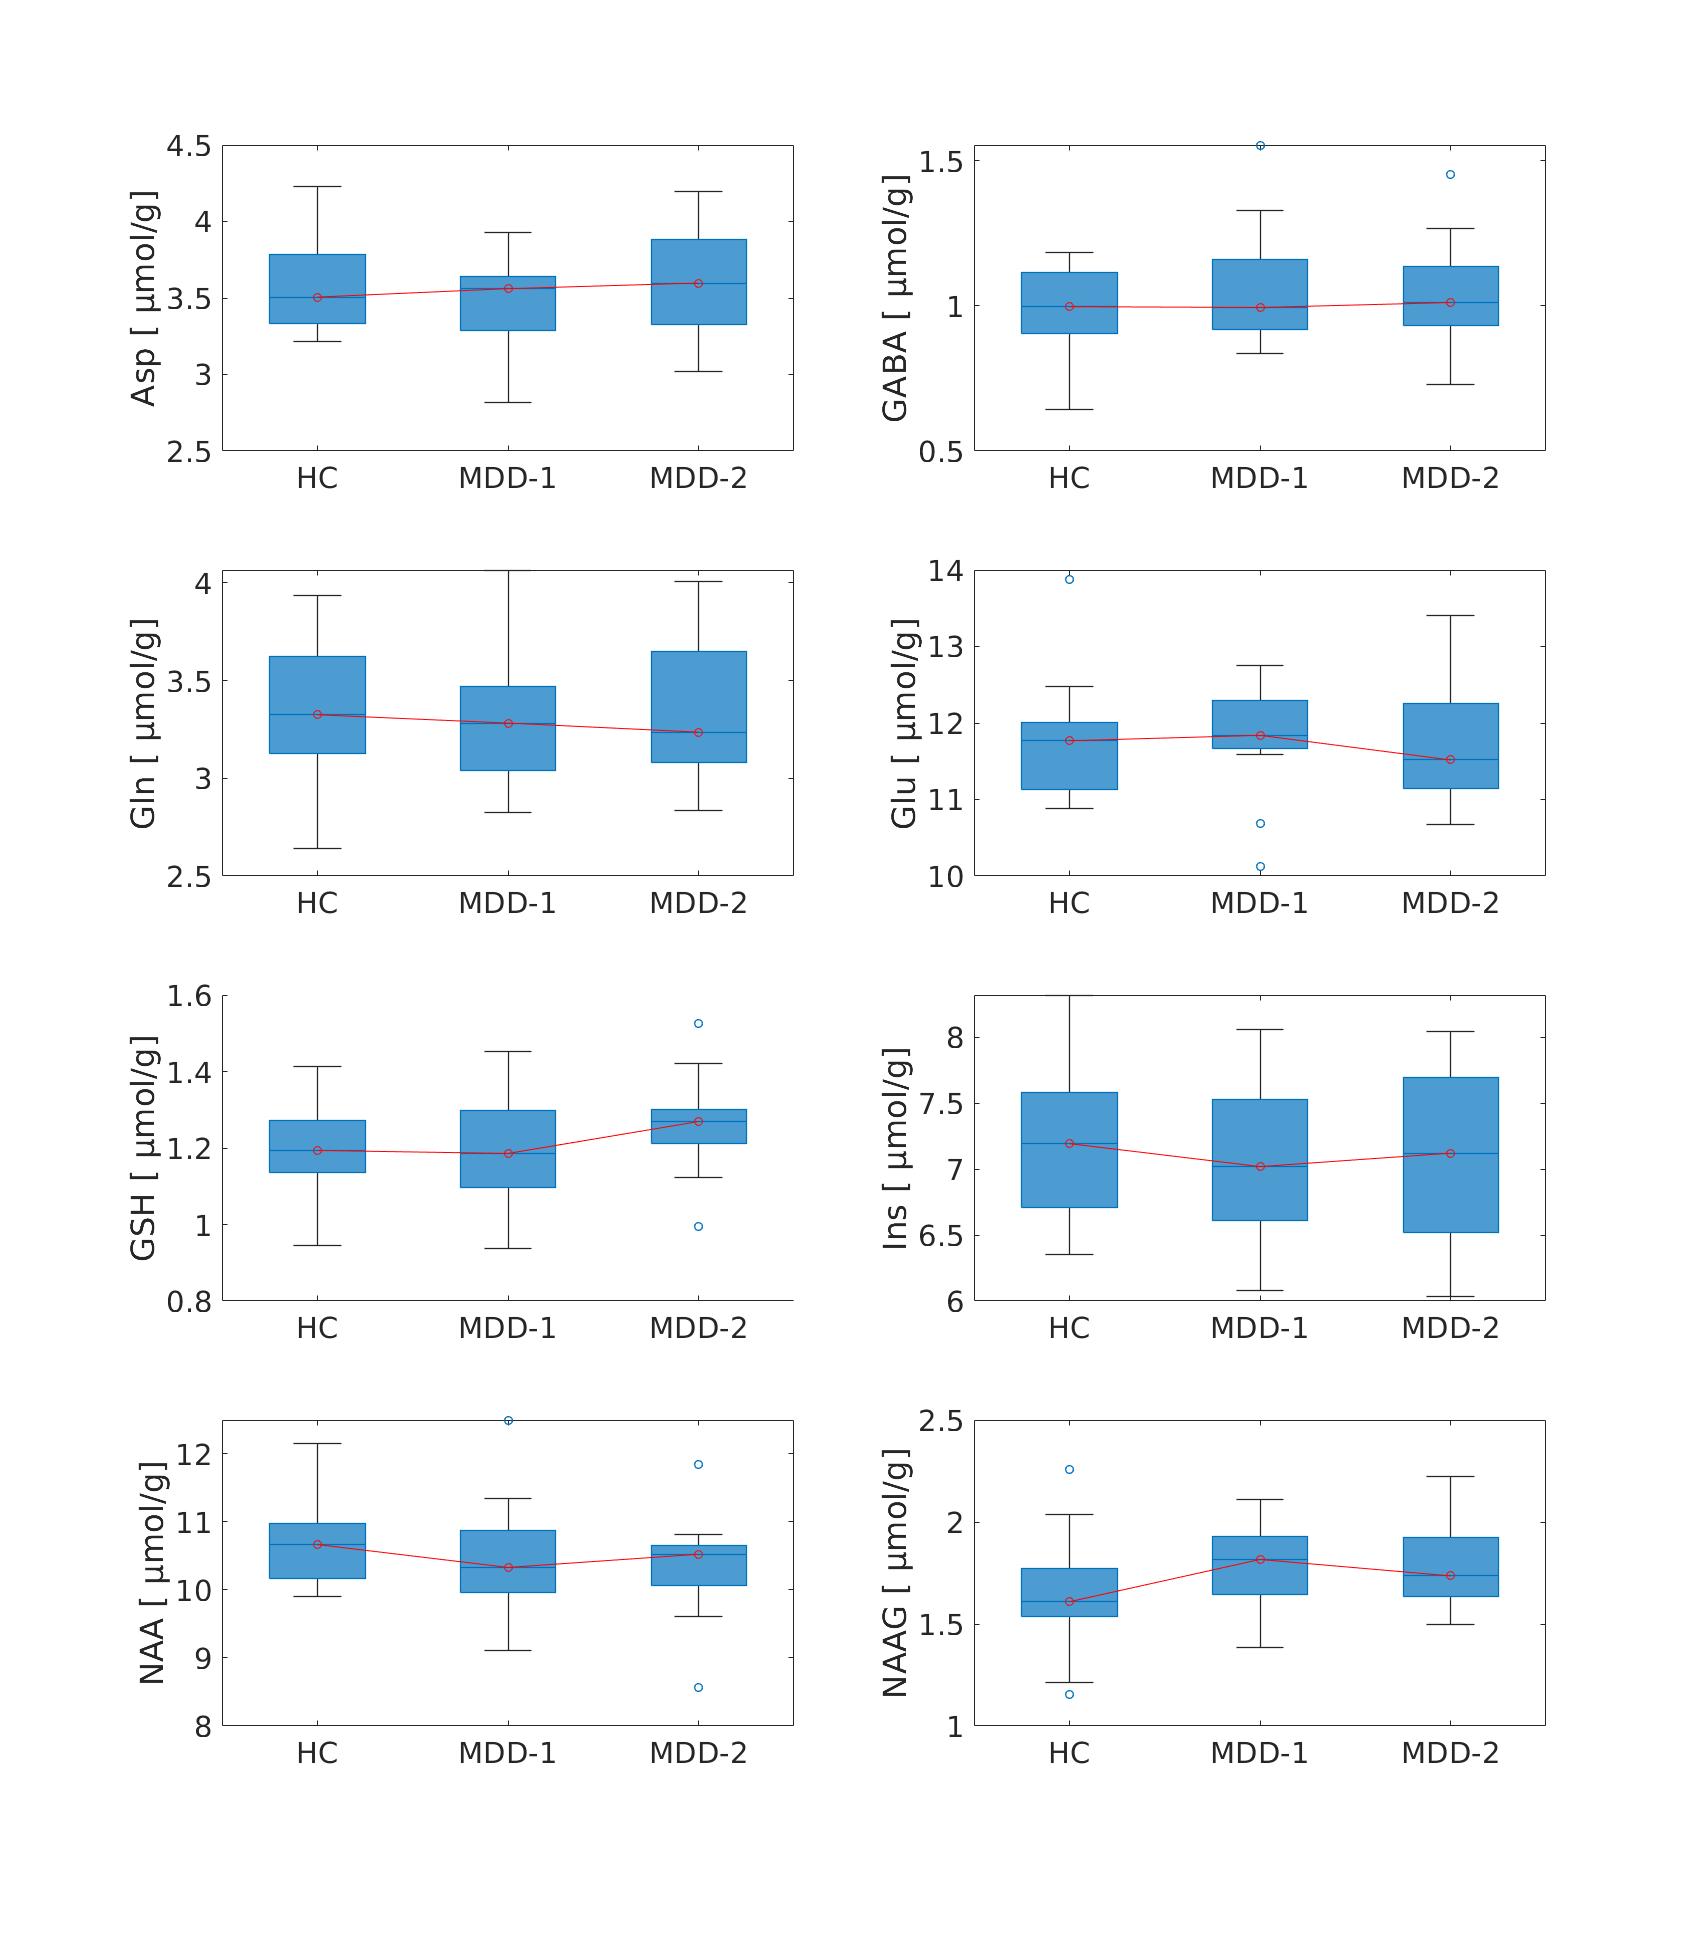
The Kruskal-Wallis test with post-hoc analyses showed a statistically significant (p<0.001) difference in BDI-II between HC and MDD patients(Fig. 2). However, the test results from both the Univariate ANOVA and the repeated measures ANOVA indicate that there were no statistically significant differences in neurometabolite concentrations between and within the experimental groups, respectively (Fig. 3).Discussions
The observed differences in BDI-II scores (Fig. 2) between HC and MDD patients in both sessions confirm the effectiveness of the treatment in improving depressive symptoms. However, a lack of statistically significant differences (Fig. 3) in neurometabolite concentration between the experimental groups suggests that the treatment administered in this study may not have induced significant alterations in neurometabolite levels within the PCC over the course of treatment. Several factors may have contributed to these results, including medication, the limited sample size, and the relatively short 4-6-week follow-up intervals. In the current analysis, it was not possible to include medication details due to dimensionality issues. Further analysis of more MDD patients receiving identical medication and treatment with longer follow-up times may help in finding the effect of antidepressant treatment on neurometabolite concentrations.Conclusions
These findings underscore the need for further research to explore potential variations in the profiles of neurometabolites in a broader MDD population and to assess their dynamics over extended periods by including cognitive and behavioural data. Moreover, the study's design and methodology did not account for all potential variability in neurometabolite concentrations in MDD, indicating the need for more comprehensive investigation in the future.Acknowledgements
The authors would like to thank Petra Engels, Elke Bechholz, and Anita Köth for their technical assistance during the scans and Claire Rick for proofreading the abstract. We would like to acknowledge E.J. Auerbach and M. Marjanska (Center for Magnetic Resonance Research and Department of Radiology, University of Minnesota, USA) for the development of the STEAM sequence for the Siemens platform, which was provided by the University of Minnesota under a C2P agreement.References
1. Clark LA, Cuthbert B, Lewis-Fernández R, Narrow WE, Reed GM. Three Approaches to Understanding and Classifying Mental Disorder: ICD-11, DSM-5, and the National Institute of Mental Health’s Research Domain Criteria (RDoC). Psychol Sci Public Interes. 2017;18(2). doi:10.1177/1529100617727266
2. Duman RS, Sanacora G, Krystal JH. Altered Connectivity in Depression: GABA and Glutamate Neurotransmitter Deficits and Reversal by Novel Treatments. Neuron. 2019. doi:10.1016/j.neuron.2019.03.013
3. Godfrey KEM, Gardner AC, Kwon S, Chea W, Muthukumaraswamy SD. Differences in excitatory and inhibitory neurotransmitter levels between depressed patients and healthy controls: A systematic review and meta-analysis. J Psychiatr Res. 2018;105. doi:10.1016/j.jpsychires.2018.08.015
4. Caverzasi E, Pichiecchio A, Poloni GU, et al. Magnetic resonance spectroscopy in the evaluation of treatment efficacy in unipolar major depressive disorder: A review of the literature. Funct Neurol. 2012;27(1).
5. Boucherie DE, Reneman L, Ruhé HG, Schrantee A. Neurometabolite changes in response to antidepressant medication: A systematic review of 1H-MRS findings. NeuroImage Clin. 2023;40:103517. doi:10.1016/j.nicl.2023.103517
6. Brennan BP, Admon R, Perriello C, et al. Acute change in anterior cingulate cortex GABA, but not glutamine/glutamate, mediates antidepressant response to citalopram. Psychiatry Res - Neuroimaging. 2017;269. doi:10.1016/j.pscychresns.2017.08.009
7. Zhang J, Narr KL, Woods RP, Phillips OR, Alger JR, Espinoza RT. Glutamate normalization with ECT treatment response in major depression. Mol Psychiatry. 2013;18(3). doi:10.1038/mp.2012.46
8. Njau S, Joshi SH, Espinoza R, et al. Neurochemical correlates of rapid treatment response to electroconvulsive therapy in patients with major depression. J Psychiatry Neurosci. 2017;42(1). doi:10.1503/jpn.150177
9. Zhang K, Zhu Y, Zhu Y, et al. Molecular, Functional, and Structural Imaging of Major Depressive Disorder. Neurosci Bull. 2016;32(3). doi:10.1007/s12264-016-0030-0
10. Tkáč I, Öz G, Adriany G, Uǧurbil K, Gruetter R. In vivo 1H NMR spectroscopy of the human brain at high magnetic fields: Metabolite quantification at 4T vs. 7T. Magn Reson Med. 2009;62(4). doi:10.1002/mrm.22086
11. Tkáč I, Starčuk Z, Choi IY, Gruetter R. In vivo 1H NMR spectroscopy of rat brain at 1 ms echo time. Magn Reson Med. 1999;41(4). doi:10.1002/(SICI)1522-2594(199904)41:4<649::AID-MRM2>3.0.CO;2-G
12. Gruetter R, Tkác I. Field mapping without reference scan using asymmetric echo-planar techniques. Magn Reson Med. 2000;43(2):319-323.
13. Tkác I, Andersen P, Adriany G, Merkle H, Uurbil K, Gruetter R. In vivo 1H NMR spectroscopy of the human brain at 7 T. Magn Reson Med. 2001. doi:10.1002/mrm.1213
14. Simpson R, Devenyi GA, Jezzard P, Hennessy TJ, Near J. Advanced processing and simulation of MRS data using the FID appliance (FID-A)—An open source, MATLAB-based toolkit. Magn Reson Med. 2017;77(1). doi:10.1002/mrm.26091
15. Provencher SW. Automatic quantitation of localized in vivo 1H spectra with LCModel. NMR Biomed. 2001;14(4):260-264. http://www.ncbi.nlm.nih.gov/pubmed/11410943. Accessed July 13, 2016.
16. Gasparovic C, Song T, Devier D, et al. Use of tissue water as a concentration reference for proton spectroscopic imaging. Magn Reson Med. 2006;55(6). doi:10.1002/mrm.20901
Figures