0435
Explainable depression classification: a machine learning approach based on brain network size and functional connectivity1Electrical Engineering, Eindhoven University of Technology, Eindhoven, Netherlands, 2Research and Development, Epilepsy Centre Kempenhaeghe, Heeze, Netherlands, 3Biomedical Engineering, Eindhoven University of Technology, Eindhoven, Netherlands, 4Philips Healthcare, Best, Netherlands, 5Radiology and Nuclear Medicine, Maastricht University Medical Center, Maastricht, Netherlands, 6School for Mental Health and Neuroscience, Maastricht University, Maastricht, Netherlands
Synopsis
Keywords: Psychiatric Disorders, Psychiatric Disorders, depression
Motivation: Major depressive disorder (MDD) affects ~6% of adults annually worldwide, but a lack of understanding of the pathology and heterogeneity may underlie its low treatment effectiveness.
Goal(s): This study aimed to identify explainable functional MRI biomarkers of MDD on an individual level.
Approach: Classification models were run to predict MDD for three functional measures.
Results: In two datasets, >70% MDD accuracy was achieved for each measure. Highest performance was obtained with region-based functional connectivity but spatial extent provided novel perspectives on abnormal brain functioning, such as decreased cerebellum involvement in the frontoparietal network, potentially reflecting decreased emotion regulation or control during cognitive processes.
Impact: This MRI research contributes to the identification of robust depression biomarkers, enhancing our understanding of the abnormal brain functioning. The explainability of the spatial extent feature provides additional insights into its pathology which may be utilized for diagnostic tools.
Introduction
Major depressive disorder (MDD) is a neurological disorder that affects approximately 6% of the global adult population annually1. Yet, only one-third remits after first-line treatment2. Subjective clinical-decision making and a lack of the understanding of the pathology and heterogeneity of MDD may underlie the low treatment effectiveness. Functional MRI (fMRI) studies have demonstrated aberrant functional patterns in MDD3–5 but these findings are often group-level based6, or have low generalizability7 or interpretability8. Therefore, this study aims to identify of individual, objective and explainable fMRI-derived biomarkers of MDD.Methods
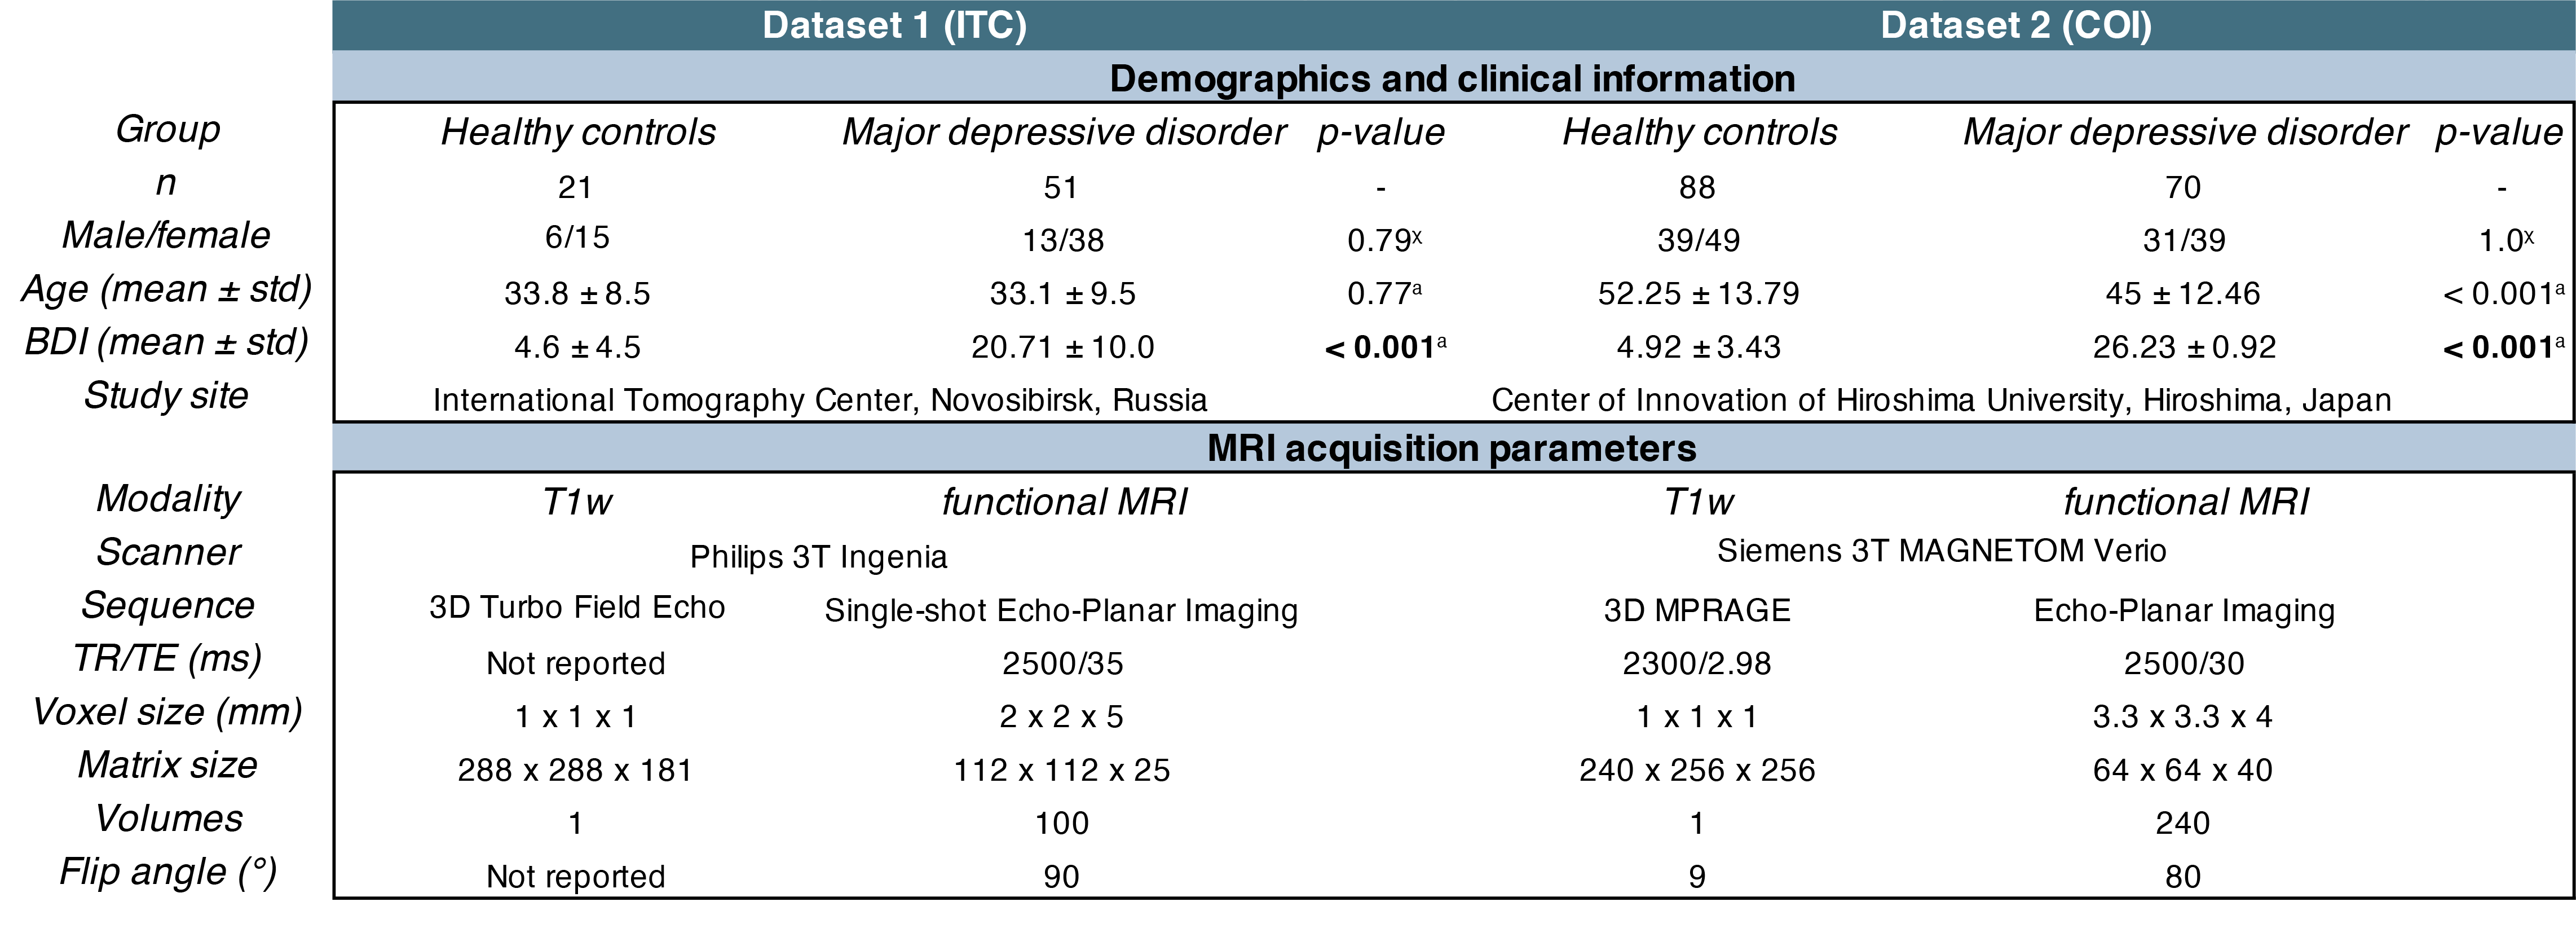
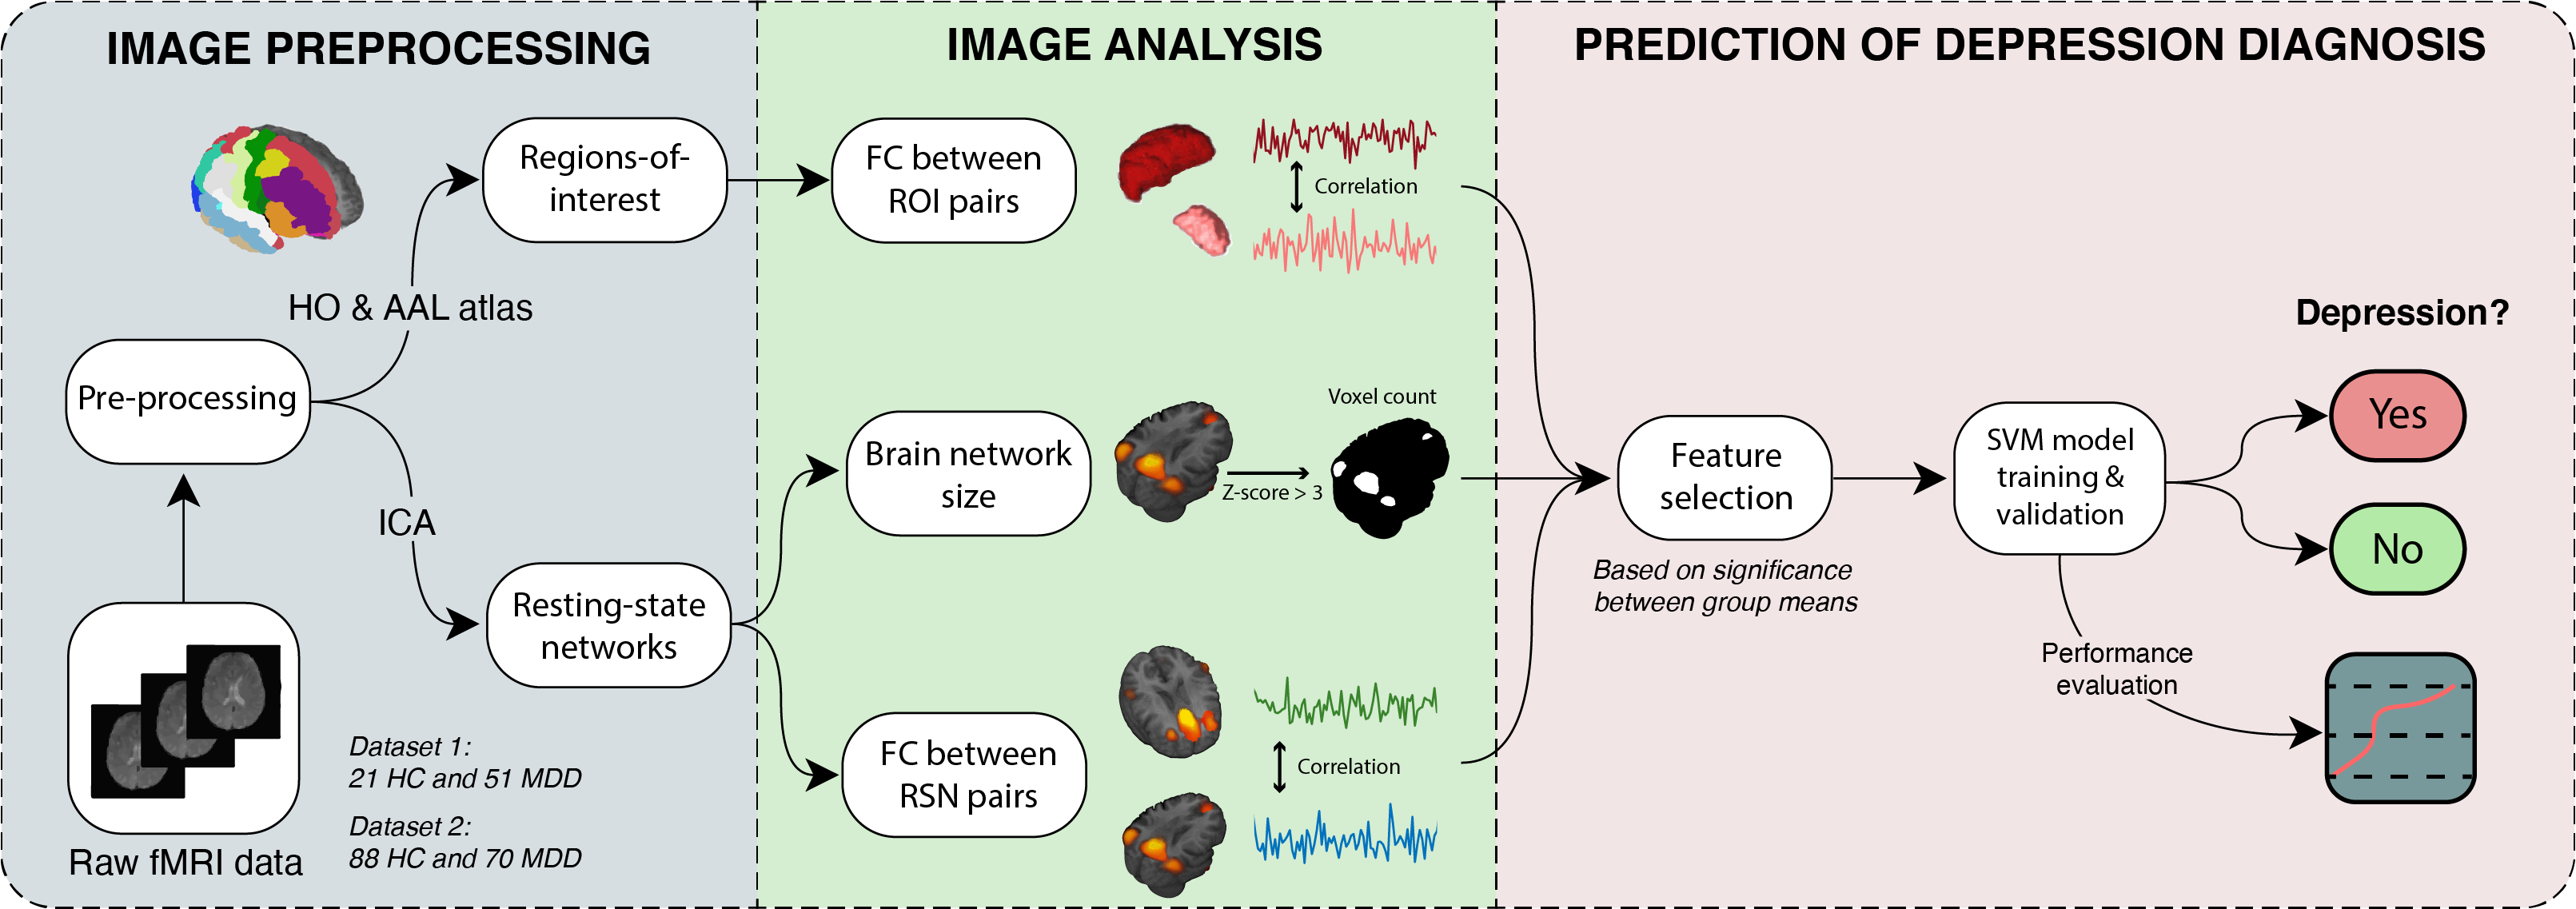
Two resting-state fMRI datasets were investigated in this study (for demographics and MRI acquisition parameters, see Figure 1)9,10. The first dataset9 was used for model training and validation and contained 21 healthy control (HC) and 51 MDD participants. The second dataset10 existed of 88 HC and 70 MDD participants and was used for robustness assessment. All participants signed informed consent. Using the CONN toolbox11, fMRI images were slice timing corrected, realigned, coregistered to the T1-weighted image, spatially normalized and smoothed (σ=5mm and 8mm). White matter and cerebral spinal fluid components were regressed out of the signals (CompCor12). The Harvard-Oxford and AAL atlas were used to extract mean signals in 132 regions-of-interest (ROIs)11. Independent component analysis resulted in 15 and 13 resting-state networks (RSNs) for dataset 1 and 2, respectively. Functional connectivity (FC) matrices of all unique ROI- and RSN-pairs were calculated as the z-transformed Pearson correlation. Furthermore, the spatial extent, equal to the number of significant voxels (z-score>3), was used for the first time in MDD classification. An SVM model (radial basis function) was trained for each of the 3 fMRI measures and validated (stratified nested cross-validation; 10-fold and 8-fold for the outer and inner loop, respectively). Features (individual ROI-pairs, RSN-pairs or spatial extent of each RSN) were added to the SVM model by starting with the most significant one (lowest p-value of MDD-HC group differences in mean) and then iteratively adding the next most significant one until the optimal (maximal accuracy) number of features was reached. The steps described above were re-run on the second dataset to test its robustness. An overview of the methodology is depicted in Figure 2.Results
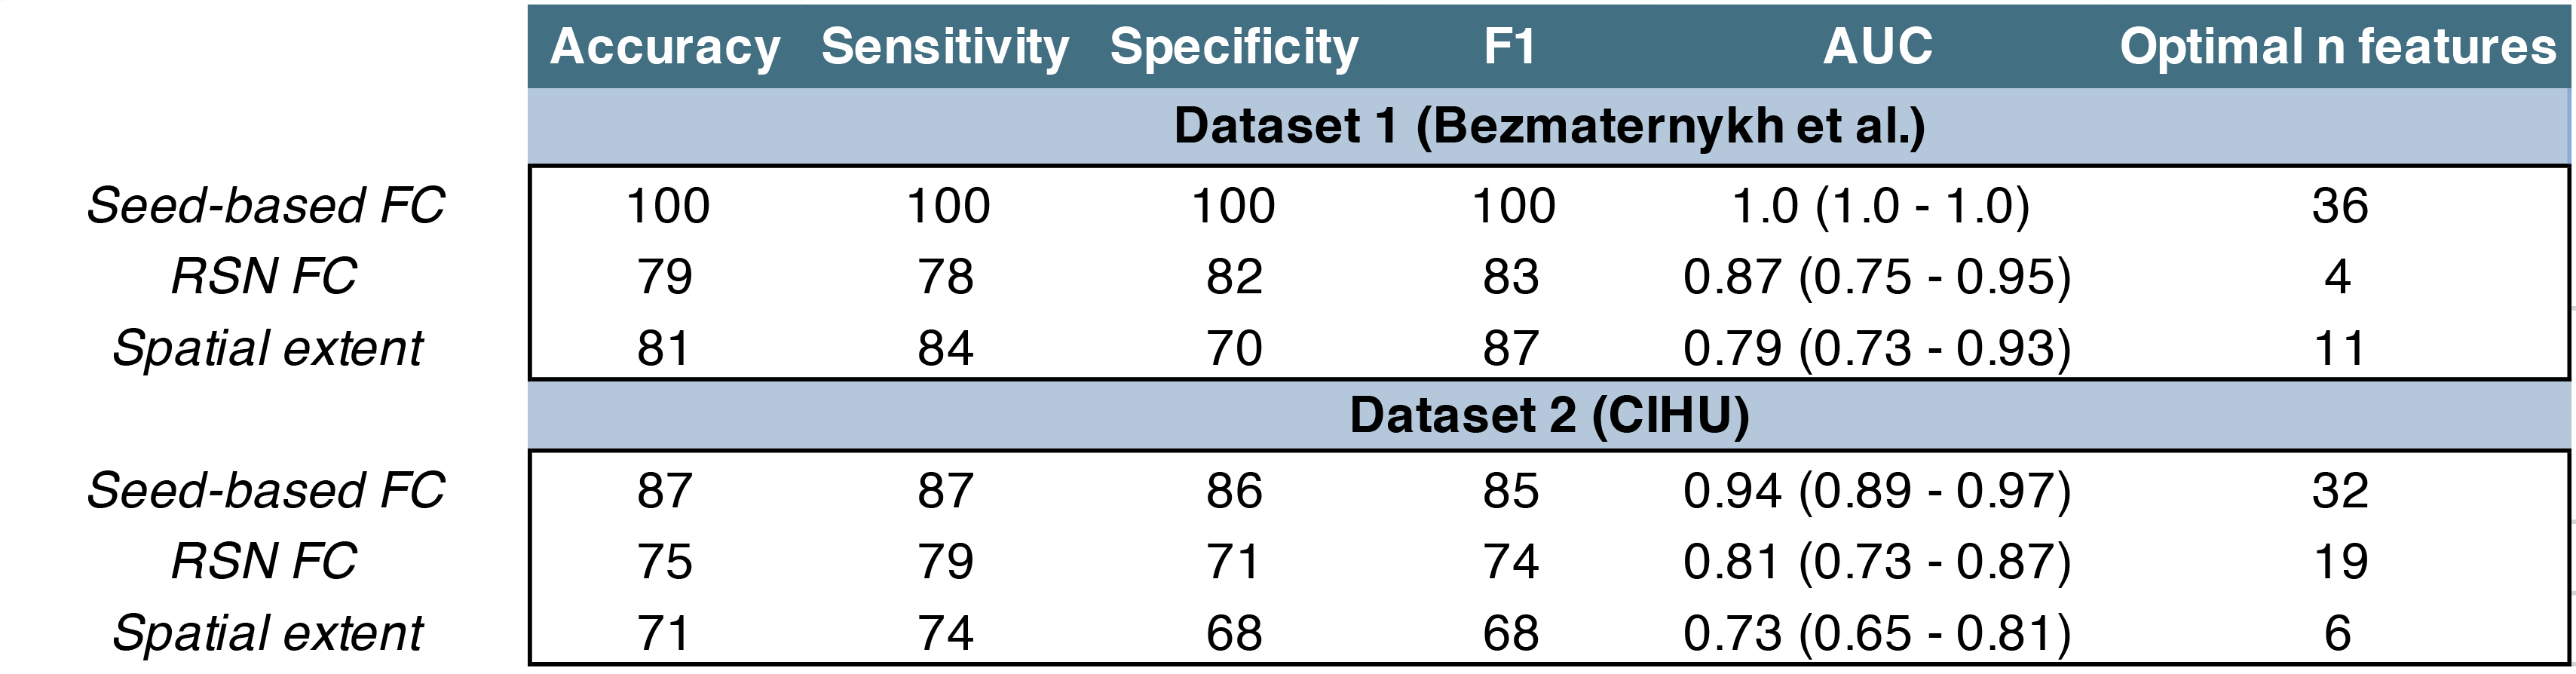
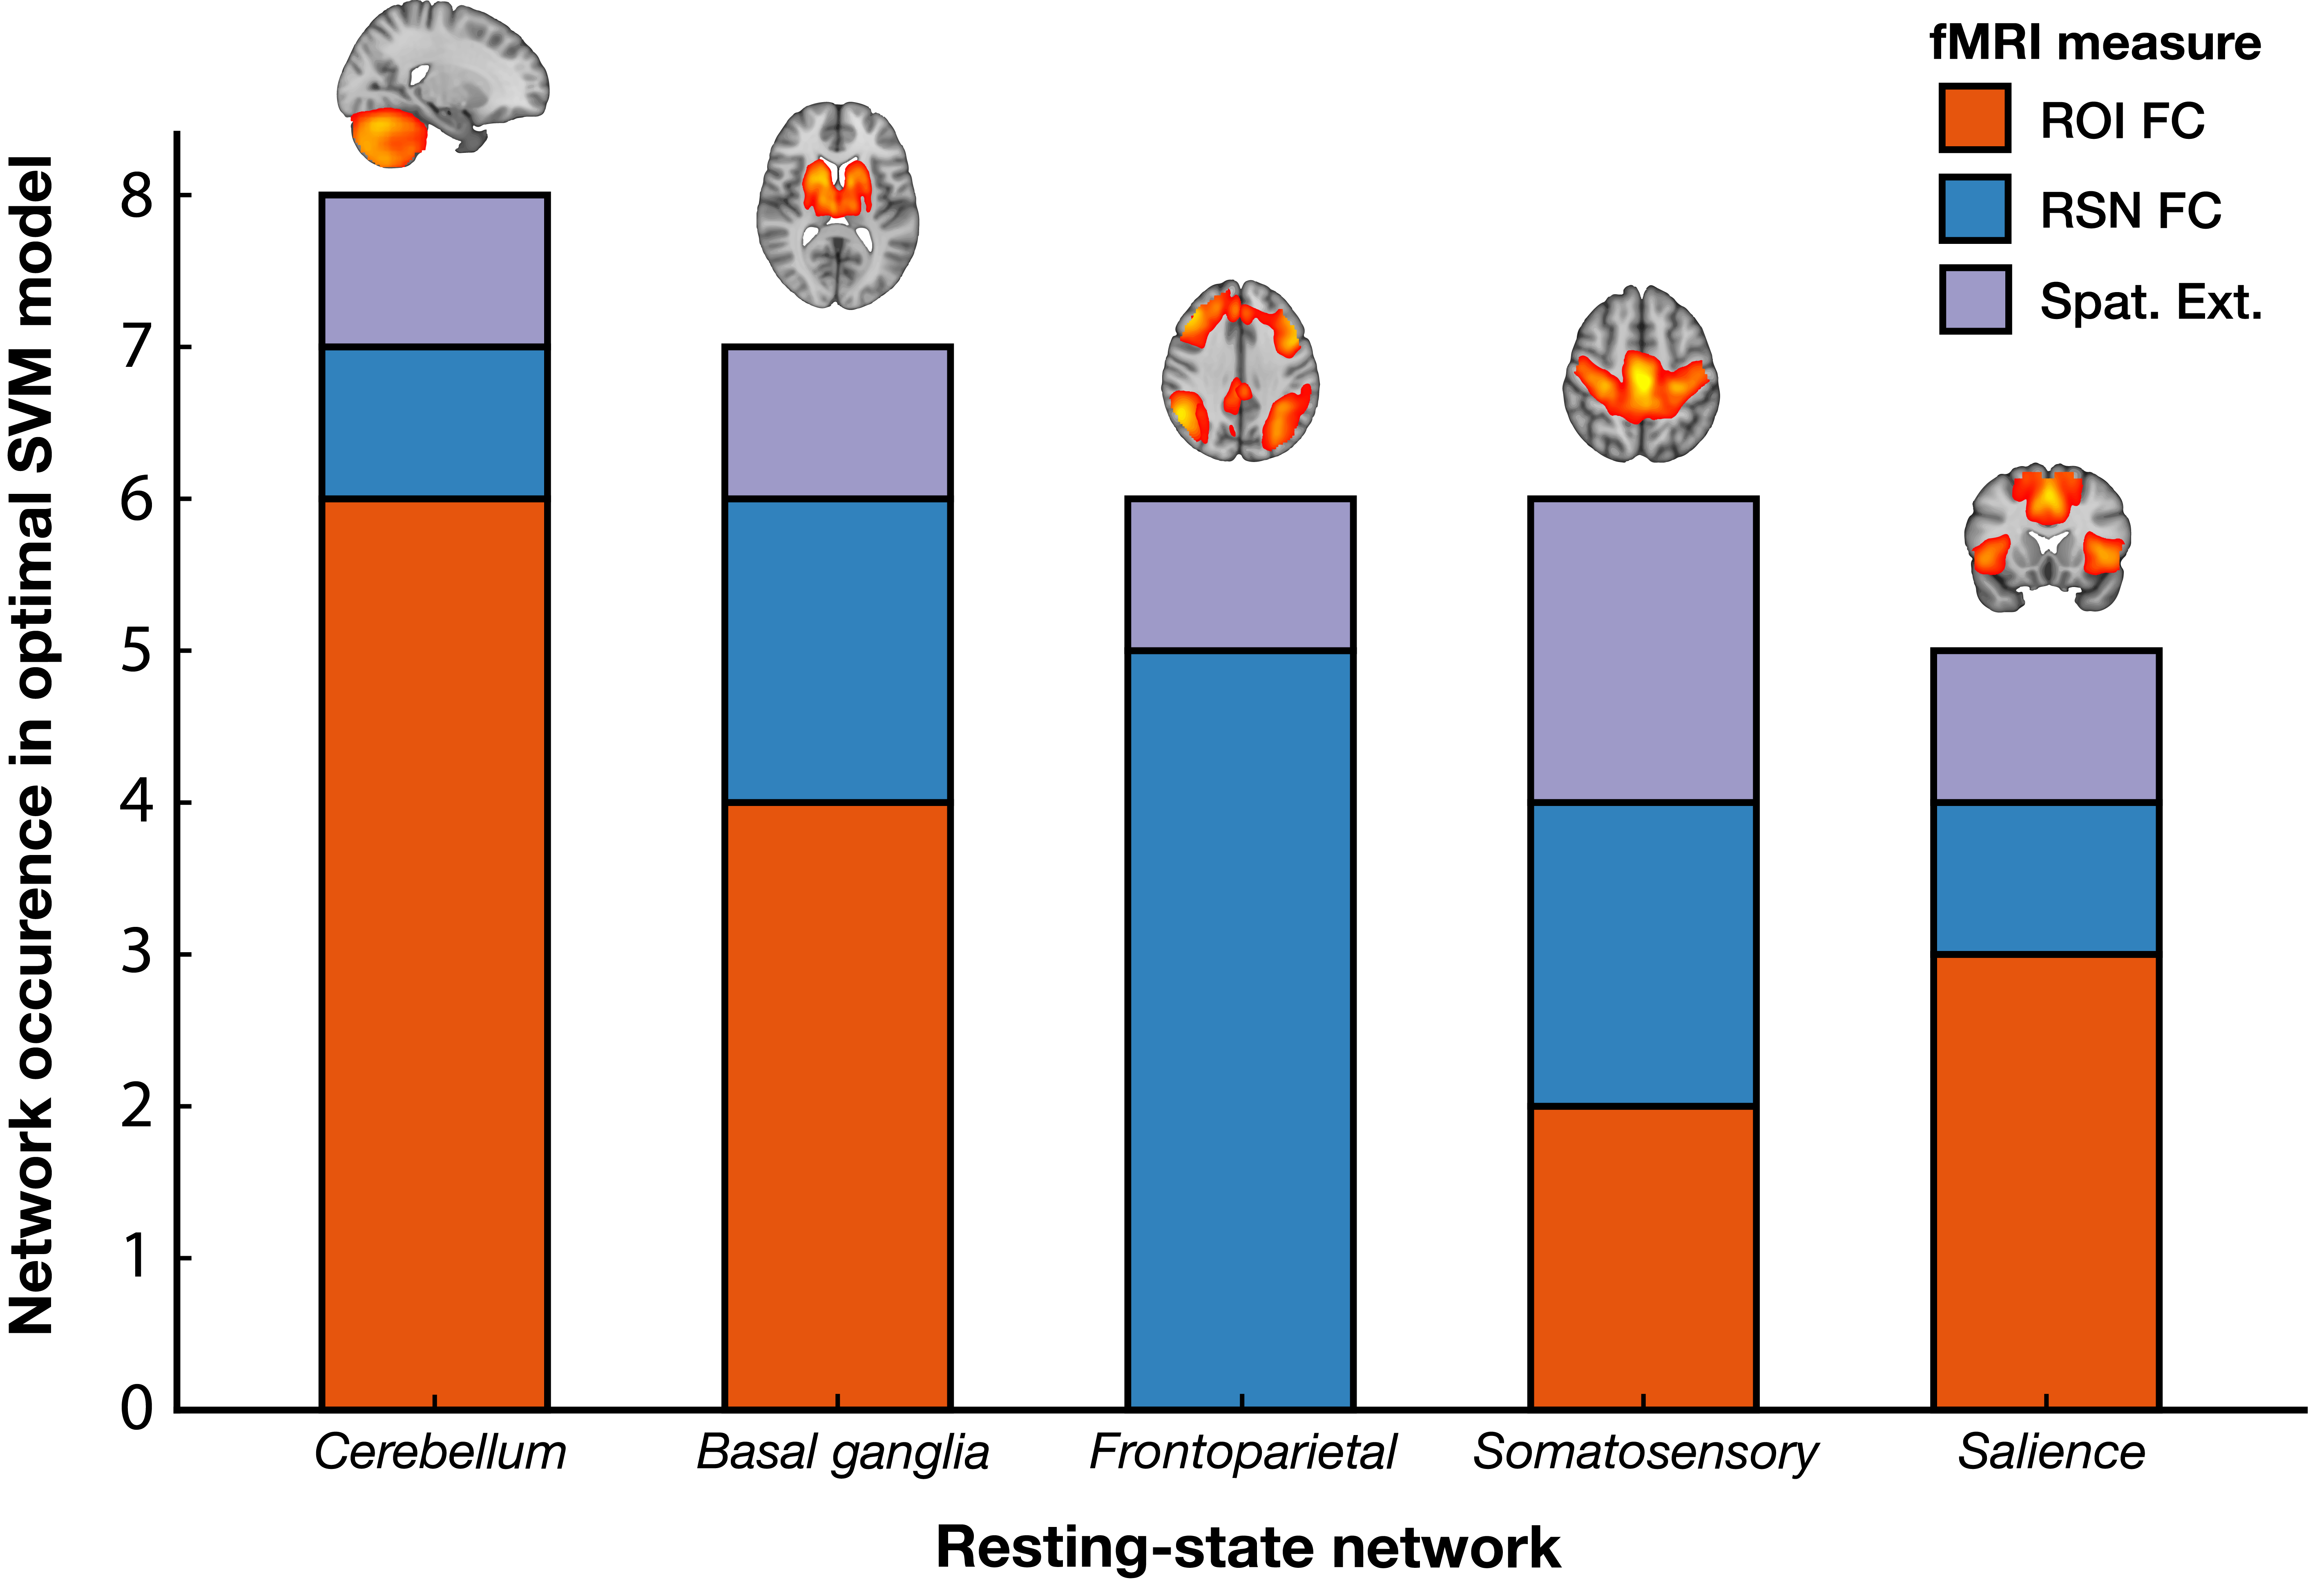
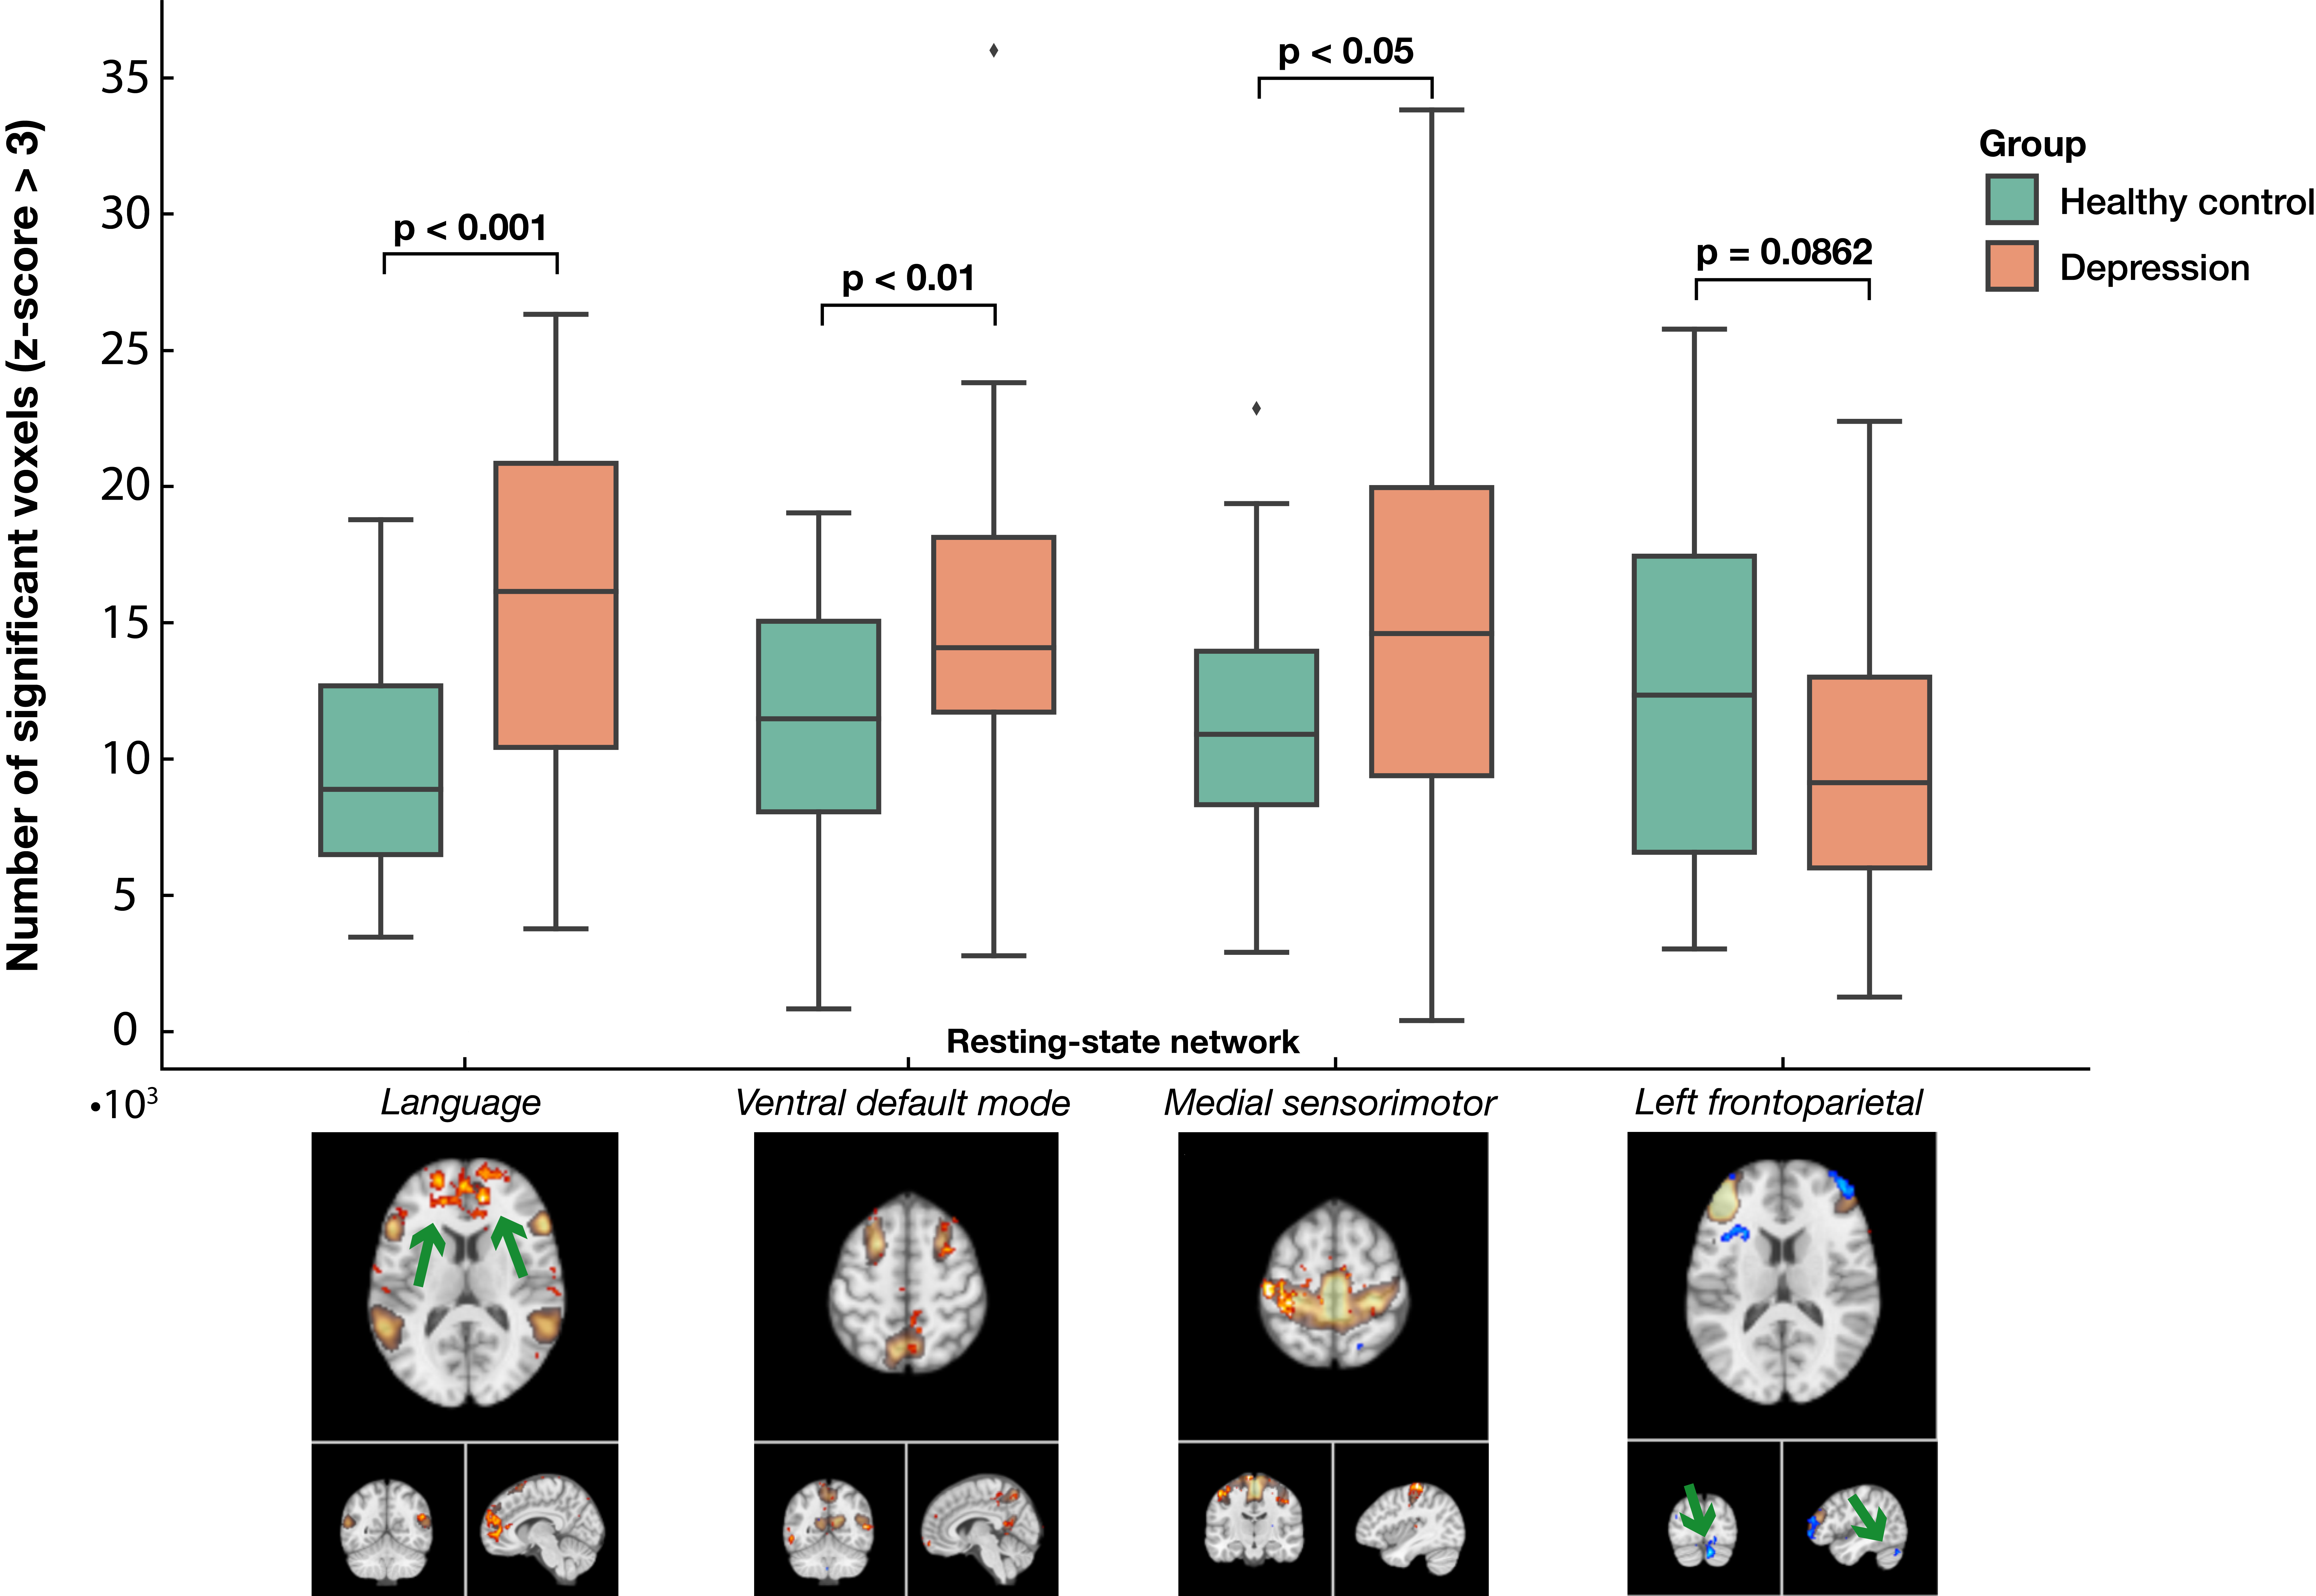
The highest performing measure in dataset 1 and 2 was the ROI FC (100% and 87% accuracy, respectively), followed by RSN FC (79% and 75%, respectively) and spatial extent (81% and 71%, respectively), see Figure 3. The number of times an RSN was part of a feature over all models combined was counted. The most important RSNs were: the cerebellum, basal ganglia, frontoparietal, somatosensory and salience network, in descending order (see Figure 4). Moreover, the ROI FC contributed relatively more to the SVM models for the cerebellum network, while the spatial extent was more relevant for the somatosensory network. In the spatial extent maps of the MDD participants, significant additional activity of the anterior cingulate cortex was observed in the language network whereas a significant decrease of cerebellum involvement could be observed in the left frontoparietal network, see Figure 5.Discussion
MDD participants could be distinguished from HC participants on an individual level with >70% accuracy for three fMRI-based measures. The robustness of the methodology was confirmed by replication on an independent dataset. Whereas ROI FC achieved the most optimal classification performance, the spatial extent measure provided additional insights in the involvement of certain brain regions in several RSNs. For example, activity in the anterior cingulate cortex, which regulates cognitive and emotional processing13, was observed in the language network of the MDD group, potentially reflecting an affective association with verbal or auditory context. In addition, the decreased involvement of the cerebellum in the left frontoparietal network may be a result of decreased emotion regulation or control during cognitive processes5,14. Limitations include the relatively low sample size and the extraction of different RSNs in both datasets as a result of the ICA, making comparisons more difficult. Future studies could evaluate the extraction of spatial extent from specific subnetworks or combine all features in a single model using neural networks.Conclusion
This study contributed to the identification of robust and comprehensive biomarkers of depression by employing two FC measures and a feature that has not been used to classify MDD before. We obtained high performance of the classification of MDD from HC participants individually. The robustness of the methodology was confirmed on an independent test dataset. Finally, the explainability of the spatial extent measure provided additional insights into the abnormal involvement of brain regions to existing brain networks, reflecting potential aberrant emotional and cognitive processing in depression.Acknowledgements
No acknowledgement found.References
1. Otte C, Gold SM, Penninx BW, Pariante CM, Etkin A, Fava M, et al. Major depressive disorder. Nat Rev Dis Primers. 2016;2:16065.
2. Holtzheimer PE, Mayberg HS. Stuck in a rut: rethinking depression and its treatment. Trends in Neurosciences. 2011;34(1):1–9.
3. Malhi GS, Mann JJ. Depression. The Lancet. 2018 Nov;392(10161):2299–312.
4. Hacimusalar Y, Eşel E. Suggested Biomarkers for Major Depressive Disorder. Noro Psikiyatr Ars. 2018;55(3):280–90.
5. Mulders PC, van Eijndhoven PF, Schene AH, Beckmann CF, Tendolkar I. Resting-state functional connectivity in major depressive disorder: A review. Neuroscience & Biobehavioral Reviews. 2015;56:330–44.
6. Bondi E, Maggioni E, Brambilla P, Delvecchio G. A systematic review on the potential use of machine learning to classify major depressive disorder from healthy controls using resting state fMRI measures. Neuroscience & Biobehavioral Reviews. 2023;144:104972.
7. Yamashita A, Sakai Y, Yamada T, Yahata N, Kunimatsu A, Okada N, et al. Generalizable brain network markers of major depressive disorder across multiple imaging sites. PLOS Biology. 2020;18(12):e3000966.
8. Cash RFH, Cocchi L, Anderson R, Rogachov A, Kucyi A, Barnett AJ, et al. A multivariate neuroimaging biomarker of individual outcome to transcranial magnetic stimulation in depression. Hum Brain Mapp. 2019;40(16):4618–29.
9. Bezmaternykh DD, Melnikov MYe, Savelov AA, Kozlova LI, Petrovskiy ED, Natarova KA, et al. Brain Networks Connectivity in Mild to Moderate Depression: Resting State fMRI Study with Implications to Nonpharmacological Treatment. Neural Plast. 2021;2021:8846097.
10. Tanaka SC, Yamashita A, Yahata N, Itahashi T, Lisi G, Yamada T, et al. A multi-site, multi-disorder resting-state magnetic resonance image database. Sci Data. 2021;8(1):227.
11. Whitfield-Gabrieli S, Nieto-Castanon A. Conn: A Functional Connectivity Toolbox for Correlated and Anticorrelated Brain Networks. Brain Connectivity. 2012;2(3):125–41.
12. Behzadi Y, Restom K, Liau J, Liu TT. A Component Based Noise Correction Method (CompCor) for BOLD and Perfusion Based fMRI. Neuroimage. 2007;37(1):90–101.
13. Bush G, Luu P, Posner MI. Cognitive and emotional influences in anterior cingulate cortex. Trends in Cognitive Sciences. 2000;4(6):215–22.
14. Depping MS, Schmitgen MM, Kubera KM, Wolf RC. Cerebellar Contributions to Major Depression. Front Psychiatry. 2018;9:634.
Figures