0434
Brain functional connectome phenotype relates to psychopathology in middle-aged and older adults1Centre for Sleep and Cognition & Centre for Translational Magnetic Resonance Research, National University of Singapore, Singapore, Singapore, 2Integrative Sciences and Engineering Programme, National University of Singapore, Singapore, Singapore, 3Department of Electrical and Computer Engineering, National University of Singapore, Singapore, Singapore
Synopsis
Keywords: Psychiatric Disorders, Psychiatric Disorders
Motivation: To better understand brain network vulnerability in mental health disorders in the understudied middle-aged and older adults and see if it fits the hierarchical model of psychopathology.
Goal(s): We sought to unveil the structure of psychopathology through investigating the brain phenotypes underlying various mental outcomes using the UK Biobank cohort.
Approach: We investigated how brain functional connectivity relates to 36 mental outcome items using a multivariate partial least squares correlation approach.
Results: Across middle-aged and older adults, we identified a general disease factor and another reflecting the divergence between alcohol addiction and depression/PTSD related symptoms, consistent with the hierarchical model of psychopathology.
Impact: These findings highlighted the importance of characterizing mental disorders in terms of transdiagnostic dimensions instead of separate disorders. It also shed light on how imaging biomarkers can be used to characterize population suffering from poor mental health.
Introduction
High comorbidity is common in psychiatric disorders1, in line with a recent psychopathological model proposing higher dimensionality of psychopathology across the disorders2. Studies in youth have unveiled a hierarchical organization in brain connectivity, revealing both shared and unique neural patterns underlying distinct disorders3, 4. However, research on disease dimensions and neuroimaging markers in adults, especially middle-aged individuals, is limited. This study endeavors to address this gap by investigating brain functional phenotypes in middle-aged and older adults from the UK Biobank cohort. We expect to identify a common factor spanning various disorders and distinctive factors characterizing individual conditions.Methods
The UK Biobank cohort (n=6529, 62.9±7.5 years, 2914 males) was evenly split into testing and validation sets, ensuring demographic and behavioral matching. We employed an online questionnaire to evaluate 36 items encompassing alcohol addiction, depression, anxiety, PTSD, and psychosis5. Standard preprocessing6 with additional steps from prior study7 was applied to fMRI data. Functional connectivity (FC) matrices were calculated using Pearson's correlation for 420 cortical and subcortical regions of interest (ROI)8.To identify the relationship between brain functional phenotypes and mental health, we analysed their association using partial least squares (PLS) correlation9, adjusting for common confounding factors10. The significance of each latent variable (LV) was determined via a permutation test (5000 iterations).
For gauging the stability of each measure within the brain network, we computed bootstrap ratios (1000 iterations) and averaged them across datasets, treating inconsistent ratios as zero. Subsequently, we derived the absolute values of these ratios across all connections for each ROI to estimate their importance to the LV. A permutation test (1000 iterations) was employed to evaluate the significance of this importance measure.
We reran the PLS using the entire dataset to derive brain scores of each participant. We then proceeded to test the effects of these brain scores on cortical thickness using a general linear model, correcting for the confounders tested previously. Cluster-wise correction for multiple comparisons was carried out using precomputed Z Monte Carlo simulation, with a cluster-forming threshold of p<0.001. Clusters were kept if they have a corrected cluster-wise p<0.05.
Results
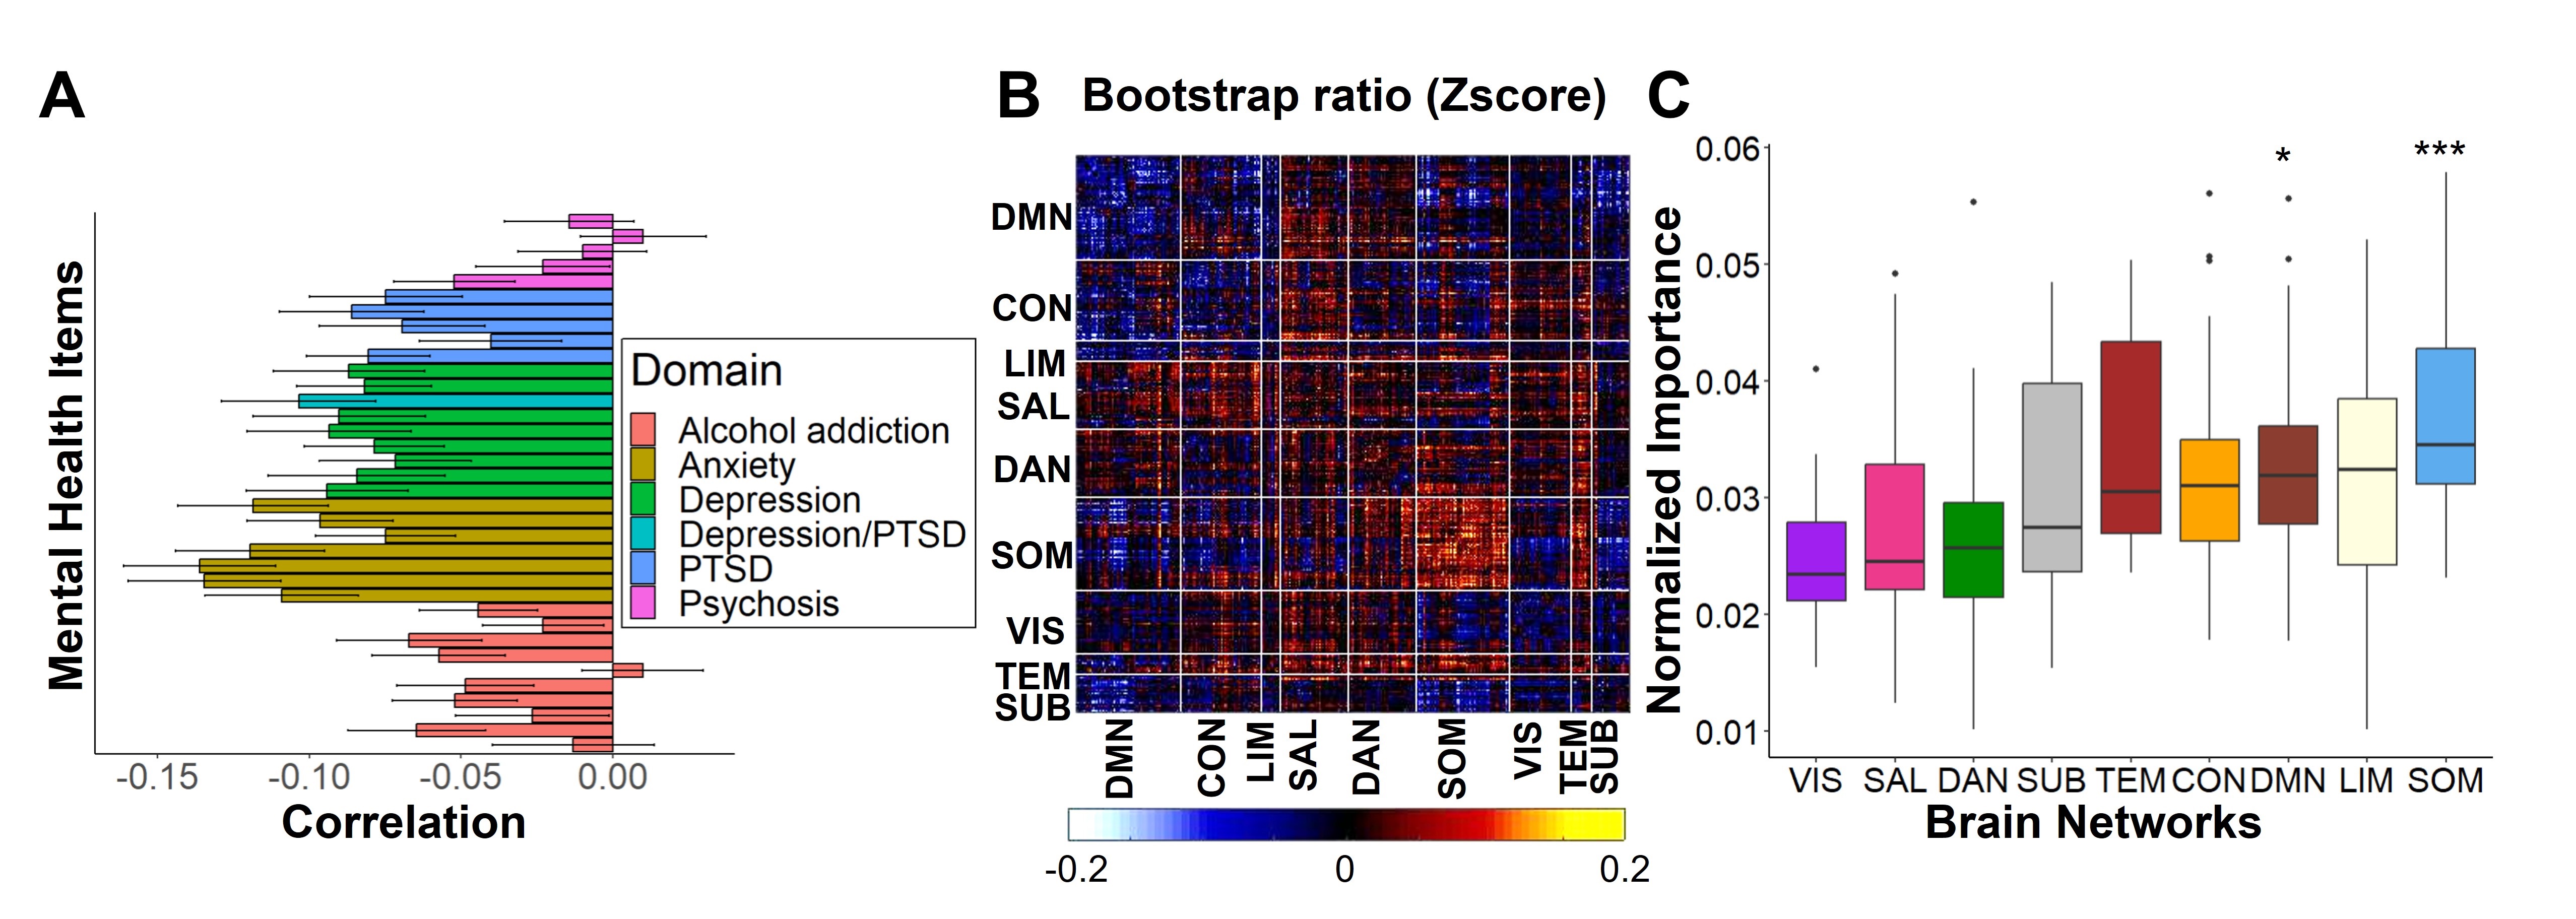
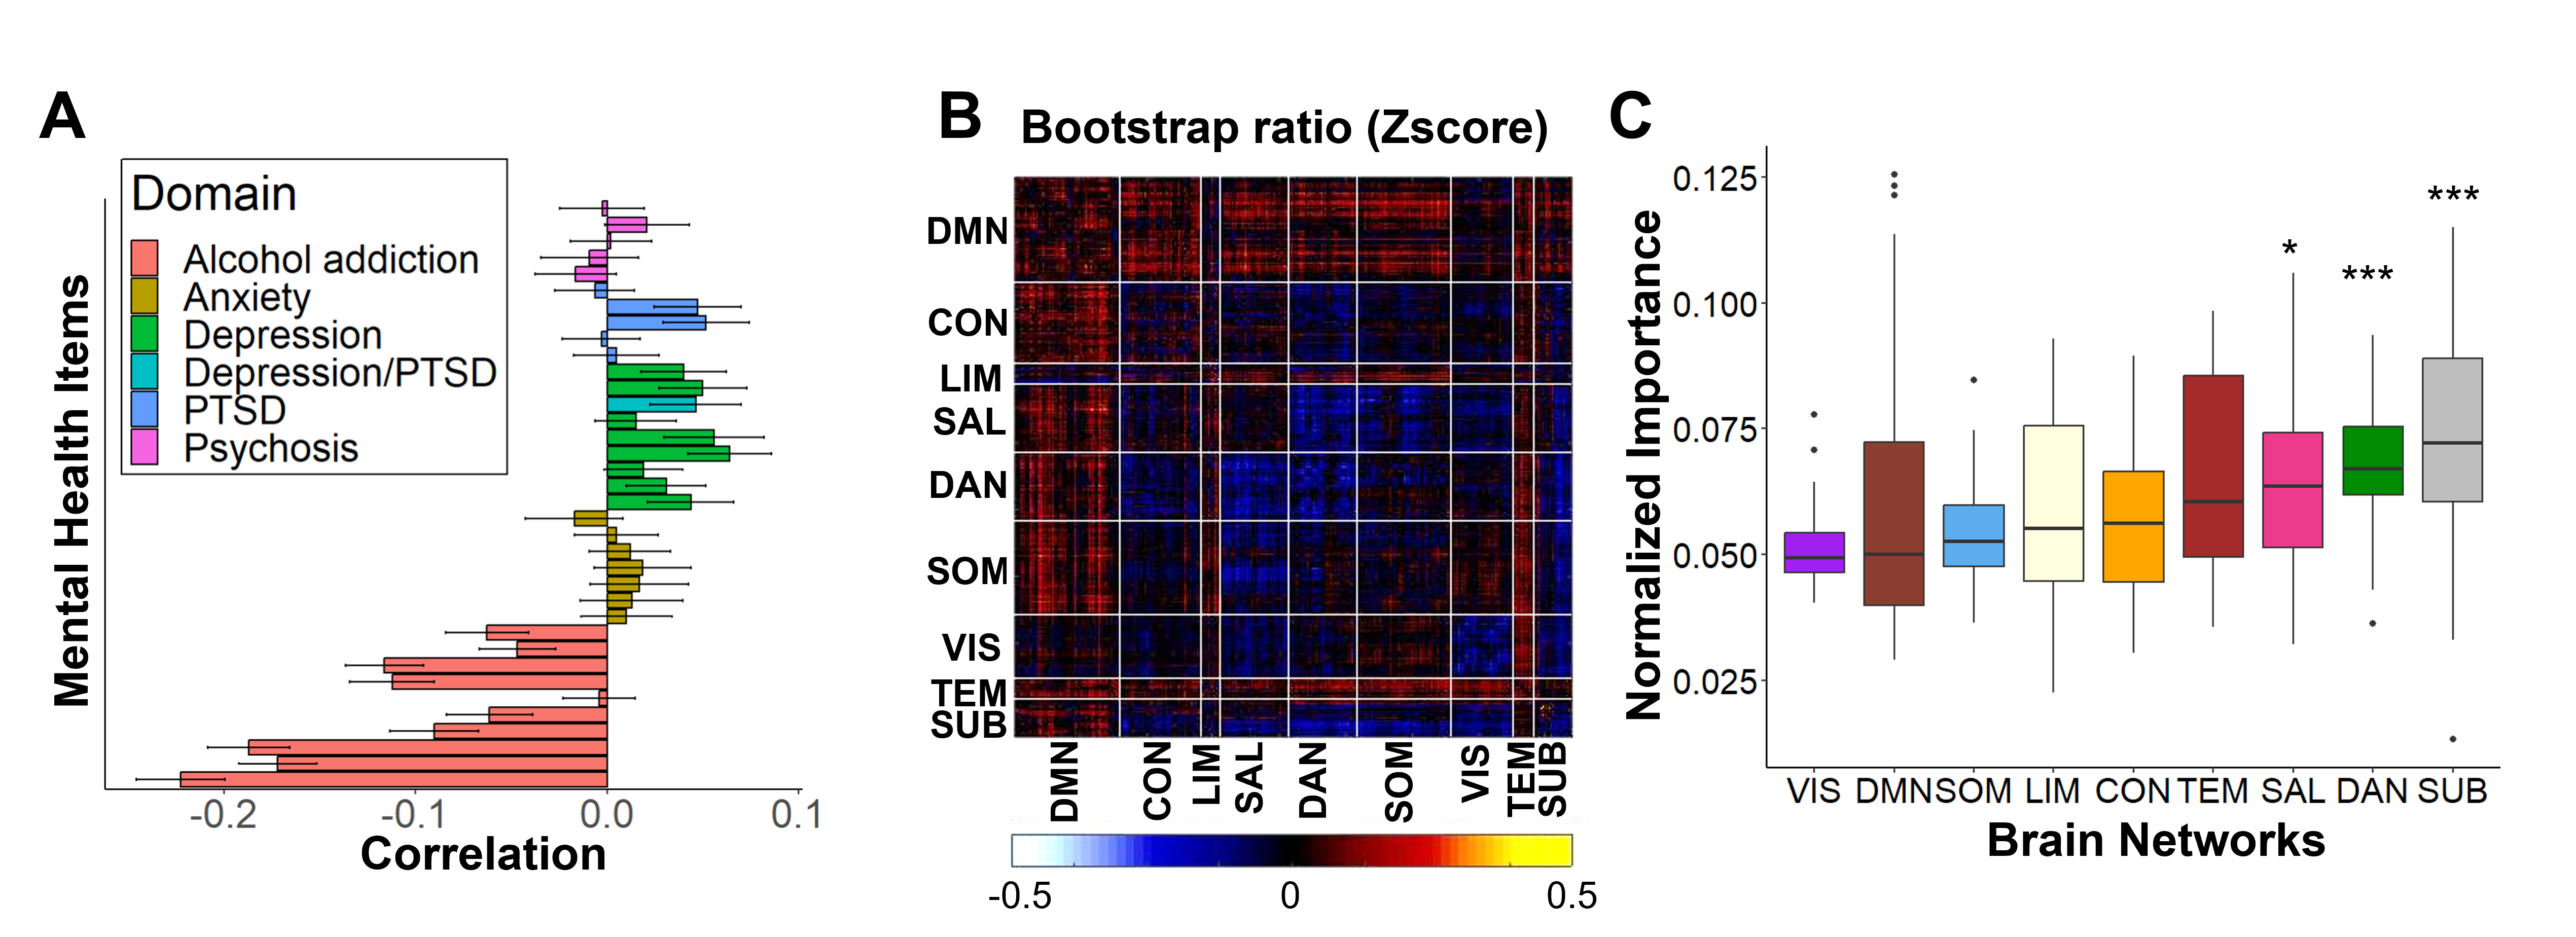
Looking at the PLS results, the first LV, explaining 25.4% of the overall covariance (p=0.010), represented a general psychopathological factor (Fig. 1A). A similar factor was also observed in the validation dataset (27.7%, p=0.003). Individuals with lower psychiatric burden exhibited higher functional connectivity in the somatomotor network, lower functional connectivity in the default mode network, as well as lower connectivity between the default and executive control networks (Fig. 1B, C).The second LV, explaining 13.3% of the overall covariance (p=0.0004), emphasized a distinction between alcohol addiction and symptoms related to depression and PTSD (Fig. 2A). A similar pattern was evident in the validation dataset (13.6%, p<0.0001). Less alcohol addiction severity but more problems related to depression and PTSD were associated with lower functional connectivity in subcortical regions and between the dorsal and ventral attention networks (Fig. 2B, C).
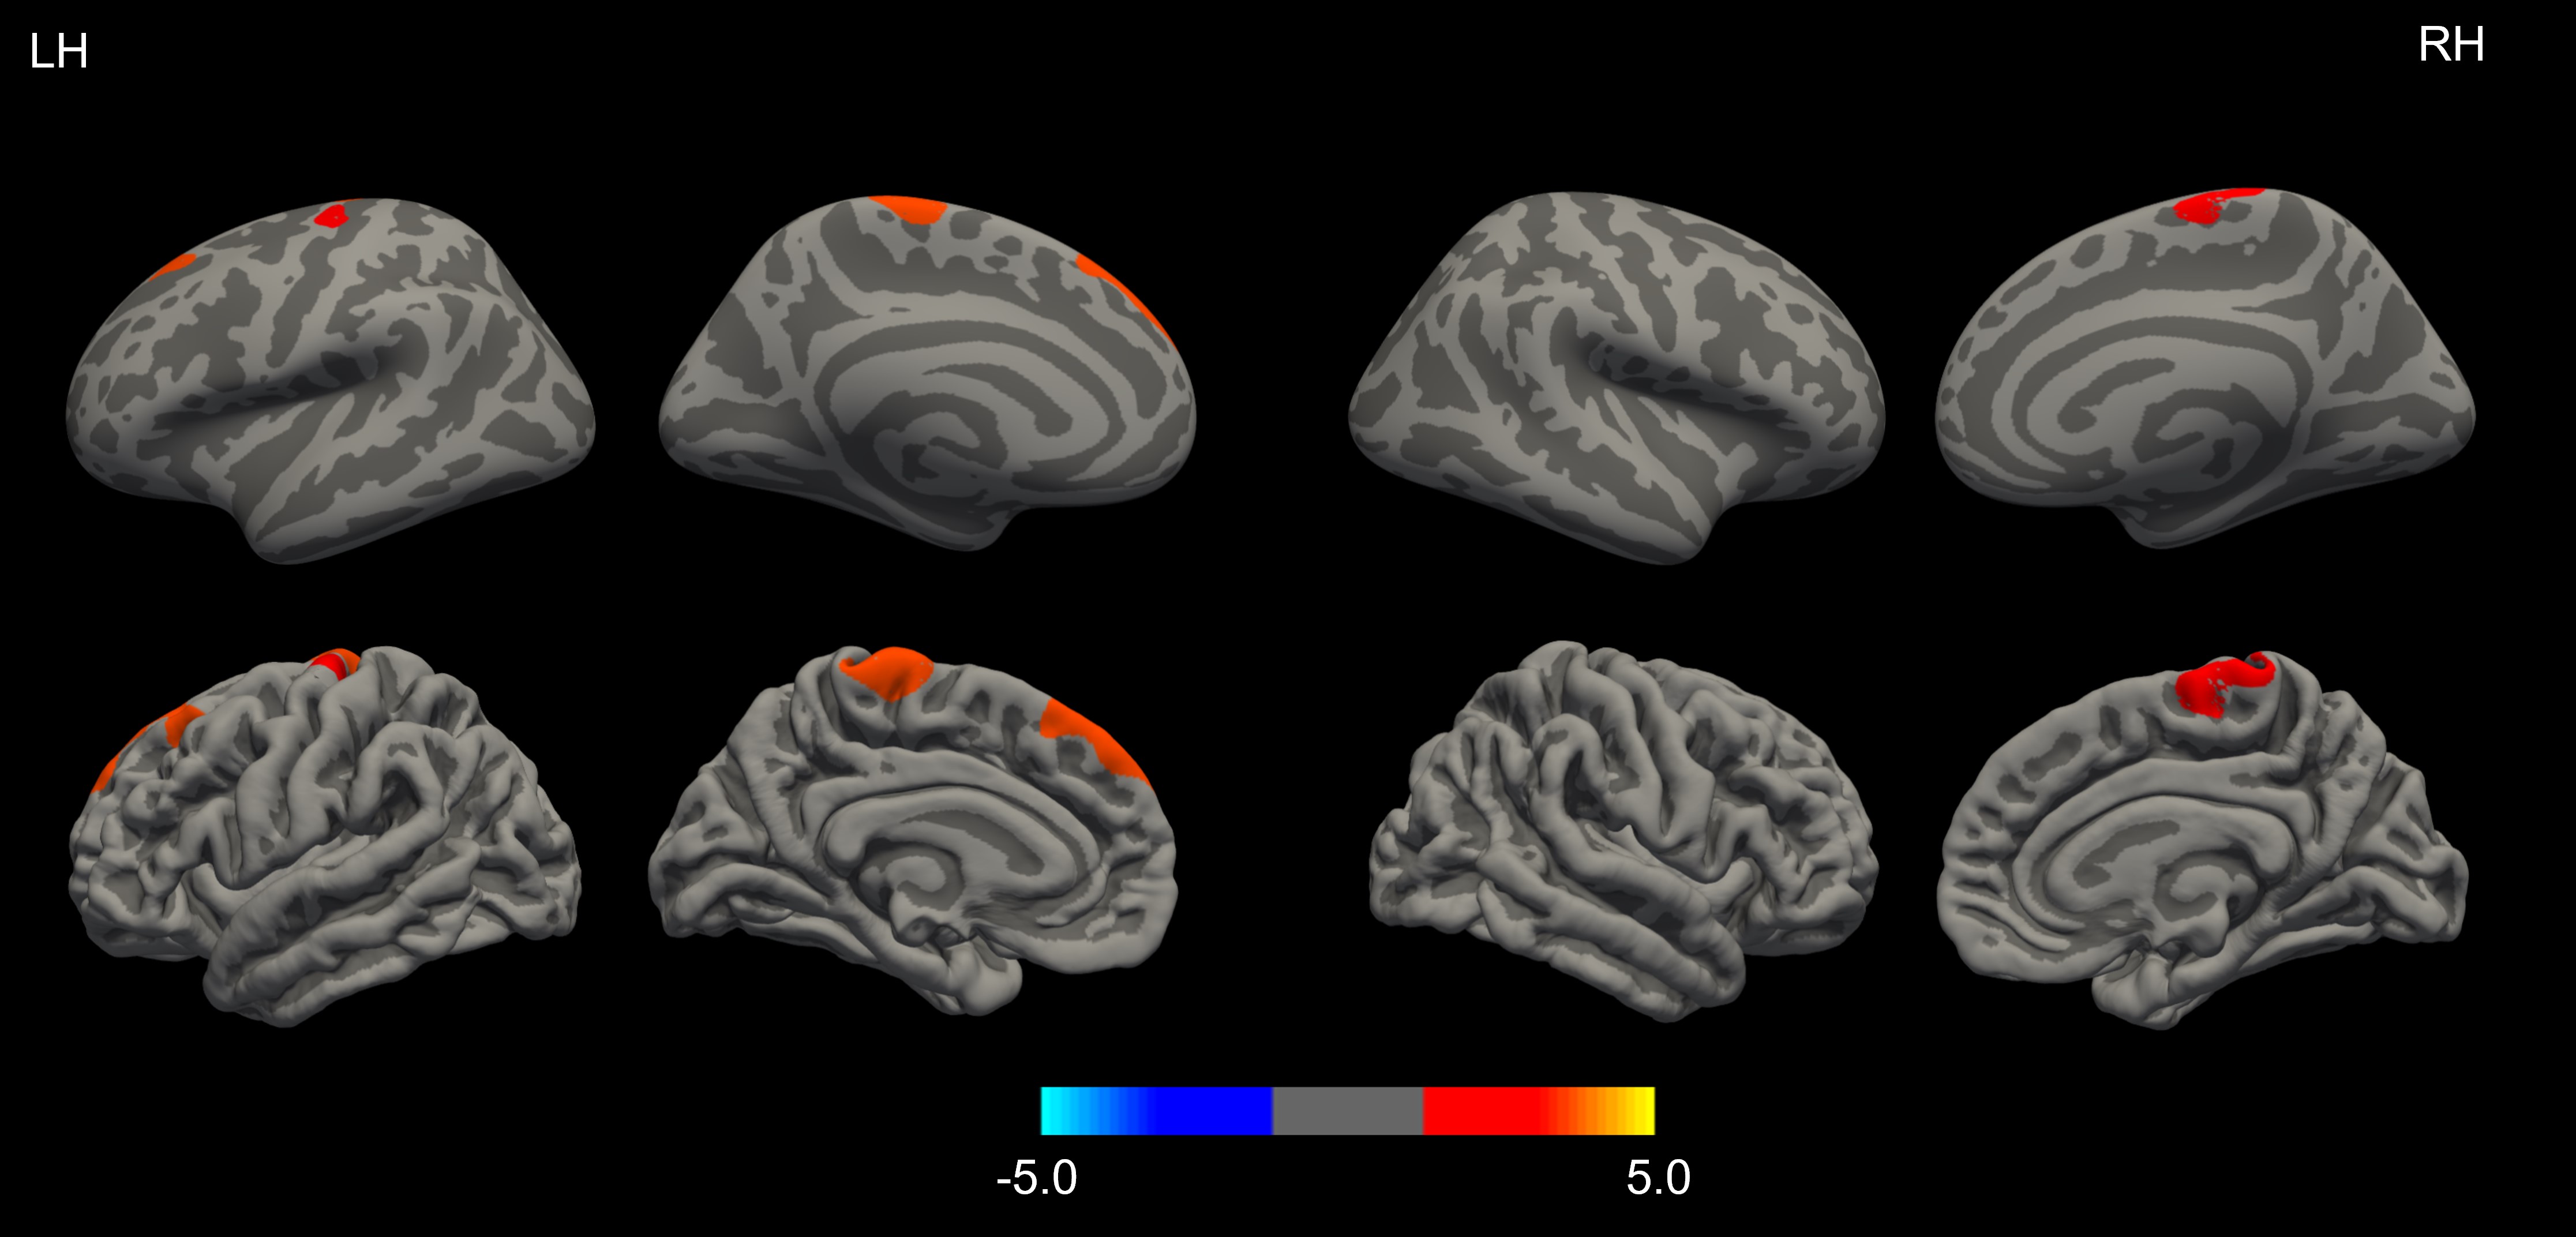
Variations in cortical thickness were not associated with the brain functional scores derived from the first LV representing general psychopathology. In the context of the second LV, we noted that reduced cortical thickness in the dorsolateral prefrontal cortex region in default mode network and primary motor cortex in the somatomotor network corresponded to lower brain functional scores, which reflected a higher level of alcohol addiction severity (Fig. 3).
Discussions & Conclusions
Among middle-aged and older adults, we discerned two significant factors: one signifying general psychopathology and the other accentuating the contrast between alcohol addiction and depression/PTSD symptoms. These results substantiate the hierarchical psychopathological model and are delineated by unique connectivity and morphometric patterns. Both somatomotor and default mode networks have been previously shown to be implicated in transdiagnostic dimensions in younger patients11-13, which suggested a pivotal and enduring role of these networks. The salience and subcortical networks have consistently shown involvement in addiction, depression, and PTSD14-17, largely attributed to dysregulated affective and reward systems. The dorsal attention network has also been similarly affected18-21, albeit through a distinct pathway involving attentional deficits. Interestingly, default mode and somatomotor networks were implicated in cortical thickness variations underlying distinct disorders instead of the general psychiatric burden. We postulated that this finding indicates a possible temporal precedence in the structural versus functional phenotypes associated with mental health. All in all, this underscores the significance of comprehending brain network phenotypes related to mental disorders within the framework of transdiagnostic dimensions.Acknowledgements
This research has been conducted using the UK Biobank Resource under Application Number 25163.References
1. Kessler RC. The prevalence of psychiatric comorbidity. Treatment strategies for patients with psychiatric comorbidity. Hoboken, NJ, US: John Wiley & Sons Inc 1997:23-48.
2. Forbes MK, Sunderland M, Rapee RM, et al. A detailed hierarchical model of psychopathology: From individual symptoms up to the general factor of psychopathology. Clin Psychol Sci. 2021;9(2):139-168.
3. Xia CH, Ma Z, Ciric R, et al. Linked dimensions of psychopathology and connectivity in functional brain networks. Nature Communications. 2018;9(1):3003.
4. Lees B, Squeglia LM, McTeague LM, et al. Altered Neurocognitive Functional Connectivity and Activation Patterns Underlie Psychopathology in Preadolescence. Biological Psychiatry: Cognitive Neuroscience and Neuroimaging. 2020.
5. Davis KAS, Coleman JRI, Adams M, et al. Mental health in UK Biobank - development, implementation and results from an online questionnaire completed by 157 366 participants: a reanalysis. BJPsych Open. 2020;6(2):e18-e18.
6. Alfaro-Almagro F, Jenkinson M, Bangerter NK, et al. Image processing and Quality Control for the first 10,000 brain imaging datasets from UK Biobank. Neuroimage. 2018;166:400-424.
7. Chong JSX, Liu S, Loke YM, et al. Influence of cerebrovascular disease on brain networks in prodromal and clinical Alzheimer’s disease. Brain. 2017;140(11):3012-3022.
8. Schaefer A, Kong R, Gordon EM, et al. Local-Global Parcellation of the Human Cerebral Cortex from Intrinsic Functional Connectivity MRI. Cerebral cortex (New York, NY : 1991). 2018;28(9):3095-3114.
9. McIntosh AR, Chau WK, Protzner AB. Spatiotemporal analysis of event-related fMRI data using partial least squares. NeuroImage. 2004;23(2):764-775.
10. Alfaro-Almagro F, McCarthy P, Afyouni S, et al. Confound modelling in UK Biobank brain imaging. NeuroImage. 2021;224:117002.
11. Kebets V, Holmes AJ, Orban C, et al. Somatosensory-Motor Dysconnectivity Spans Multiple Transdiagnostic Dimensions of Psychopathology. Biological Psychiatry. 2019;86(10):779-791.
12. Sha Z, Wager TD, Mechelli A, et al. Common Dysfunction of Large-Scale Neurocognitive Networks Across Psychiatric Disorders. Biol Psychiatry. 2019;85(5):379-388.
13. Doucet GE, Janiri D, Howard R, et al. Transdiagnostic and disease-specific abnormalities in the default-mode network hubs in psychiatric disorders: A meta-analysis of resting-state functional imaging studies. Eur Psychiatry. 2020;63(1):e57.
14. Zhu X, Cortes CR, Mathur K, et al. Model-free functional connectivity and impulsivity correlates of alcohol dependence: a resting-state study. Addiction Biology. 2017;22(1):206-217.
15. Tolomeo S, Yu R. Brain network dysfunctions in addiction: a meta-analysis of resting-state functional connectivity. Translational Psychiatry. 2022;12(1):41.
16. Zeng L-L, Shen H, Liu L, et al. Identifying major depression using whole-brain functional connectivity: a multivariate pattern analysis. Brain. 2012;135(5):1498-1507.
17. Brown VM, LaBar KS, Haswell CC, et al. Altered Resting-State Functional Connectivity of Basolateral and Centromedial Amygdala Complexes in Posttraumatic Stress Disorder. Neuropsychopharmacology. 2014;39(2):351-359.
18. Zehra A, Lindgren E, Wiers CE, et al. Neural correlates of visual attention in alcohol use disorder. Drug and Alcohol Dependence. 2019;194:430-437.
19. Song Z, Chen J, Wen Z, et al. Abnormal functional connectivity and effective connectivity between the default mode network and attention networks in patients with alcohol-use disorder. Acta Radiologica. 2020;62(2):251-259.
20. Chen H, Liu K, Zhang B, et al. More optimal but less regulated dorsal and ventral visual networks in patients with major depressive disorder. Journal of Psychiatric Research. 2019;110:172-178.
21. Russman Block SR, Weissman DH, Sripada C, et al. Neural Mechanisms of Spatial Attention Deficits in Trauma. Biological Psychiatry: Cognitive Neuroscience and Neuroimaging. 2020;5(10):991-1001.
Figures