0433
Magnetic Resonance Cholangiopancreatography at 5 T: Quantitative and Qualitative Comparison with 3 T1Shandong Provincial Third Hospital, Jinan, China, 2United Imaging Research Institute of Intelligent Imaging, Beijing, China
Synopsis
Keywords: Preclinical Image Analysis, Quantitative Imaging, Biliary
Motivation: To evaluate the 5 T MRI’s effectiveness for MRCP imaging.
Goal(s): To demonstrate 5 T imaging's comparability in visualization, SNR, and image quality to 3 T.
Approach: MRCP was performed on subjects using both 3 T and 5 T MRI, assessing the bile duct tree visualization and SNR, with radiologists evaluating image quality and artifacts.
Results: 5 T revealed superior bile duct tree visualization, with comparable SNR, image quality, and artifact management to 3 T.
Impact: The study highlights 5 T MRI's potential in MRCP, suggesting improved biliary visualization which could lead to better clinical outcomes and guide further technological advancements in non-invasive diagnostics.
INTRODUCTION
Magnetic Resonance Cholangiopancreatography (MRCP), a non-invasive diagnostic technique for visualizing bile and pancreatic ducts, has seen significant advancements in Magnetic Resonance Imaging (MRI) technology over the last 30 years1-3, becoming the preferred tool for diagnosing biliary diseases4-6. Theoretically, higher magnetic field strengths yielding better Signal-to-Noise Ratio (SNR), resolution, and tissue contrast , the shift towards >3 T MRI fields has been a key research area in recent years7-9. Despite the diagnostic promise shown by 7 T MRI10,11, its widespread adoption for abdominal imaging is hampered by non-uniform B1 field distribution12. A newly developed 5 T MRI system may circumvent these issues13, potentially offering superior MRCP imaging by balancing high SNR with reduced artifacts. This study explores the feasibility of 5 T for abdominal MRCP, comparing it quantitatively and qualitatively to 3 T across SNR, detail visualization, image quality, and artifacts.METHODS
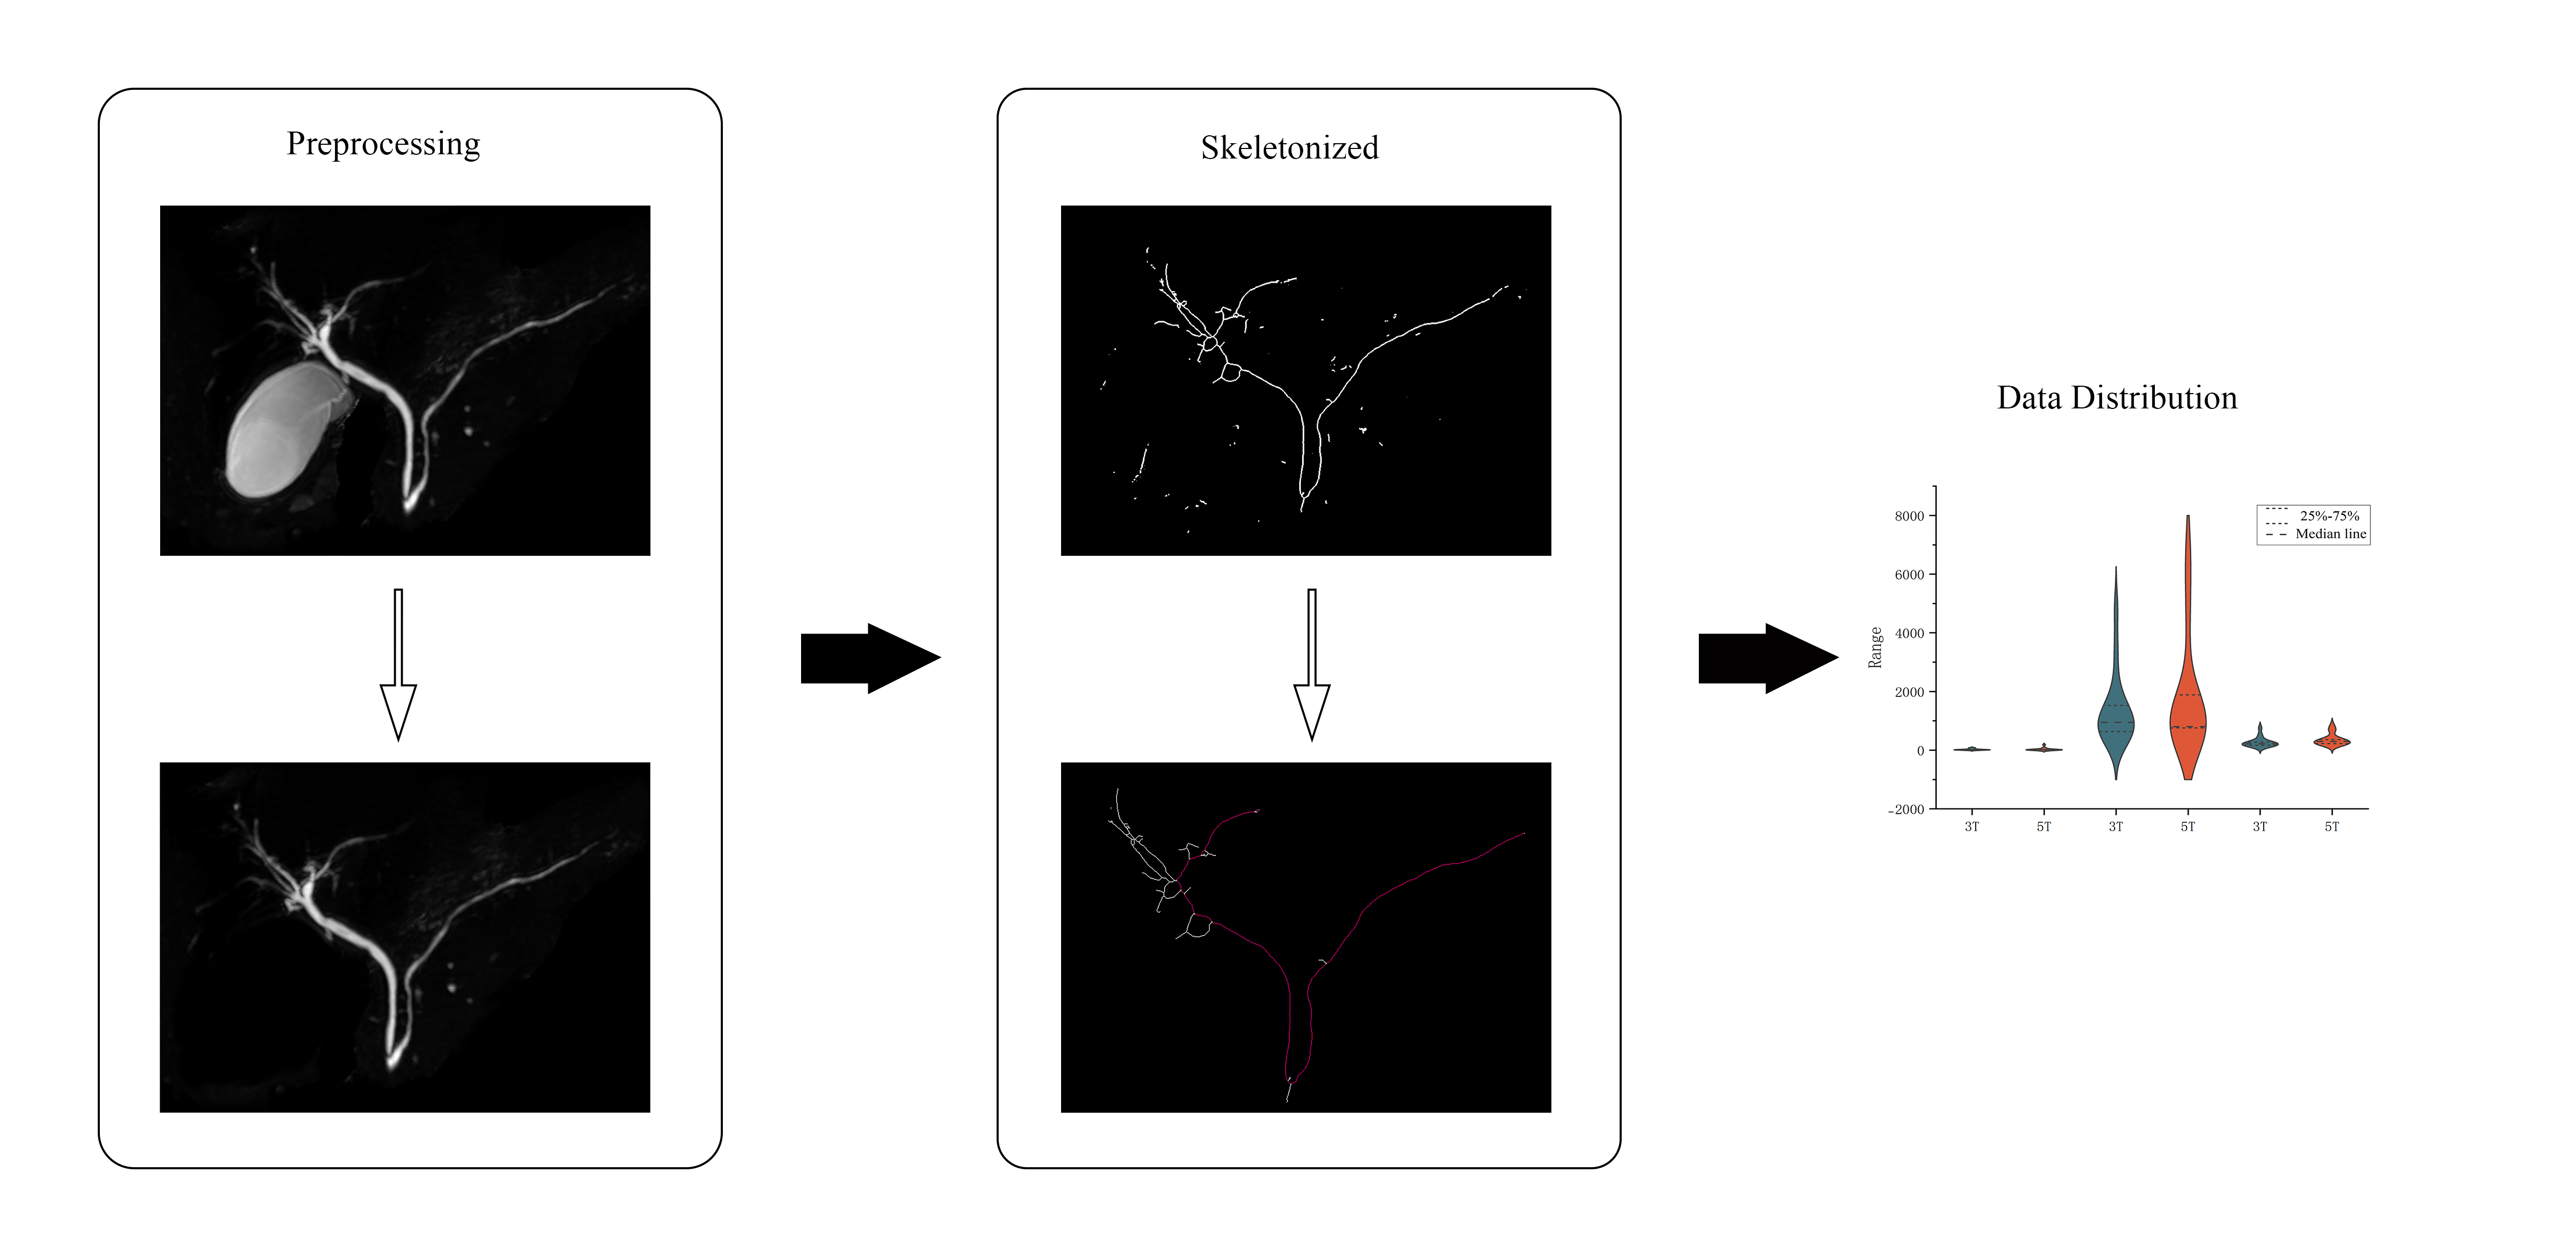
This prospective study was approved by the Ethics Committee of Shandong Provincial Third Hospital. After providing informed consent, 18 participants were consecutively recruited for MRCP examinations at both 3 T and 5 T field strengths. All subjects fasted for at least 6 hours prior to the examination. MRCP scans were performed within 24 hours using 3 T and 5 T MRI systems (uMR Jupiter, United Imaging Healthcare). Data processing utilized ImageJ15, with semi-automated quantitative evaluation of the biliary tree to assess the visualization differences between field strengths, as outlined in Figure 1. Signal intensities (SI) were measured within uniform-sized regions of interest (ROIs) placed on the upper segment of the common bile duct (at the level of the cystic duct opening), the proximal left hepatic duct, and the proximal right hepatic duct. SNRs were calculated using SI and background noise standard deviation (SD), averaging across the three ROIs as16: SNR=SI/SDnoise. Two experienced radiologists independently assessed image quality and image artifacts on a 5-point scale. Wilcoxon signed-rank and rank-sum tests test was used to evaluate differences of bile duct visualization, SNR, and subjective image assessments between 3 T and 5 T. P<0.05 was considered to indicate a statistically significant.RESULTS
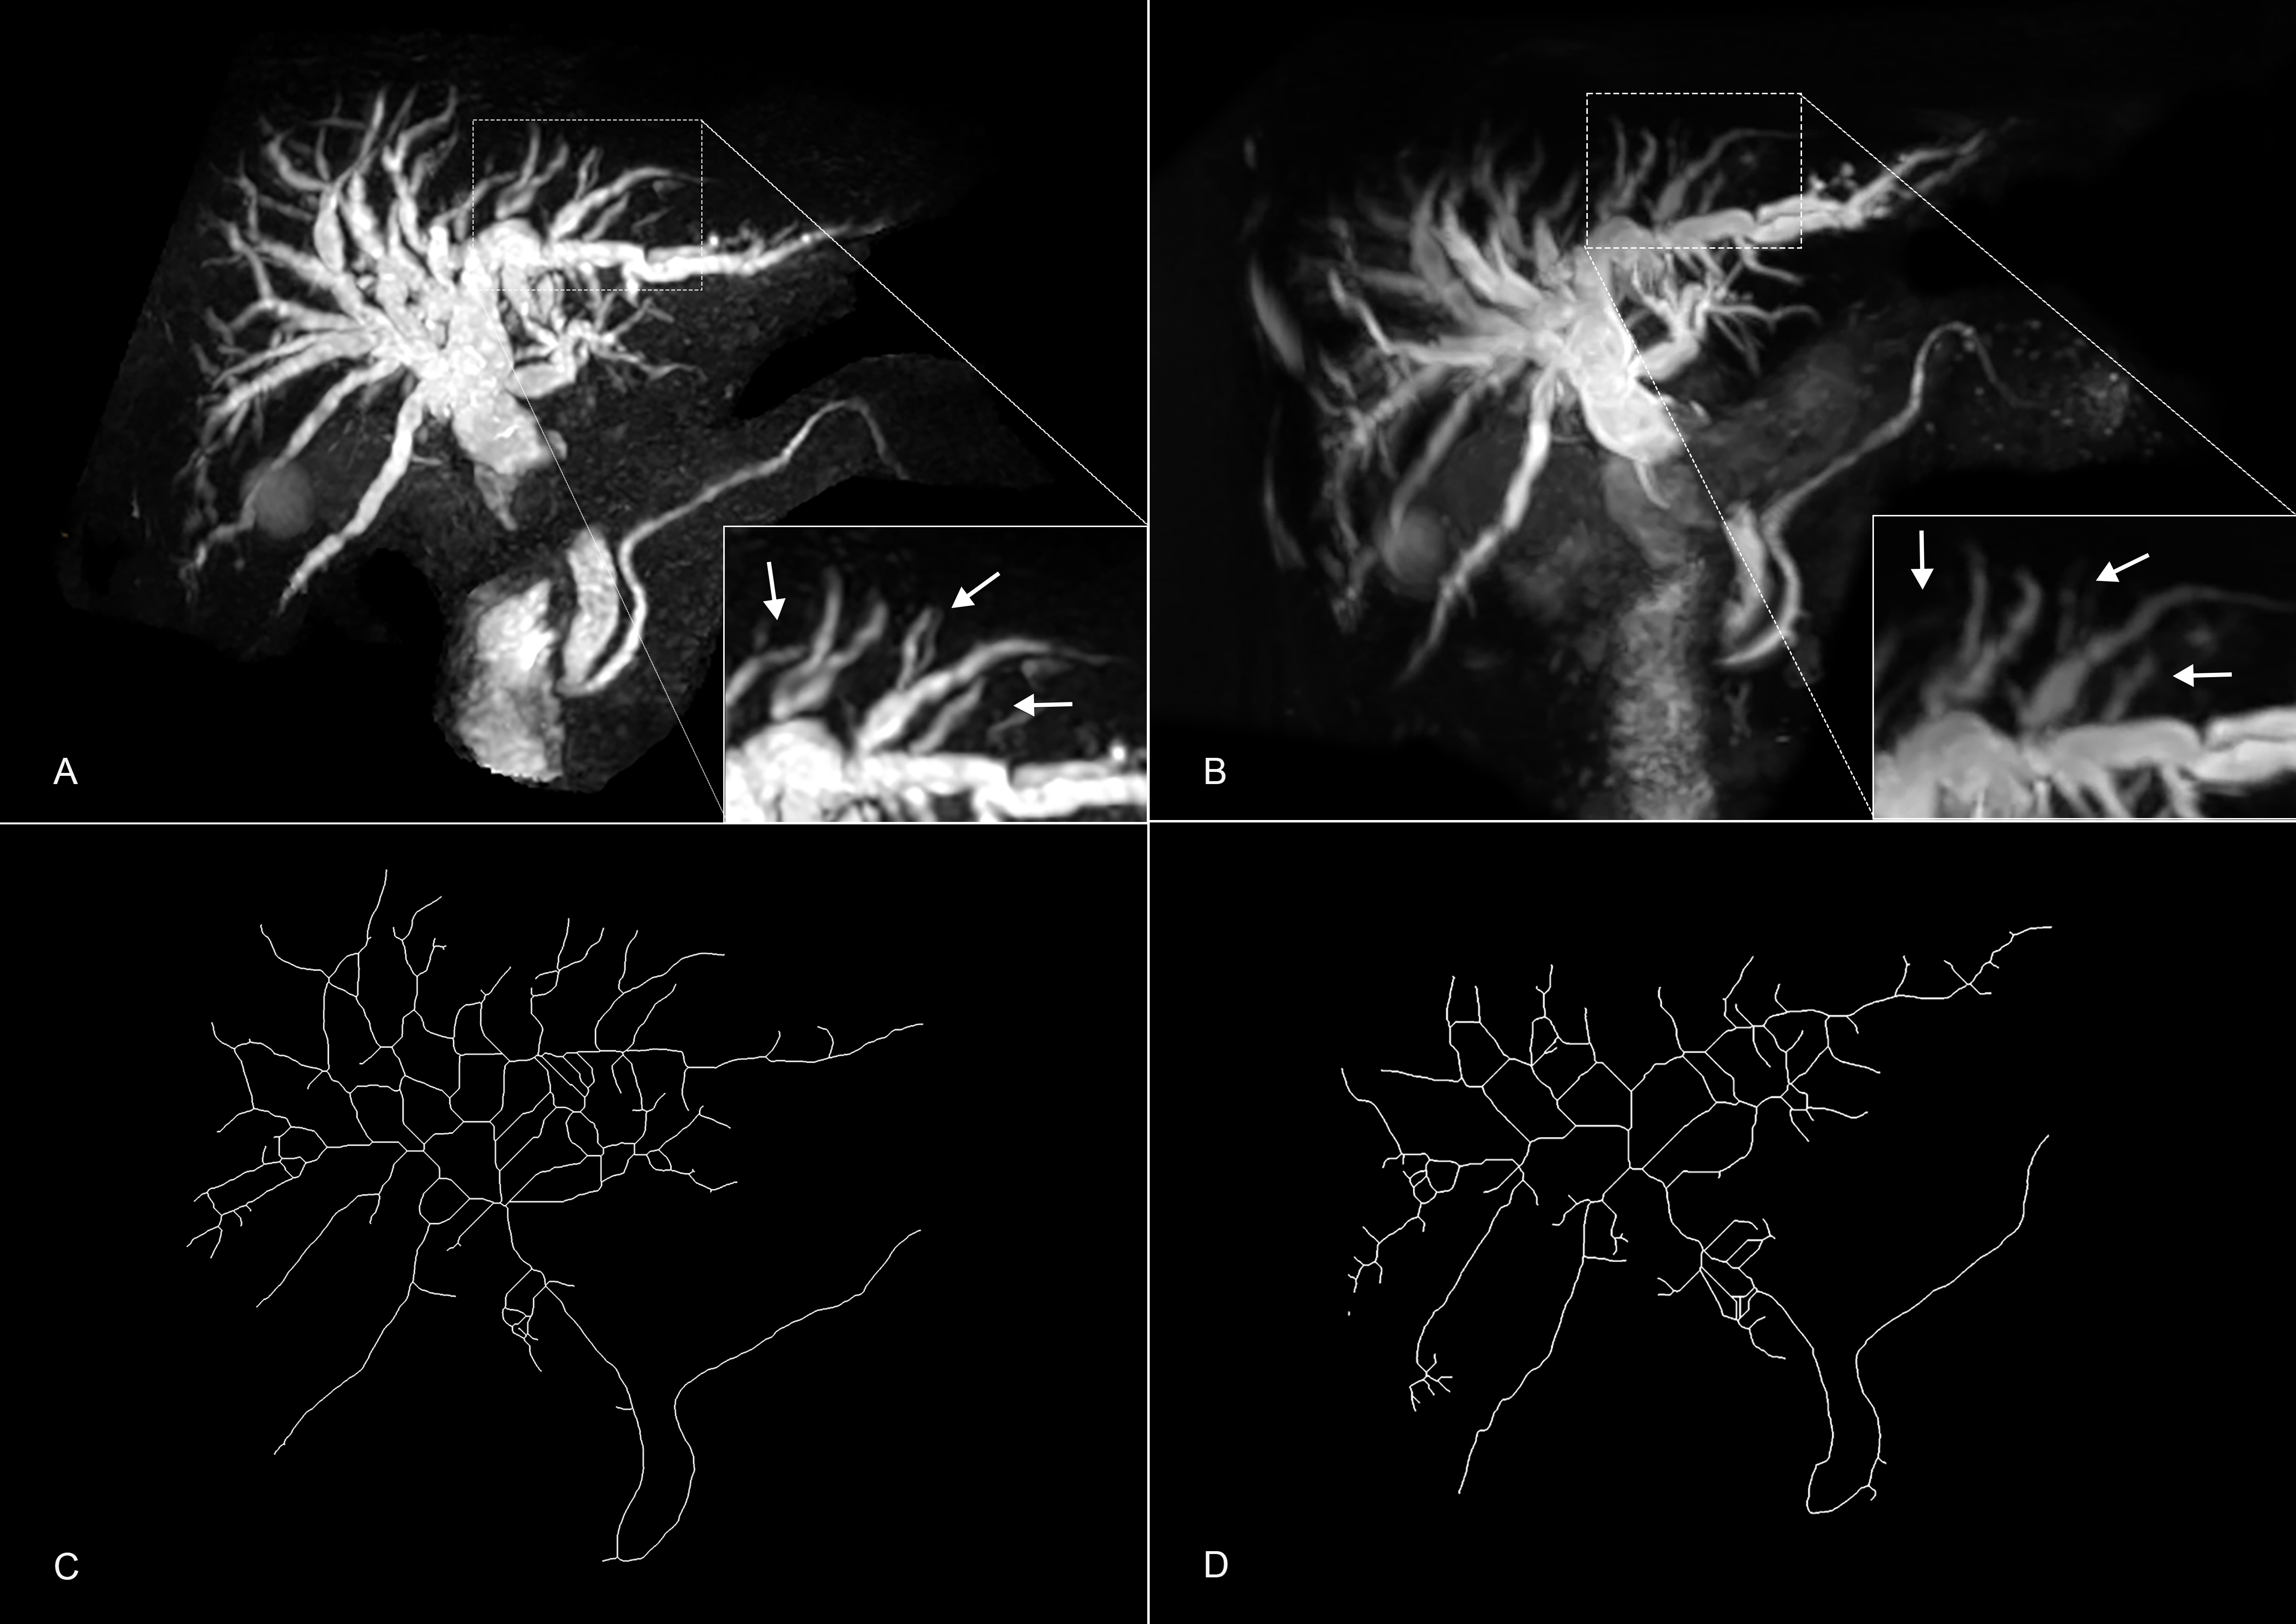
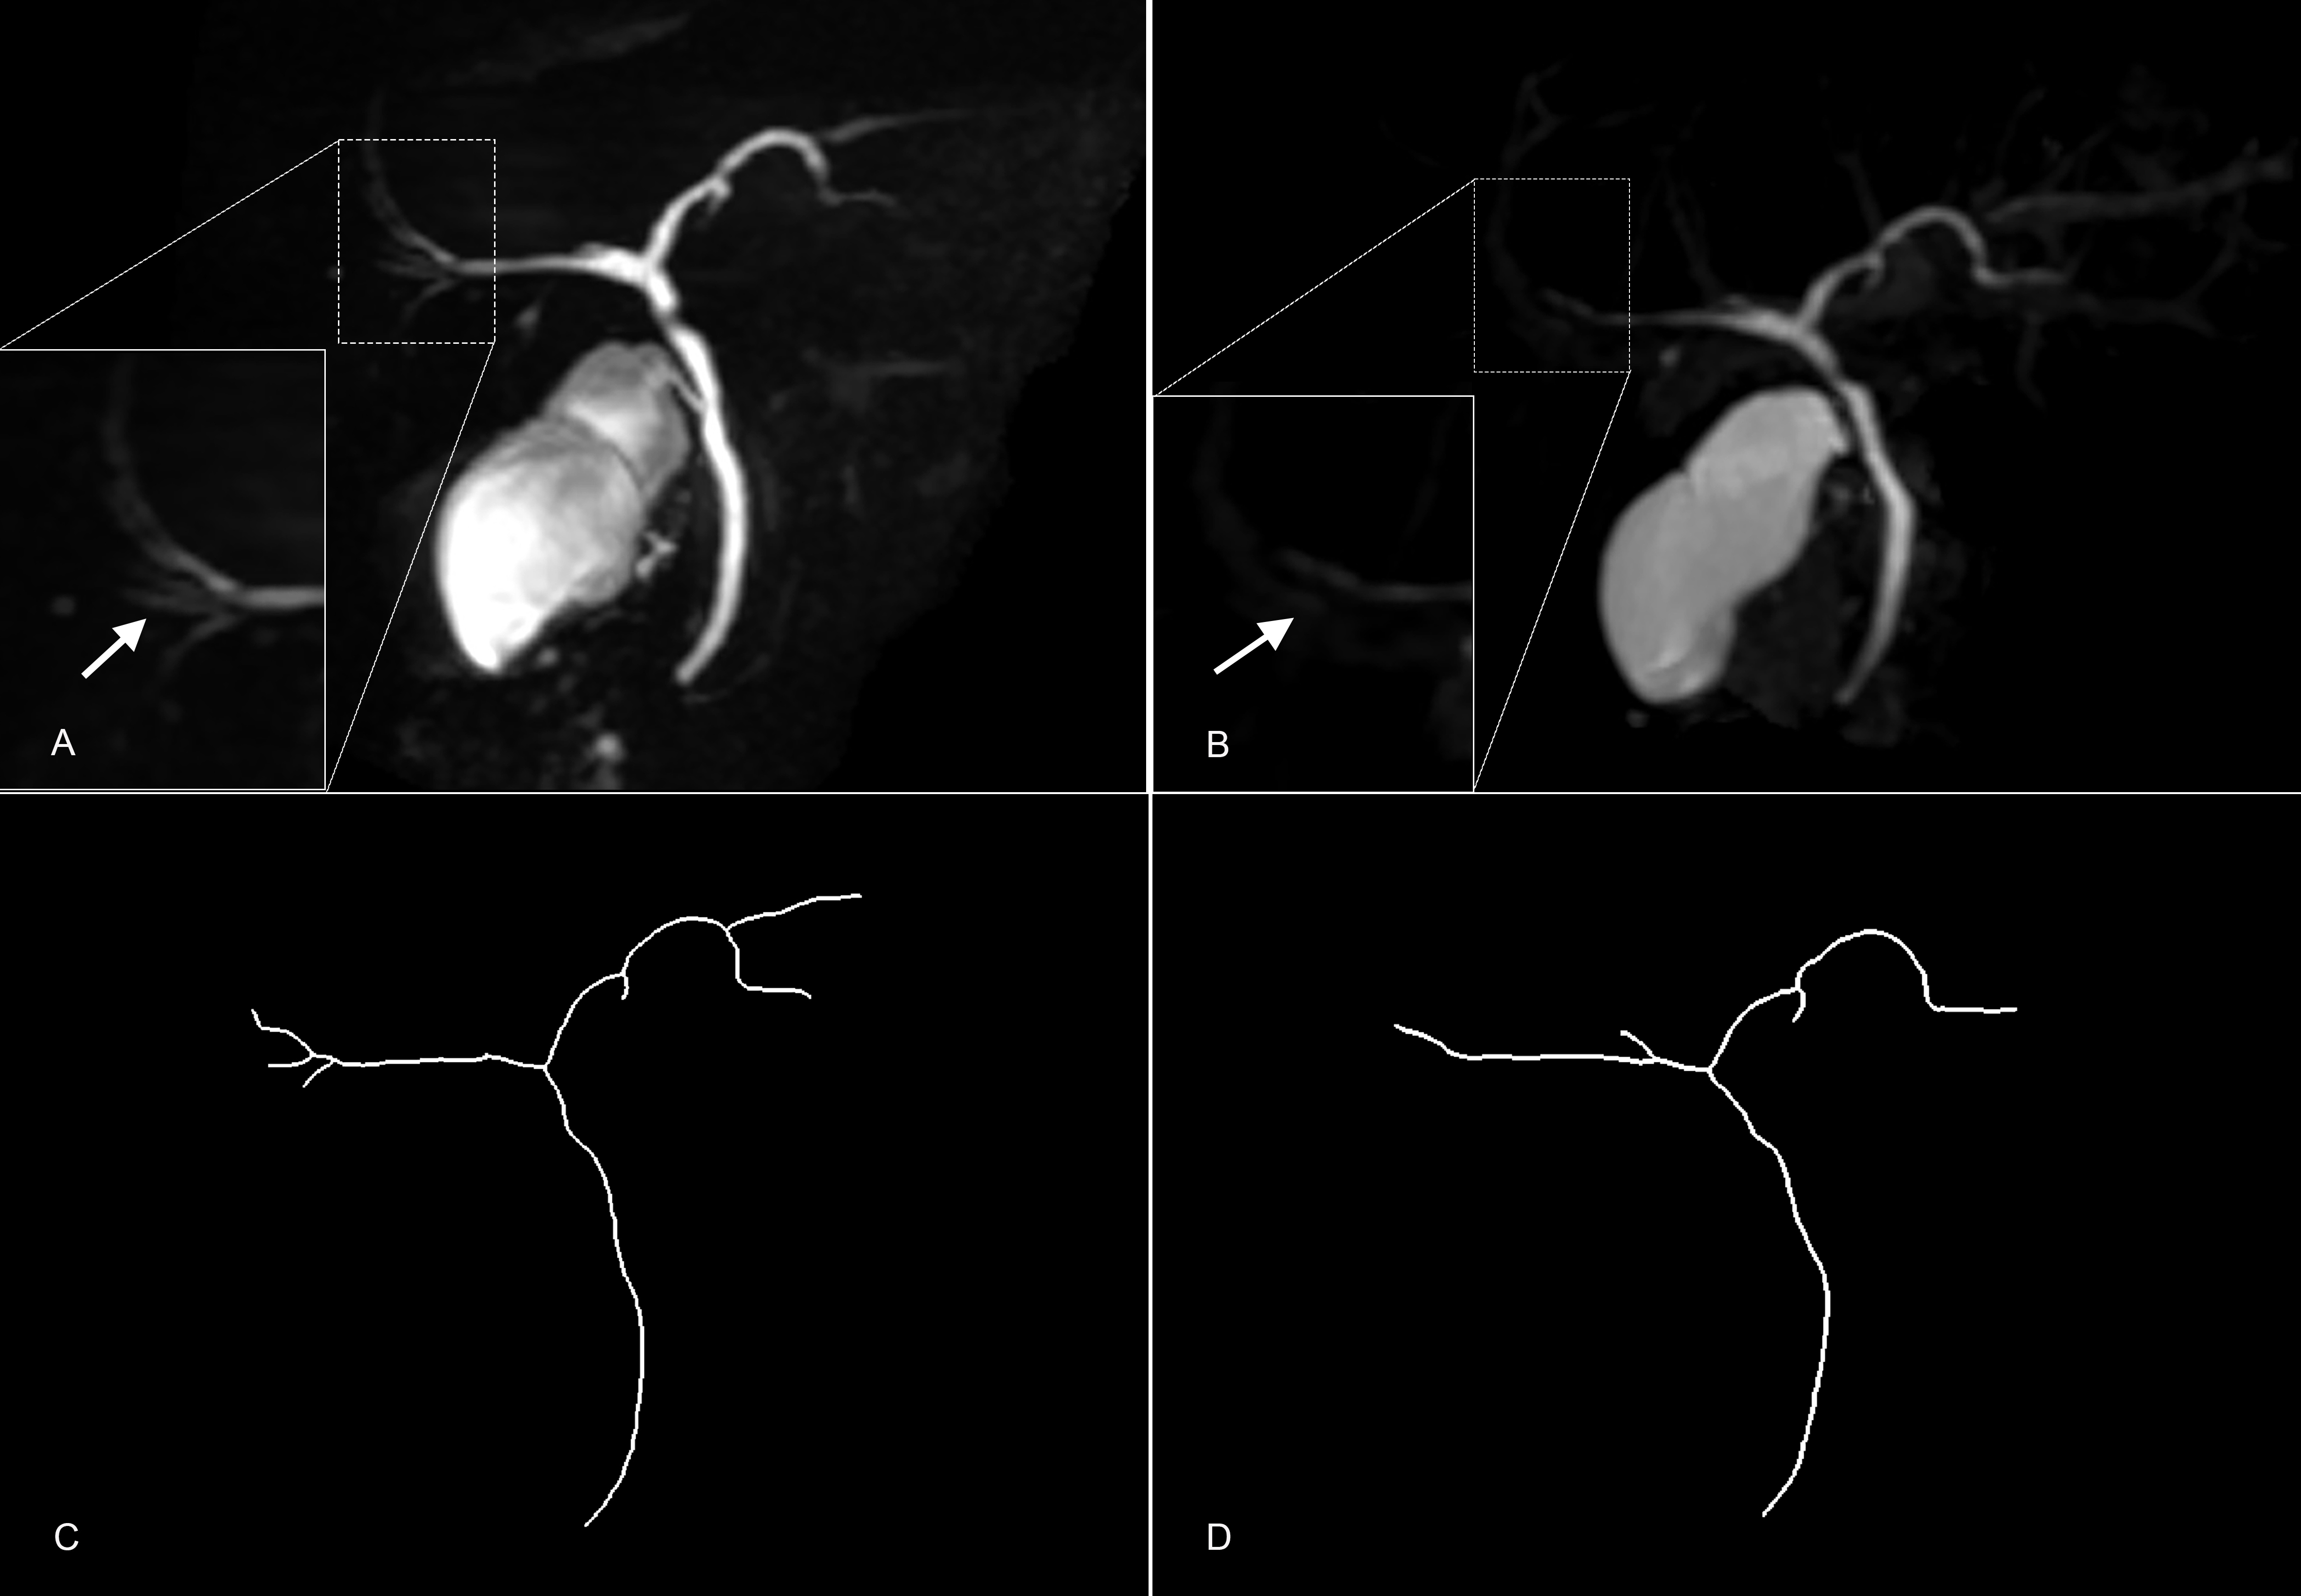
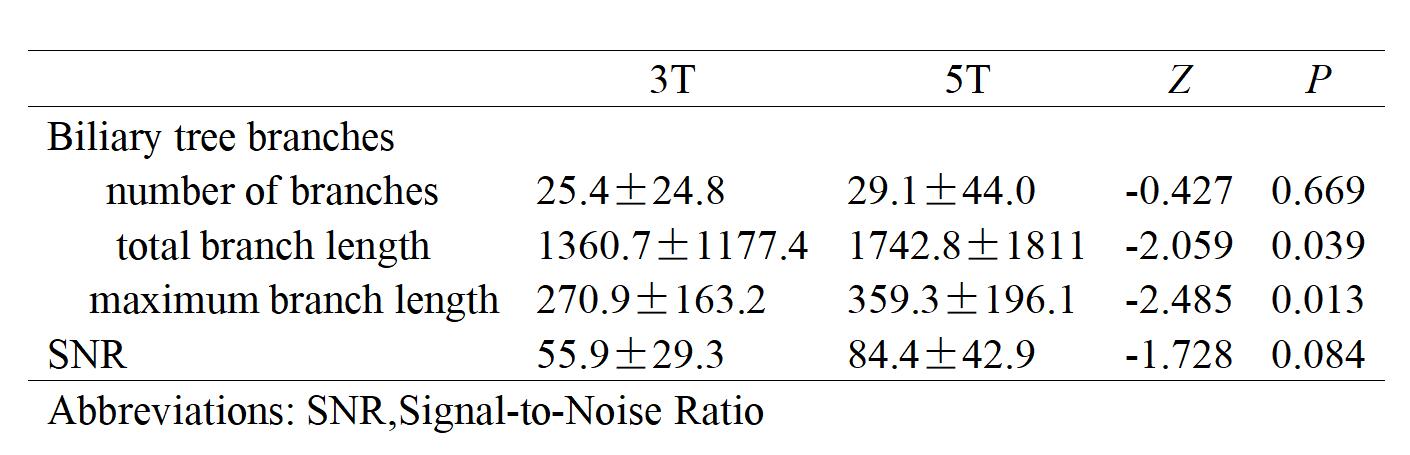
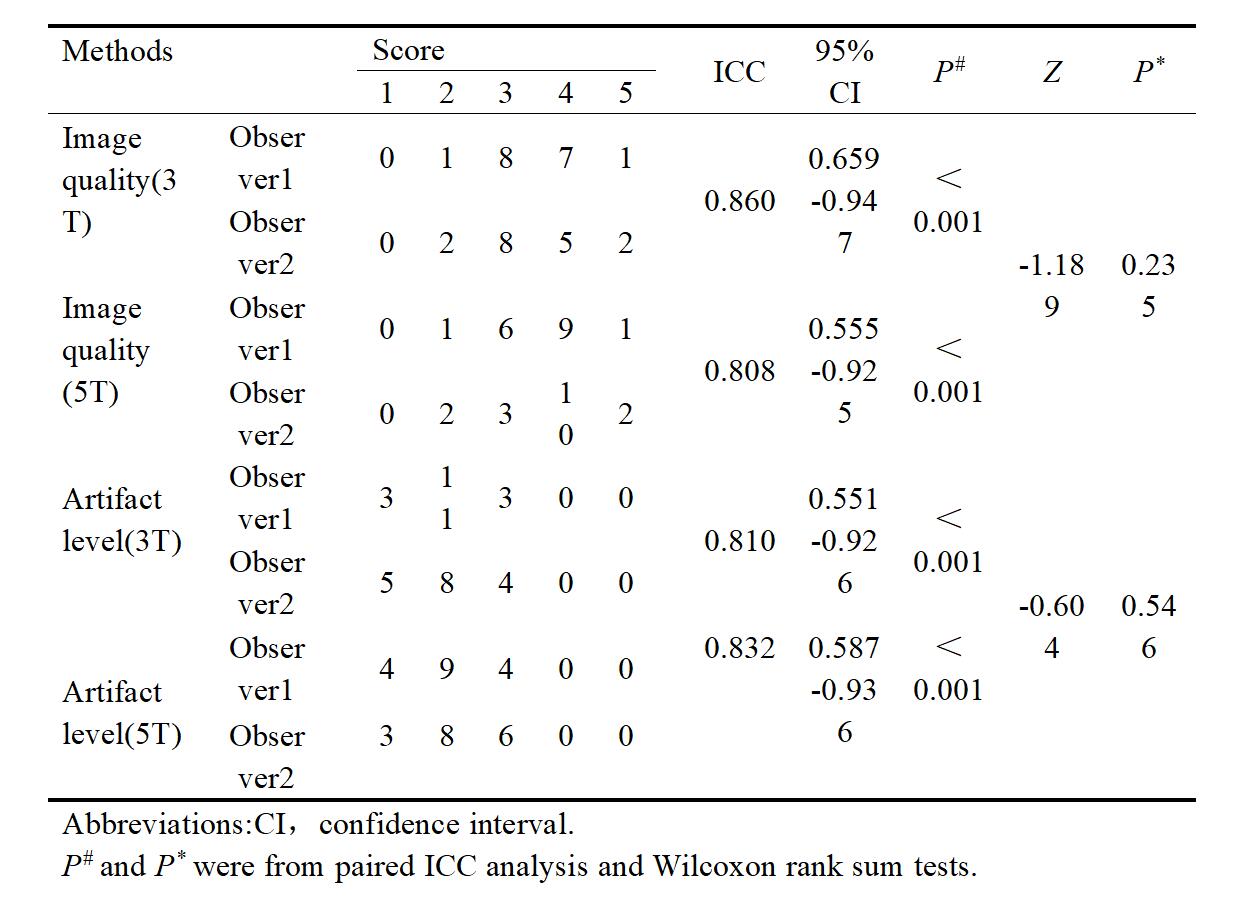
In the study, 18 individuals underwent MRCP examination, but one was excluded due to claustrophobia during the 3T scan, leaving 17 subjects (7 females, 10 males, mean age 32.6±14.7 years). The total visualized length of biliary branches was significant greater with 5 T (1742.8±1811) than 3 T (1360.7±1177.4) with P=0.039. The maximum branch length was longer at 5 T (359.3±196.1) compared to 3 T (270.9±163.2), with P=0.013. However, the number of branches was not significantly different at 5 T (55.9±29.3) and 3 T (25.4±24.8) (P=0.669) (Table 1). Figures 2 and 3 depict a comparison between 3 T and 5 T images for participants with and without choledocholithiasis. The SNR was higher for 5 T (84.4±42.9) compared to 3 T (55.9±29.3), although not significantly (P=0.084) (Table 1). Qualitative comparisons of image quality and artifact levels between the two field strengths showed no significant differences (Table 2).DISCUSSION
Our study utilized a semi-automated approach to evaluate MRCP images at 3 T and 5 T, finding superior visualization of biliary details at 5 T, with notably more extended visualized branches, but no significant difference in branch count. The positive correlation between signal intensity and magnetic field strength suggests anticipated detail resolution benefits at 5 T, supported by literature indicating improvements in image contrast and quality when increasing field strength. Nevertheless, our study found no significant difference in SNR between 3 T and 5 T, contrasting with other studies demonstrating 5 T's superior SNR in certain applications.Qualitative assessments showed equivalent artifact control between the two field strengths, despite the challenges inherent to 5 T MRCP, such as susceptibility artifacts and B1 inhomogeneity. Our findings suggest that while 5 T MRI has potential in MRCP, current protocols and technology require refinement to fully realize this potential.The study also has limitations, including a focus on a breath-triggered 3D TSE protocol without evaluating 3D GRASE imaging, not distinguishing healthy subjects by bile duct size, and using scanners from different manufacturers, albeit with similar scanning parameters. Further research is needed to optimize 5 T MRCP imaging, especially for patients with dilated ducts.
CONCLUSION
MRCP at 5 T improves the visualization of the biliary tree over 3 T, enhancing diagnostic in biliary and pancreatic duct imaging. The SNR, image quality, and artifacts handling are similarly effective at both 5 T and 3 T.Acknowledgements
No acknowledgement found.References
1. Yoen H, Lee JM, Lee SM, et al. Comparisons between image quality and diagnostic performance of 2D- and breath-hold 3D magnetic resonance cholangiopancreatography at 3T. Eur Radiol. 2021. 31(11): 8399-8407.
2. Griffin N, Yu D, Alexander Grant L. Magnetic resonance cholangiopancreatography: pearls, pitfalls, and pathology. Semin Ultrasound CT MR. 2013. 34(1): 32-43.
3. Sahni VA, Mortele KJ. Magnetic resonance cholangiopancreatography: current use and future applications. Clin Gastroenterol Hepatol. 2008. 6(9): 967-77.
4. Itani M, Lalwani N, Anderson MA, Arif-Tiwari H, Paspulati RM, Shetty AS. Magnetic resonance cholangiopancreatography: pitfalls in interpretation. Abdom Radiol (NY). 2023. 48(1): 91-105.
5. Kaltenthaler E, Vergel YB, Chilcott J, et al. A systematic review and economic evaluation of magnetic resonance cholangiopancreatography compared with diagnostic endoscopic retrograde cholangiopancreatography. Health Technol Assess. 2004. 8(10): iii, 1-89.
6. Buxbaum JL, Abbas Fehmi SM, Sultan S, et al. ASGE guideline on the role of endoscopy in the evaluation and management of choledocholithiasis. Gastrointest Endosc. 2019. 89(6): 1075-1105.e15.
7. Park JE, Cheong EN, Jung DE, Shim WH, Lee JS. Utility of 7 Tesla Magnetic Resonance Imaging in Patients With Epilepsy: A Systematic Review and Meta-Analysis. Front Neurol. 2021. 12: 621936.
8. Giraudo C, Motyka S, Weber M, Feiweier T, Trattnig S, Bogner W. Diffusion Tensor Imaging of Healthy Skeletal Muscles: A Comparison Between 7 T and 3 T. Invest Radiol. 2019. 54(1): 48-54.
9. Lecler A, Duron L, Charlson E, et al. Comparison between 7 Tesla and 3 Tesla MRI for characterizing orbital lesions. Diagn Interv Imaging. 2022. 103(9): 433-439.
10. Hahnemann ML, Kraff O, Orzada S, et al. T1-Weighted Contrast-Enhanced Magnetic Resonance Imaging of the Small Bowel: Comparison Between 1.5 and 7 T. Invest Radiol. 2015. 50(8): 539-47.
11. Umutlu L, Maderwald S, Kraff O, et al. New look at renal vasculature: 7 tesla nonenhanced T1-weighted FLASH imaging. J Magn Reson Imaging. 2012. 36(3): 714-21.
12. Fiedler TM, Orzada S, Flöser M, et al. Performance and safety assessment of an integrated transmit array for body imaging at 7 T under consideration of specific absorption rate, tissue temperature, and thermal dose. NMR Biomed. 2022. 35(5): e4656.
13. Zhang Y, Yang C, Liang L, et al. Preliminary Experience of 5.0 T Higher Field Abdominal Diffusion-Weighted MRI: Agreement of Apparent Diffusion Coefficient With 3.0 T Imaging. J Magn Reson Imaging. 2022. 56(4): 1009-1017.
14. Wei Z, Chen Q, Han S, et al. 5T magnetic resonance imaging: radio frequency hardware and initial brain imaging. Quant Imaging Med Surg. 2023. 13(5): 3222-3240.
15. Schindelin J, Arganda-Carreras I, Frise E, et al. Fiji: an open-source platform for biological-image analysis. Nat Methods. 2012. 9(7): 676-82.16. Epistatou AC, Tsalafoutas IA, Delibasis KK. An Automated Method for Quality Control in MRI Systems: Methods and Considerations. J Imaging. 2020. 6(10).
16. Epistatou AC, Tsalafoutas IA, Delibasis KK. An Automated Method for Quality Control in MRI Systems: Methods and Considerations. J Imaging. 2020. 6(10).
Figures