0432
Validating Quantitative Transport Mapping (QTM) on a Perfused Liver Phantom1Biomedical Engineering, Cornell University, Ithaca, NY, United States, 2Radiology, Weill Cornell Medical College, New York, NY, United States, 3Electrical Engineering and Computer Science, Cornell University, Ithaca, NY, United States, 4Mechanical And Aerospace Engineering, Cornell University, Ithaca, NY, United States, 5Radiology, Columbia University Vagelos College of Physicians and Surgeons, New York, NY, United States
Synopsis
Keywords: Cancer, Perfusion, Dynamic Contrast Enhanced MRI; Liver; Validation; Deep Learning; Phantoms
Motivation: To validate deep learning based Quantitative Transport Mapping (QTMnet) on a perfused tissue phantom.
Goal(s): Evaluate the accuracy of QTMnet derived flow and compare to traditional tracer-kinetic flow estimation.
Approach: We developed a workflow to prepare porcine liver as a perfusion phantom1. We perfused n=8 porcine livers with a controllable pump and acquired DCE-MRI. We then estimated the liver flow with QTMnet and traditional tracer-kinetics.
Results: QTMnet accurately estimates our phantom flow (mean error: -2.82%, mean absolute error: 10.0%). Furthermore, QTMnet flow estimation was more accurate than traditional tracer-kinetics flow estimation (mean error: -43.29%, mean absolute error: 58.9%, P<0.00001).
Impact: Our liver phantom workflow allows demonstrating accuracy of estimated flows. Superior accuracy was observed using QTMnet compared to traditional tracer-kinetics. Accurate estimation of liver blood flow allows better diagnosis and follow-up in the imaging of primary and secondary liver cancer.
Introduction
Dynamic Contrast Enhanced (DCE) MRI has become a cornerstone imaging modality in several diseases2,3. However, the spatiotemporal signal only provides qualitative information to the radiologist. To address this issue, much effort has gone into modeling the DCE signal for perfusion quantification4,5. However, traditional tracer-kinetic depend on a globally defined arterial input function, in which different choices for the AIF greatly affect parameter estimation. To address this, we have previously developed Quantitative Transport Mapping (QTM)5-7 and QTMnet8 which found promise in many applications6,9-12. While QTMnet has been validated in numerical simulations7, there is still a need for validation in perfusion phantoms. To this end, we developed a porcine tissue perfusion phantom and with adjustable flow rate1. We show that QTMnet accurately estimates the specified phantom flow and consistently outperforms the traditional tracer kinetics approach.Theory
QTMnet employs the QTM forward problem to generate synthetic data to train a neural network. In this work, we use a mixed Gaussian distribution to generate flow ($$$F$$$) and volume fraction ($$$V_{p}$$$) maps for a cubic volume of $$$32\times32\times32mm^{3}$$$. With $$$F$$$, we create the arterial and venous vascular trees with Constrained Constructive Optimization (CCO)13. Once the vascular tree is generated, we generate a tracer boundary condition $$$c_p(\mathbf{x}_{0},t)$$$ and propagate it through the geometry and forward problem to obtain $$$c_{p}(\mathbf{x},t)$$$8. A U-Net was trained to map the synthetic time resolved concentration data back to the underlying flow ($$$F$$$) maps. Training used an $$$L_{1}$$$ loss function and the ADAM solver with learning rate 0.001 and betas (0.9,0.999).In this study, we used the one-compartment tracer-kinetic model as a widely used reference standard5,14,15:
$$V_{p}(\mathbf{x})\partial_{t}c_{p}=F(\mathbf{x})(c_{a}(t)-c_{p}(\mathbf{x},t))$$
Methods
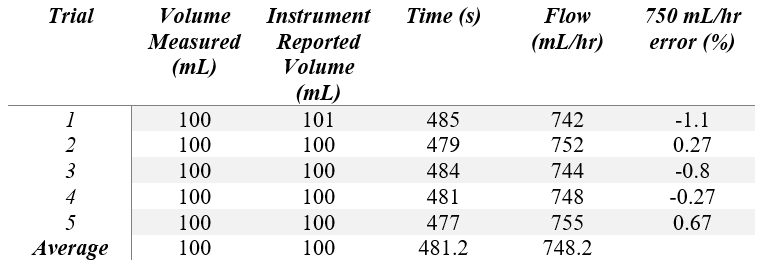
Explanted porcine livers (n=8) were selected and cannulated according to a protocol outlined from our previous work1. Then, the sample was connected to an MR-IDIUM MR-compatible flow pump. To ensure accurate input flow, we used a graduated cylinder and a timer. We directed the flow of the MR-IDIUM flow pump ($$$F_{pump}$$$ = 750 mL/hr) into the graduated cylinder and ensured fluid existed throughout the entire IV line without air bubbles. The time between start of the pump and the time graduated cylinder read 100 mL was recorded (Table 1). This process was repeated five times.DCE imaging was conducted with DISCO (Differential Subsampling with Cartesian Ordering, GE Healthcare) on a 3T using imaging parameters: TE = 1ms, TR = 3ms, flip angle = 10˚, matrix = 200 x 200 x 20, phase FOV=0.9, slice thickness=2mm, 121 time frames, time resolution = 2.1s. The liver specimens were perfused with a 5 mM bolus of diluted Gadopentetate Dimeglumine (Bayer) with varying bolus injection volumes, for a total of eight trials. Gd concentration was assumed to be linearly proportional to the relative enhancement or $$$c(\mathbf{x},t)=(S(\mathbf{x},t)-S(\mathbf{x},0))/S(\mathbf{x},0)$$$. Once flow is estimated on a voxel by voxel basis, total tissue flow was estimated by adding the flows of all voxels with in the liver tissue mask. Error was computed as $$$100\times(tissue flow - F_{pump})/F_{pump}$$$. A two-tailed paired student’s t-test was used to compare QTMnet with traditional tracer-kinetics.
Results
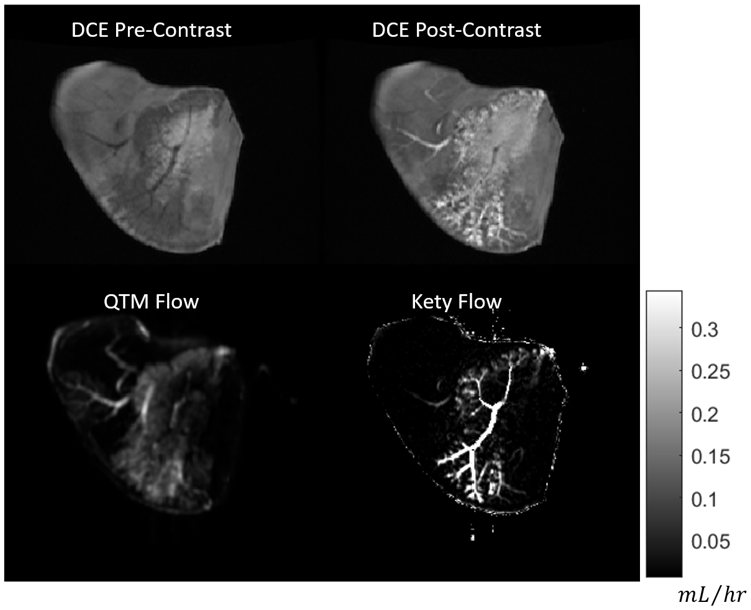
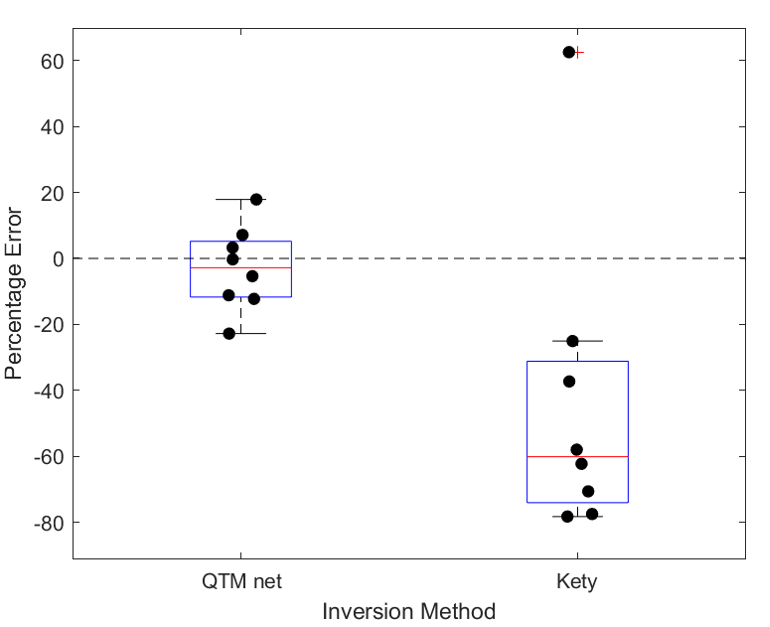
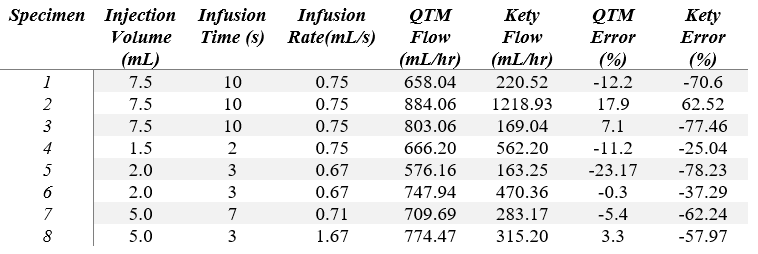
Table 1 shows that the errors found during calibration were between -1.1% to 0.67% with an average absolute error of 0.62%. We thus found that the pump provided sufficient and consistent accuracy at a flow rate of 750 mL per hour. Figure 2 shows the pre- and post-contrast images as well as the QTMnet and tracer-kinetic derived flow maps in one slice through the perfused tissue. Figure 3 shows the QTMnet and tracer-kinetic derived flow total flow for each of the 8 trials. QTMnet shows an average error that is significantly smaller than that of tracer-kinetics modeling. QTMnet had a mean error of -2.82% (range: -23.17% — 17.90%) and tracer-kinetics had a mean error of -43.29% (range: -78.23% — 62.52%; Table 2). When comparing the magnitude deviation of QTMnet (mean magnitude deviation: 10.0%) to tracer-kinetics (mean magnitude deviation: 58.9%), QTMnet was significantly more accurate than traditional tracer-kinetics (P<10-5; Table 2).Discussion
This study shows that QTMnet can accurately estimate the flow rate of perfused tissue. Furthermore, we find that QTM outperforms one-compartment Kety parameter estimation. DCE-MRI has been shown to be an important acquisition in diagnosing and monitoring Hepatocellular Carcinoma (HCC)16,17. In this case, QTMnet may be a promising non-invasive method for accurately measuring liver blood flow in cancer for better diagnosis and follow up. In the future, we will plan to acquire QTMnet in-vivo and analyze QTMnet derived flow in the diagnosis of HCC.Acknowledgements
This work was funded by the NIH 1 R01 EB034755-01.References
- Romano DŞ, Mert; Zhang, Qihao; Nguyen, Thanh; Spincemaille, Pascal; Prince, Martin; Wang, Yi. Building a Liver Perfusion Phantom for Vessel Size Imaging. Proceedings of the International Society of Magnetic Resonance in Medicine Annual Meeting 2023(No. 7663).
- Gordon Y, Partovi S, Müller-Eschner M, Amarteifio E, Bäuerle T, Weber MA, Kauczor HU, Rengier F. Dynamic contrast-enhanced magnetic resonance imaging: fundamentals and application to the evaluation of the peripheral perfusion. Cardiovasc Diagn Ther 2014;4(2):147-164.
- Padhani AR. Dynamic contrast-enhanced MRI in clinical oncology: Current status and future directions. Journal of Magnetic Resonance Imaging 2002;16(4):407-422.
- Sourbron S. A Tracer-Kinetic Field Theory for Medical Imaging. IEEE Transactions on Medical Imaging 2014;33(4):935-946.
- Sourbron SP, Buckley DL. Classic models for dynamic contrast-enhanced MRI. NMR in Biomedicine 2013;26(8):1004-1027.
- Liu P, Lee YZ, Aylward SR, Niethammer M. Perfusion Imaging: An Advection Diffusion Approach. IEEE Transactions on Medical Imaging 2021;40(12):3424-3435.
- Zhou L, Zhang Q, Spincemaille P, Nguyen TD, Morgan J, Dai W, Li Y, Gupta A, Prince MR, Wang Y. Quantitative transport mapping (QTM) of the kidney with an approximate microvascular network. Magnetic Resonance in Medicine 2021;85(4):2247-2262.
- Zhang Q. Estimating Perfusion and Vascular Properties from Medical Images: Quantitative Transport Mapping (QTM) [Ph.D.]. United States -- New York: Cornell University; 2023. 104 p.
- Zhang Q, Spincemaille P, Drotman M, Chen C, Eskreis-Winkler S, Huang W, Zhou L, Morgan J, Nguyen TD, Prince MR, Wang Y. Quantitative transport mapping (QTM) for differentiating benign and malignant breast lesion: Comparison with traditional kinetics modeling and semi-quantitative enhancement curve characteristics. Magn Reson Imaging 2022;86:86-93.
- Huang W, Zhang Q, Wu G, Chen PP, Li J, McCabe Gillen K, Spincemaille P, Chiang GC, Gupta A, Wang Y, Chen F. DCE-MRI quantitative transport mapping for noninvasively detecting hypoxia inducible factor-1α, epidermal growth factor receptor overexpression, and Ki-67 in nasopharyngeal carcinoma patients. Radiother Oncol 2021;164:146-154.
- Zhang Q, Lee KS, Talenfeld AD, Spincemaille P, Prince MR, Wang Y. Prediction of Lung Shunt Fraction for Yttrium-90 Treatment of Hepatic Tumors Using Dynamic Contrast Enhanced MRI with Quantitative Perfusion Processing. Tomography 2022;8(6):2687-2697.
- Zhang Q, Luo X, Zhou L, Nguyen TD, Prince MR, Spincemaille P, Wang Y. Fluid Mechanics Approach to Perfusion Quantification: Vasculature Computational Fluid Dynamics Simulation, Quantitative Transport Mapping (QTM) Analysis of Dynamics Contrast Enhanced MRI, and Application in Nonalcoholic Fatty Liver Disease Classification. IEEE Transactions on Biomedical Engineering 2023;70(3):980-990.
- Karch R, Neumann F, Neumann M, Schreiner W. A three-dimensional model for arterial tree representation, generated by constrained constructive optimization. Comput Biol Med 1999;29(1):19-38.
- Sourbron SP, Buckley DL. On the scope and interpretation of the Tofts models for DCE-MRI. Magnetic Resonance in Medicine 2011;66(3):735-745.
- Kety SS. The theory and applications of the exchange of inert gas at the lungs and tissues. Pharmacol Rev 1951;3(1):1-41.
- Chen BB, Shih TT. DCE-MRI in hepatocellular carcinoma-clinical and therapeutic image biomarker. World J Gastroenterol 2014;20(12):3125-3134.
- Chen BB, Hsu CY, Yu CW, Liang PC, Hsu C, Hsu CH, Cheng AL, Shih TT. Dynamic Contrast-enhanced MR Imaging of Advanced Hepatocellular Carcinoma: Comparison with the Liver Parenchyma and Correlation with the Survival of Patients Receiving Systemic Therapy. Radiology 2016;281(2):454-464.
Figures