0431
Clinical Value of 4D Flow MRI in Assessing High-Risk Esophagogastric Varices: A Prospective Study1Guizhou Provincial People’s Hospital, Guiyang, China, 2Philips Healthcare, Beijing, China, 3Philips Healthcare, Chengdu, China
Synopsis
Keywords: Liver, Body, 4D Flow MRI; portal hypertension; Esophagogastric Varices
Motivation: The pursuit of less invasive diagnostic methods to gauge portal hypertension and the associated risk of variceal bleeding in cirrhosis patients.
Goal(s): To determine the effectiveness of hemodynamic parameters derived from 4D flow MRI for the non-invasive assessment of portal hypertension and to stratify the risk of variceal bleeding in patients with cirrhosis.
Approach: Utilizing hemodynamic parameters from 4D flow MRI to profile portal circulation.
Results: Results showed significant differences in FFC and maximum splenic blood flow between low-risk and high-risk patients. Moreover, the combination of FFC and maximum splenic blood yielded high diagnostic accuracy.
Impact: Demonstrating the utility of 4D flow MRI in evaluating portal hypertension and variceal bleeding risk.
Introduction
Esophageal and gastric variceal (EGV) bleeding is a critical complication of liver cirrhosis. Identifying varices at risk of hemorrhage is vital for primary prevention, which can reduce mortality rates significantly1. Although hepatic venous pressure gradient (HVPG) is the benchmark for gauging portal pressure, it's not routinely used clinically due to its invasiveness and cost 1,2.4D flow MRI is an advanced imaging technique that provides a more comprehensive and intuitive depiction of blood flow patterns and accurately quantifies hemodynamic parameters. Although 4D flow MRI cannot directly evaluate portal vein (PV) pressure, it can assess the morphology of varices, blood flow direction, and blood flow fraction, thereby indirectly evaluating portal hypertension3. Despite this, there is currently a lack of research on the use of 4D flow MRI to evaluate the risk of EGV bleeding in patients with liver cirrhosis and portal hypertension.
Our study seeks to bridge this gap by prospectively evaluating the effectiveness of 4D flow MRI in patients with cirrhotic portal hypertension, aiming to validate its utility as a non-invasive tool for risk stratification in this vulnerable population.
Materials and Methods
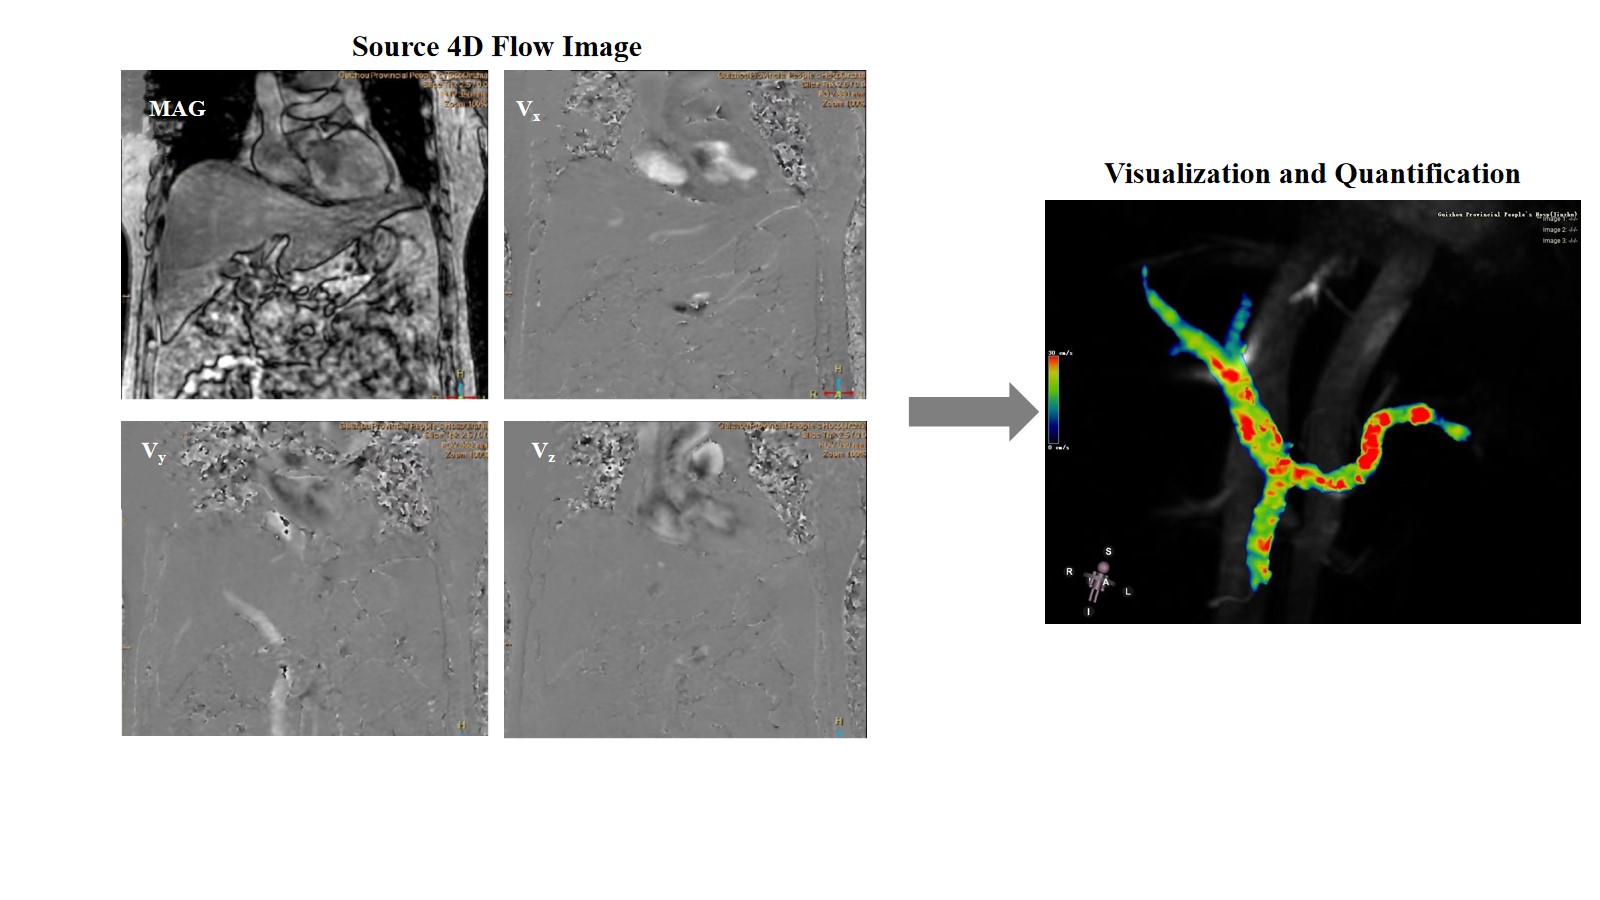
Following ethical approval and informed consent, our study enrolled 14 healthy controls and 21 patients with cirrhosis. Participants were stratified into healthy controls (HC, n=14), low-risk varices (LRV, n=19), and high-risk varices (HRV, n=7). The experiment was implemented on a 3.0T MR scanner (Ingenia Elition, Philips Healthcare, Best, The Netherlands). Protocols included a coronal T2-weighted sequence to visualize the portal vein, followed by a 2D QFlow sequence for flow measurement, according to which 4D Flow encoding velocity (Venc) was set at 120% of peak velocity. Scanning parameters for 4D flow were: FOV= 40×40×40 cm3, Flip angle=10°, voxel size= isotropic 2.0mm or 2.5mm, Recon heat phases =20, CS-SENSE acceleration factor= 2.5 or 3.5.As shown in Figure 1, the CVI version 42 is used to post-process 4D flow data to obtain visualized blood flow diagrams and hemodynamic parameters. The Fractional Flow Change (FFC) in the portal vein is calculated according: FFC = (PV - (SMV + SV)) / (SMV + SV), where SMV represents superior mesenteric vein, and SV represents splenic vein.
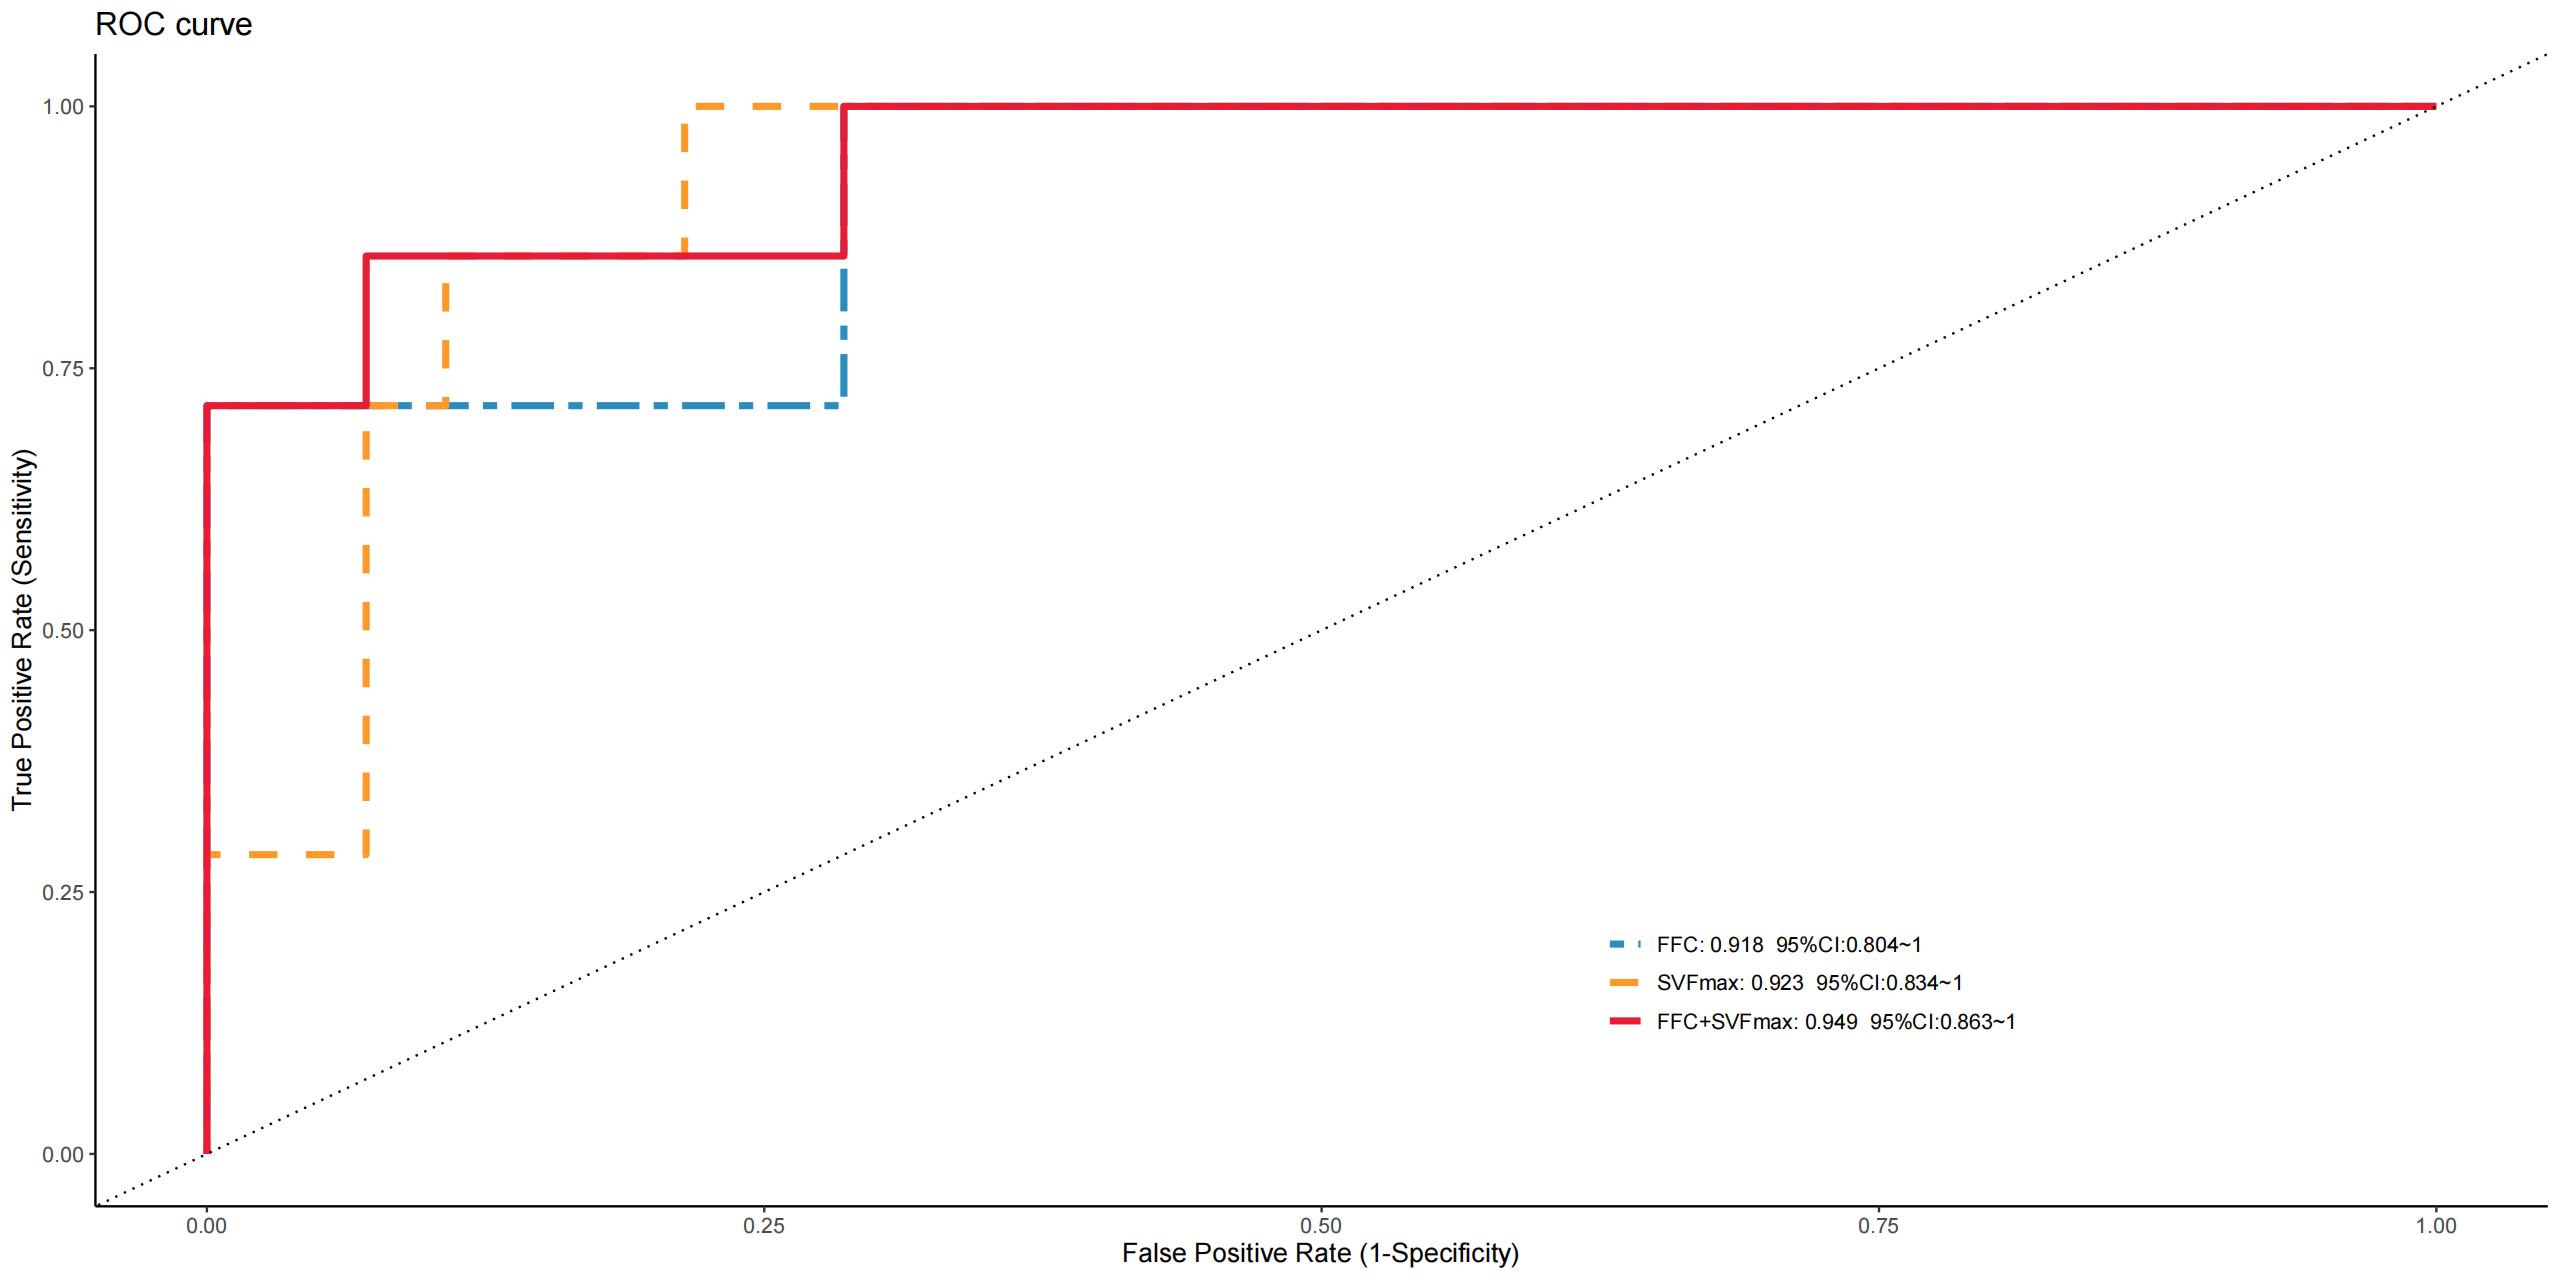
Statistical analysis was done with ANOVA for continuous variables and Chi-square for categorical variables. P<0.05 was considered as significant. Receiver-operating characteristic curve (ROC) analyses were used to identify key factors for prediction HRV.
Results
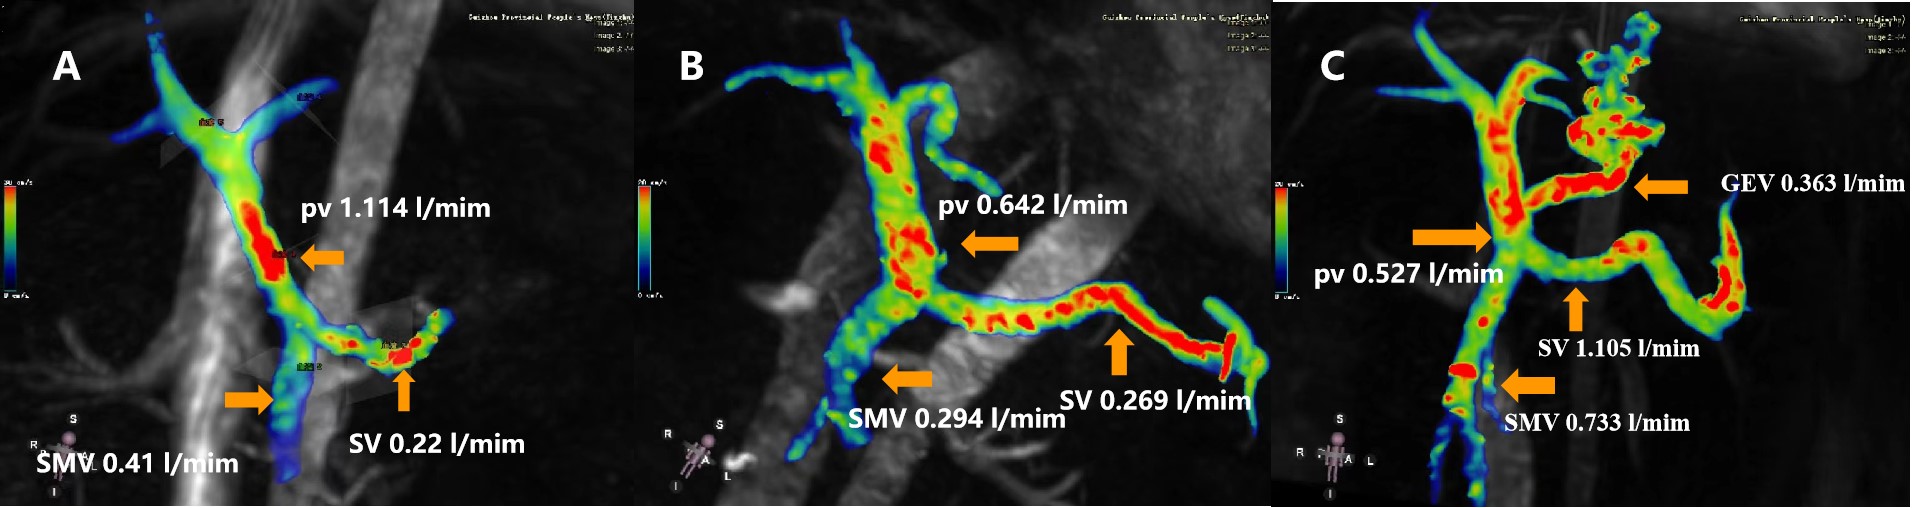
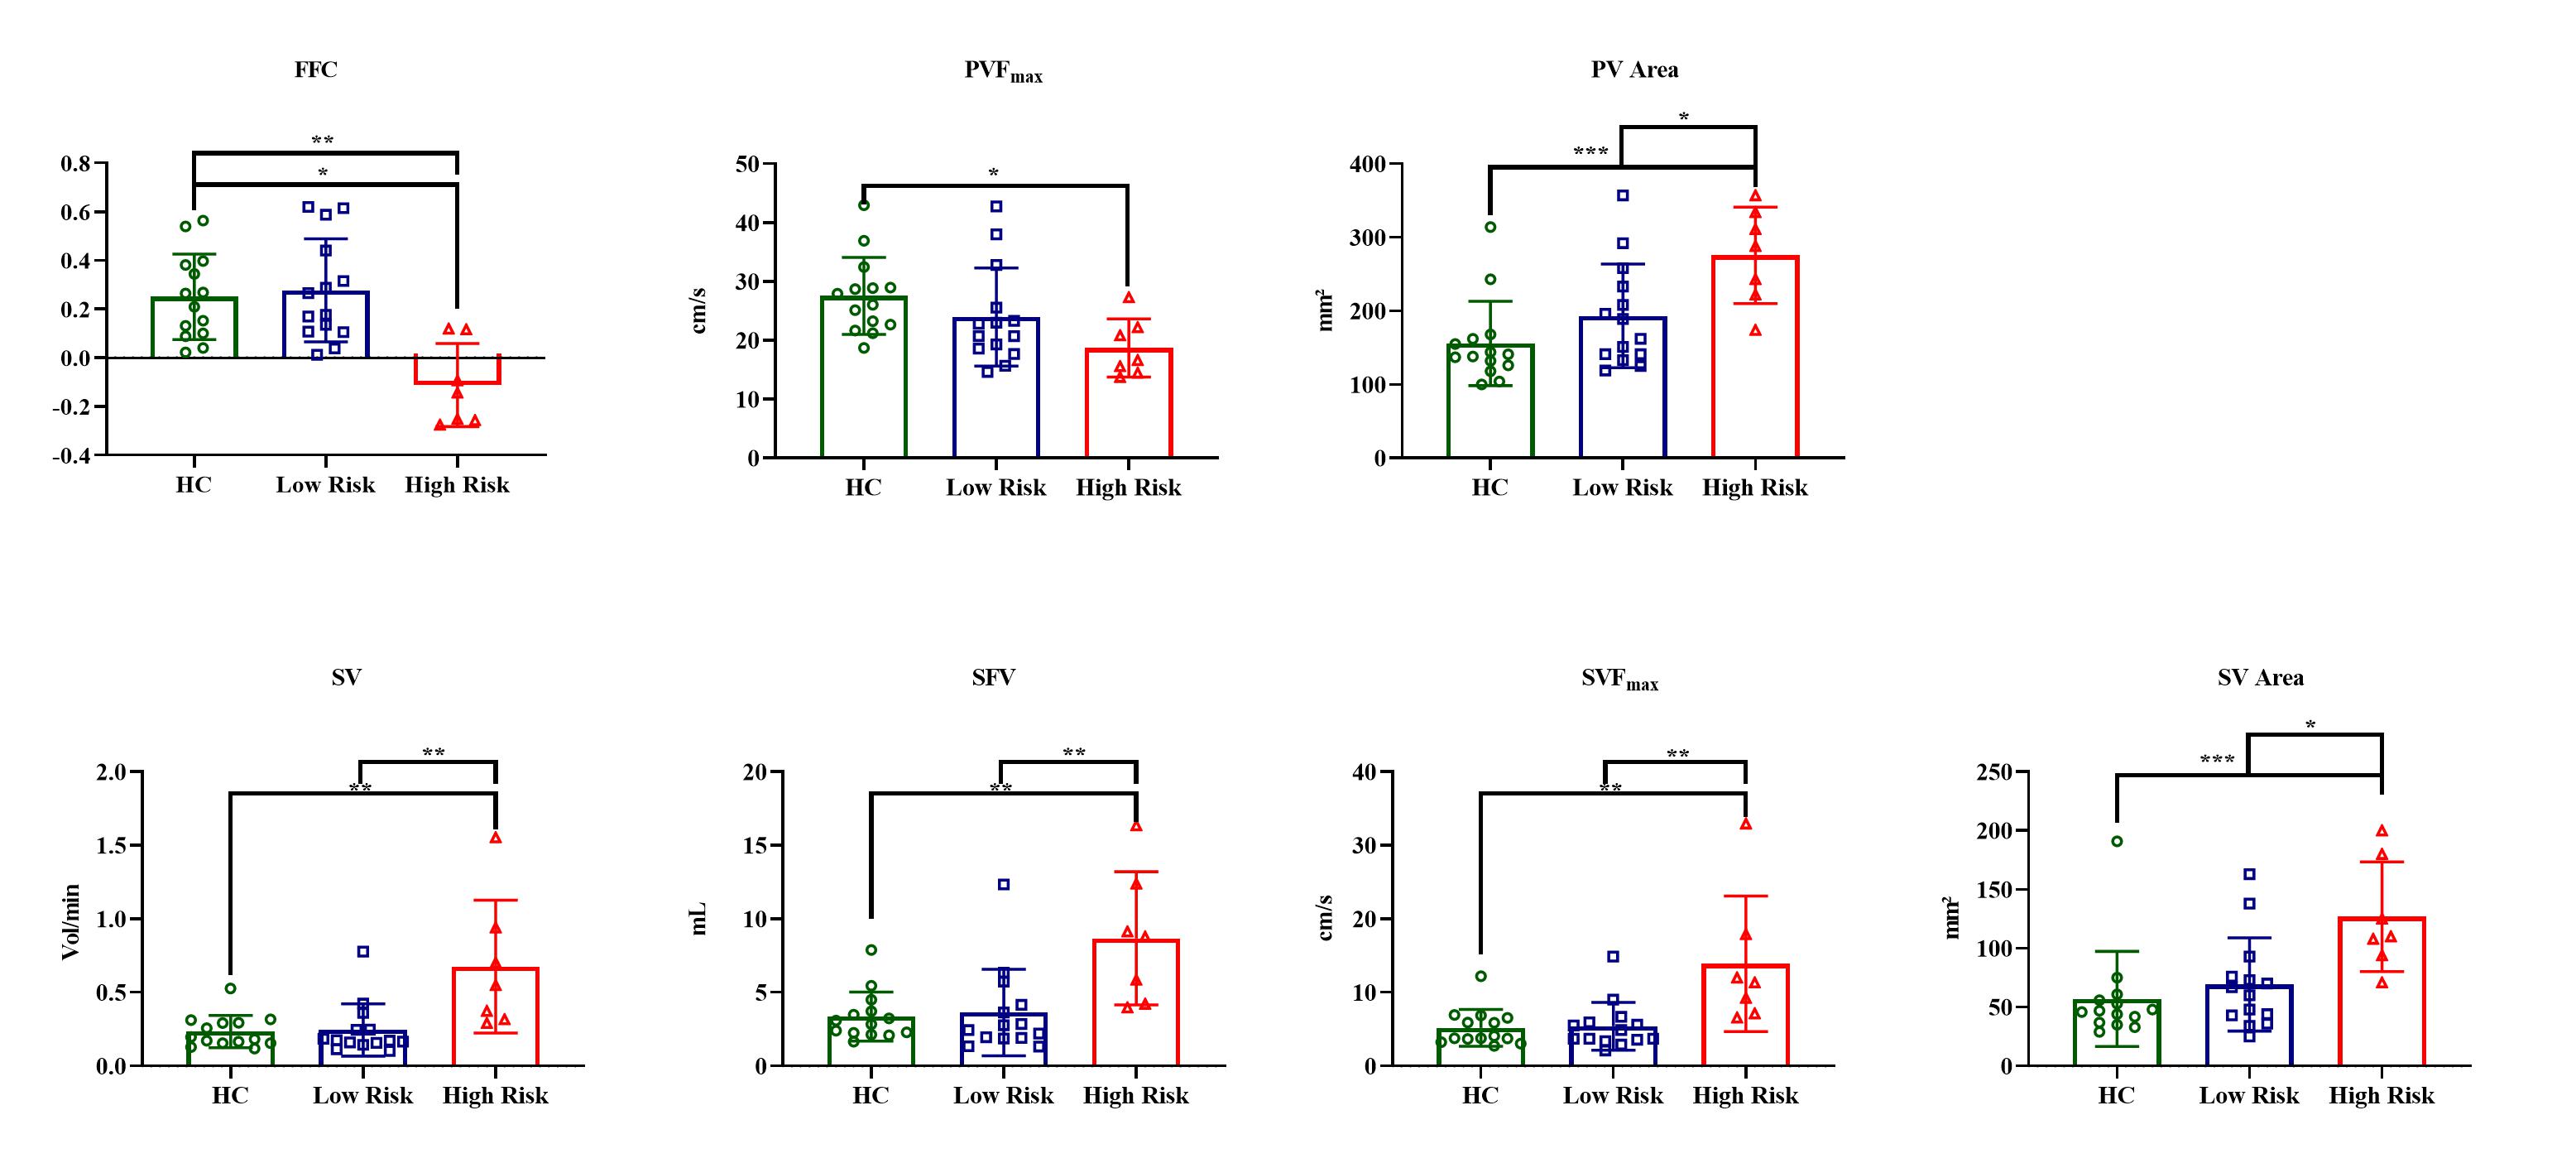
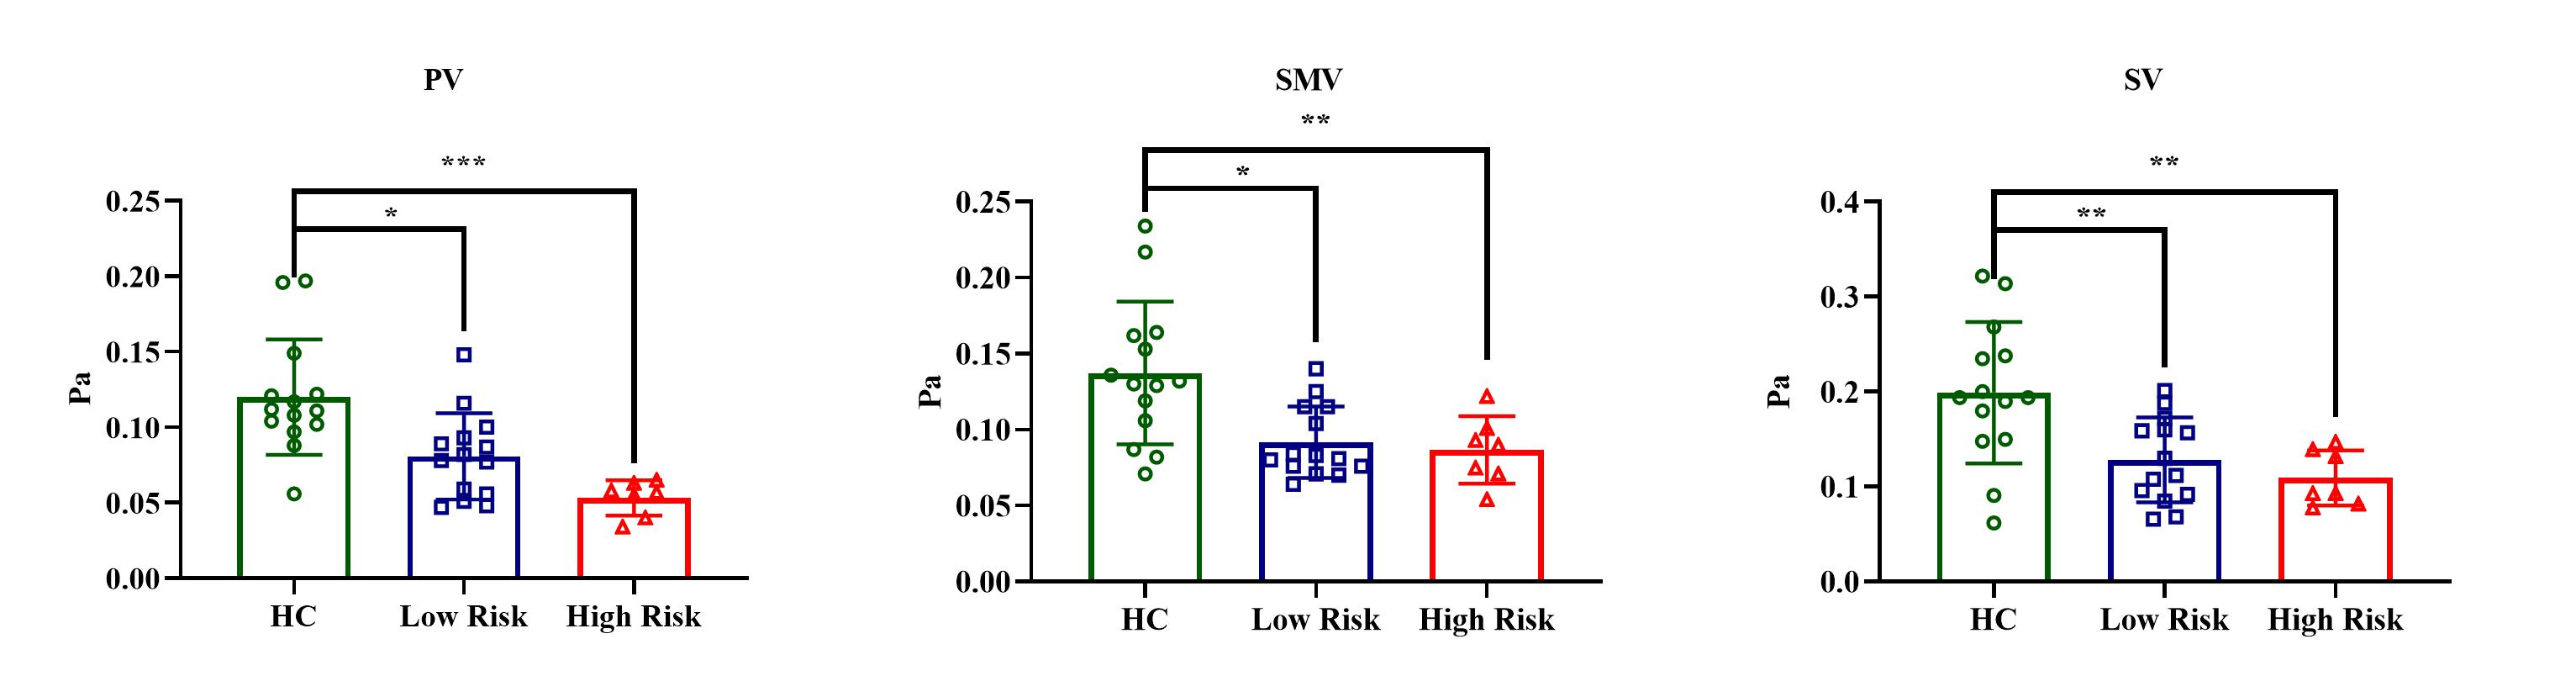
Figure 2 presents the typical 4D flow visualization results for the three groups. Further statistical analysis revealed no significant age or sex differences.The FFC was calculated, showing significant differences among the groups, with a marked decrease in patients with severe varices. Notably, the peak velocity of blood flow in the portal vein decreased with increasing portal pressure, while the portal vein cross-sectional area enlarged correspondingly (Figure 3). Differences were also evident in the splenic vein parameters among the groups. The splenic vein's blood flow volume, forward volume, peak flow, and cross-sectional area all increased progressively with rising portal pressure (Figure 3). Furthermore, the wall shear stress in the portal vein, superior mesenteric vein, and splenic vein differed significantly between the groups, decreasing as portal pressure increased (Figure 4).
The ROC curves indicated that FFC and maximum blood flow in the splenic vein had the largest area under the curve (AUC), at 0.918 and 0.923, respectively. The sensitivity and specificity for FFC were 71.4% and 100%, and for maximum blood flow in the splenic vein, 100% and 78.6%, respectively. Combining both parameters yielded an AUC of 0.949, with sensitivity and specificity of 85.7% and 92.9%, respectively (Figure 5).
Discussion and Conclusion
Our study indicates that 4D flow MRI can non-invasively quantify the degree of portal hypertension and diagnose the extent of esophageal gastric varices with considerable accuracy. Specifically, the fractional flow change (FFC) in the portal vein and maximum blood flow in the splenic vein may help differentiate between patients with high-risk varices and those with no or low-risk varices.Previous research has explored the use of serologic markers and liver/spleen stiffness measurements to assess portal pressure and the risk of variceal hemorrhage4-7. However, these models have limited predictive accuracy and do not account for factors such as collateral vessels. Therefore, direct measurement of blood flow changes in the portal circulation is valuable for predicting high-risk varices.
In conclusion, our study suggests that 4D flow MRI is a promising tool for the non-invasive evaluation of portal hypertension. The portal vein FFC and splenic vein maximum blood flow measurements are effective in stratifying esophageal and gastric varices and identifying those at high risk for hemorrhage with greater precision.
Acknowledgements
We would like to acknowledge the Guizhou senior innovative talent project (Grant numbers [QKHPTRC-GCC [2022]041-1]).References
1. de Franchis R, Bosch J, Garcia-Tsao G, Reiberger T, Ripoll C, Baveno VIIF. Baveno VII - Renewing consensus in portal hypertension. J Hepatol. 2022;76:959-974. doi: 10.1016/j.jhep.2021.12.022
2. Gralnek IM, Camus Duboc M, Garcia-Pagan JC, Fuccio L, Karstensen JG, Hucl T, Jovanovic I, Awadie H, Hernandez-Gea V, Tantau M, et al. Endoscopic diagnosis and management of esophagogastric variceal hemorrhage: European Society of Gastrointestinal Endoscopy (ESGE) Guideline. Endoscopy. 2022;54:1094-1120. doi: 10.1055/a-1939-4887
3. Motosugi U, Roldan-Alzate A, Bannas P, Said A, Kelly S, Zea R, Wieben O, Reeder SB. Four-dimensional Flow MRI as a Marker for Risk Stratification of Gastroesophageal Varices in Patients with Liver Cirrhosis. Radiology. 2019;290:101-107. doi: 10.1148/radiol.2018180230
4. Shin SU, Lee JM, Yu MH, Yoon JH, Han JK, Choi BI, Glaser KJ, Ehman RL. Prediction of esophageal varices in patients with cirrhosis: usefulness of three-dimensional MR elastography with echo-planar imaging technique. Radiology. 2014;272:143-153. doi: 10.1148/radiol.14130916
5. Sun HY, Lee JM, Han JK, Choi BI. Usefulness of MR elastography for predicting esophageal varices in cirrhotic patients. J Magn Reson Imaging. 2014;39:559-566. doi: 10.1002/jmri.24186
6. Morisaka H, Motosugi U, Ichikawa S, Sano K, Ichikawa T, Enomoto N. Association of splenic MR elastographic findings with gastroesophageal varices in patients with chronic liver disease. J Magn Reson Imaging. 2015;41:117-124. doi: 10.1002/jmri.24505
7. Kim BK, Han KH, Park JY, Ahn SH, Kim JK, Paik YH, Lee KS, Chon CY, Kim DY. A liver stiffness measurement-based, noninvasive prediction model for high-risk esophageal varices in B-viral liver cirrhosis. Am J Gastroenterol. 2010;105:1382-1390. doi: 10.1038/ajg.2009.750
Figures