0429
Longitudinal Changes of Hepatic Mechanical Properties in Patients with Early-Stage HCV Infection Treated with Direct-Acting Antiviral Agents1Radiology, Mayo Clinic, Rochester, MN, United States, 2Division of Gastroenterology and Hepatology, Mayo Clinic, Rochester, MN, United States
Synopsis
Keywords: Liver, Elastography, HCV, loss modulus, damping ratio
Motivation: While DAAs have significantly improved the treatment of HCV patients, some individuals still face relapse or progression. There is currently a deficiency in non-invasive and simple methods for effectively monitoring the longitudinal treatment effects.
Goal(s): To develop a reliable biomarker for detecting inflammatory response to DAA treatment in the early stages of HCV infection.
Approach: Longitudinal monitoring of changes in early-stage HCV patients after DAA treatment using multiparametric MRE.
Results: Multi-parameter MRE can detect HCV at the early stage and can monitor both short-term inflammatory response and long-term treatment effect of the liver in HCV patients after DAA treatment.
Impact: Developed a non-invasive biomarker for monitoring the efficacy of DAA treatment in early-stage HCV patients.
Introduction
Hepatitis C virus (HCV) remains a substantial global health challenge,1 despite the availability of direct-acting antiviral agents (DAAs). Even after effective treatment, individuals with a long history of chronic HCV infection remain at risk for liver disease complications, necessitating regular monitoring. Additionally, employing non-contrast imaging methods for quantitatively monitoring treatment in HCV could offer valuable insights applicable to other hepatitis therapeutic trials that involve anti-inflammatory response. Magnetic resonance elastography (MRE) is an advanced MR-based technique that measures tissue stiffness quantitatively by imaging propagating shear waves in the tissues.2 It has been utilized for staging liver fibrosis, predicting portal hypertension, as well as diagnosing and monitoring various chronic liver diseases. 3,4 The loss modulus (LM), the imaginary component of complex shear modulus, reflects tissue viscosity and shows promise in distinguishing early inflammation from fibrosis.5 Recent studies have also shown that MRE-assessed damping ratios can detect early necroinflammation before the onset of fibrosis.3 The goal of this study was to identify 3D MRE-assessed imaging biomarkers of inflammatory response to DAA treatment in early-stage HCV patients with no MRE-detectable clinically significant fibrosis.Method and materials
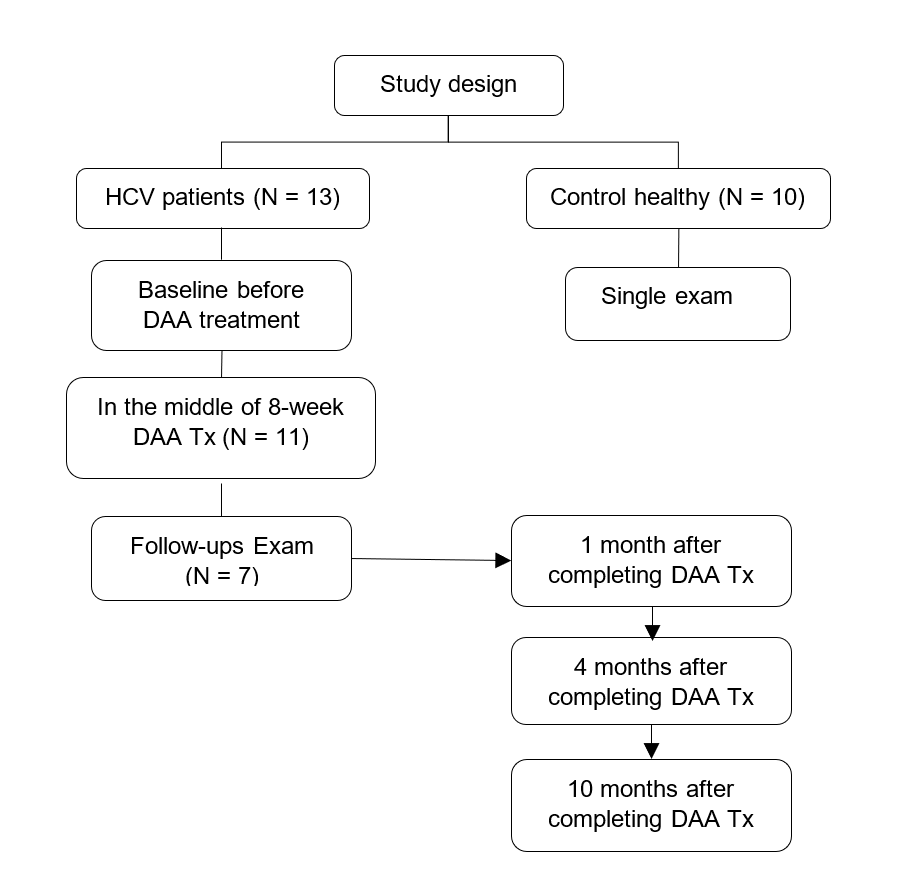
This study enrolled 23 participants in total, including 13 patients with early-stage HCV and 10 healthy controls with no known chronic liver diseases (Fig.1). All participants underwent 3D vector dual-frequency MRE (30-Hz & 60-Hz) on a whole-body 3.0T MR system (GE Healthcare, Milwaukee WI) at our institution. The HCV group was examined at baseline before treatment initiation; mid-DAA-Tx (intermediate evaluation between initiation and end of 8-week-DAA treatment); and 1, 4, and 10 months after completing DAA Tx. Mean shear stiffness, loss modulus, and damping ratio were measured. The independent sample t-test was used to compare the differences between the baseline of the HCV and Control group. Paired t-test was used to compare the differences between baseline and mid-DAA-Tx in the HCV group. Repeated measures analysis of variance was used to compare differences between baseline and each follow-up time point in the HCV group.Results
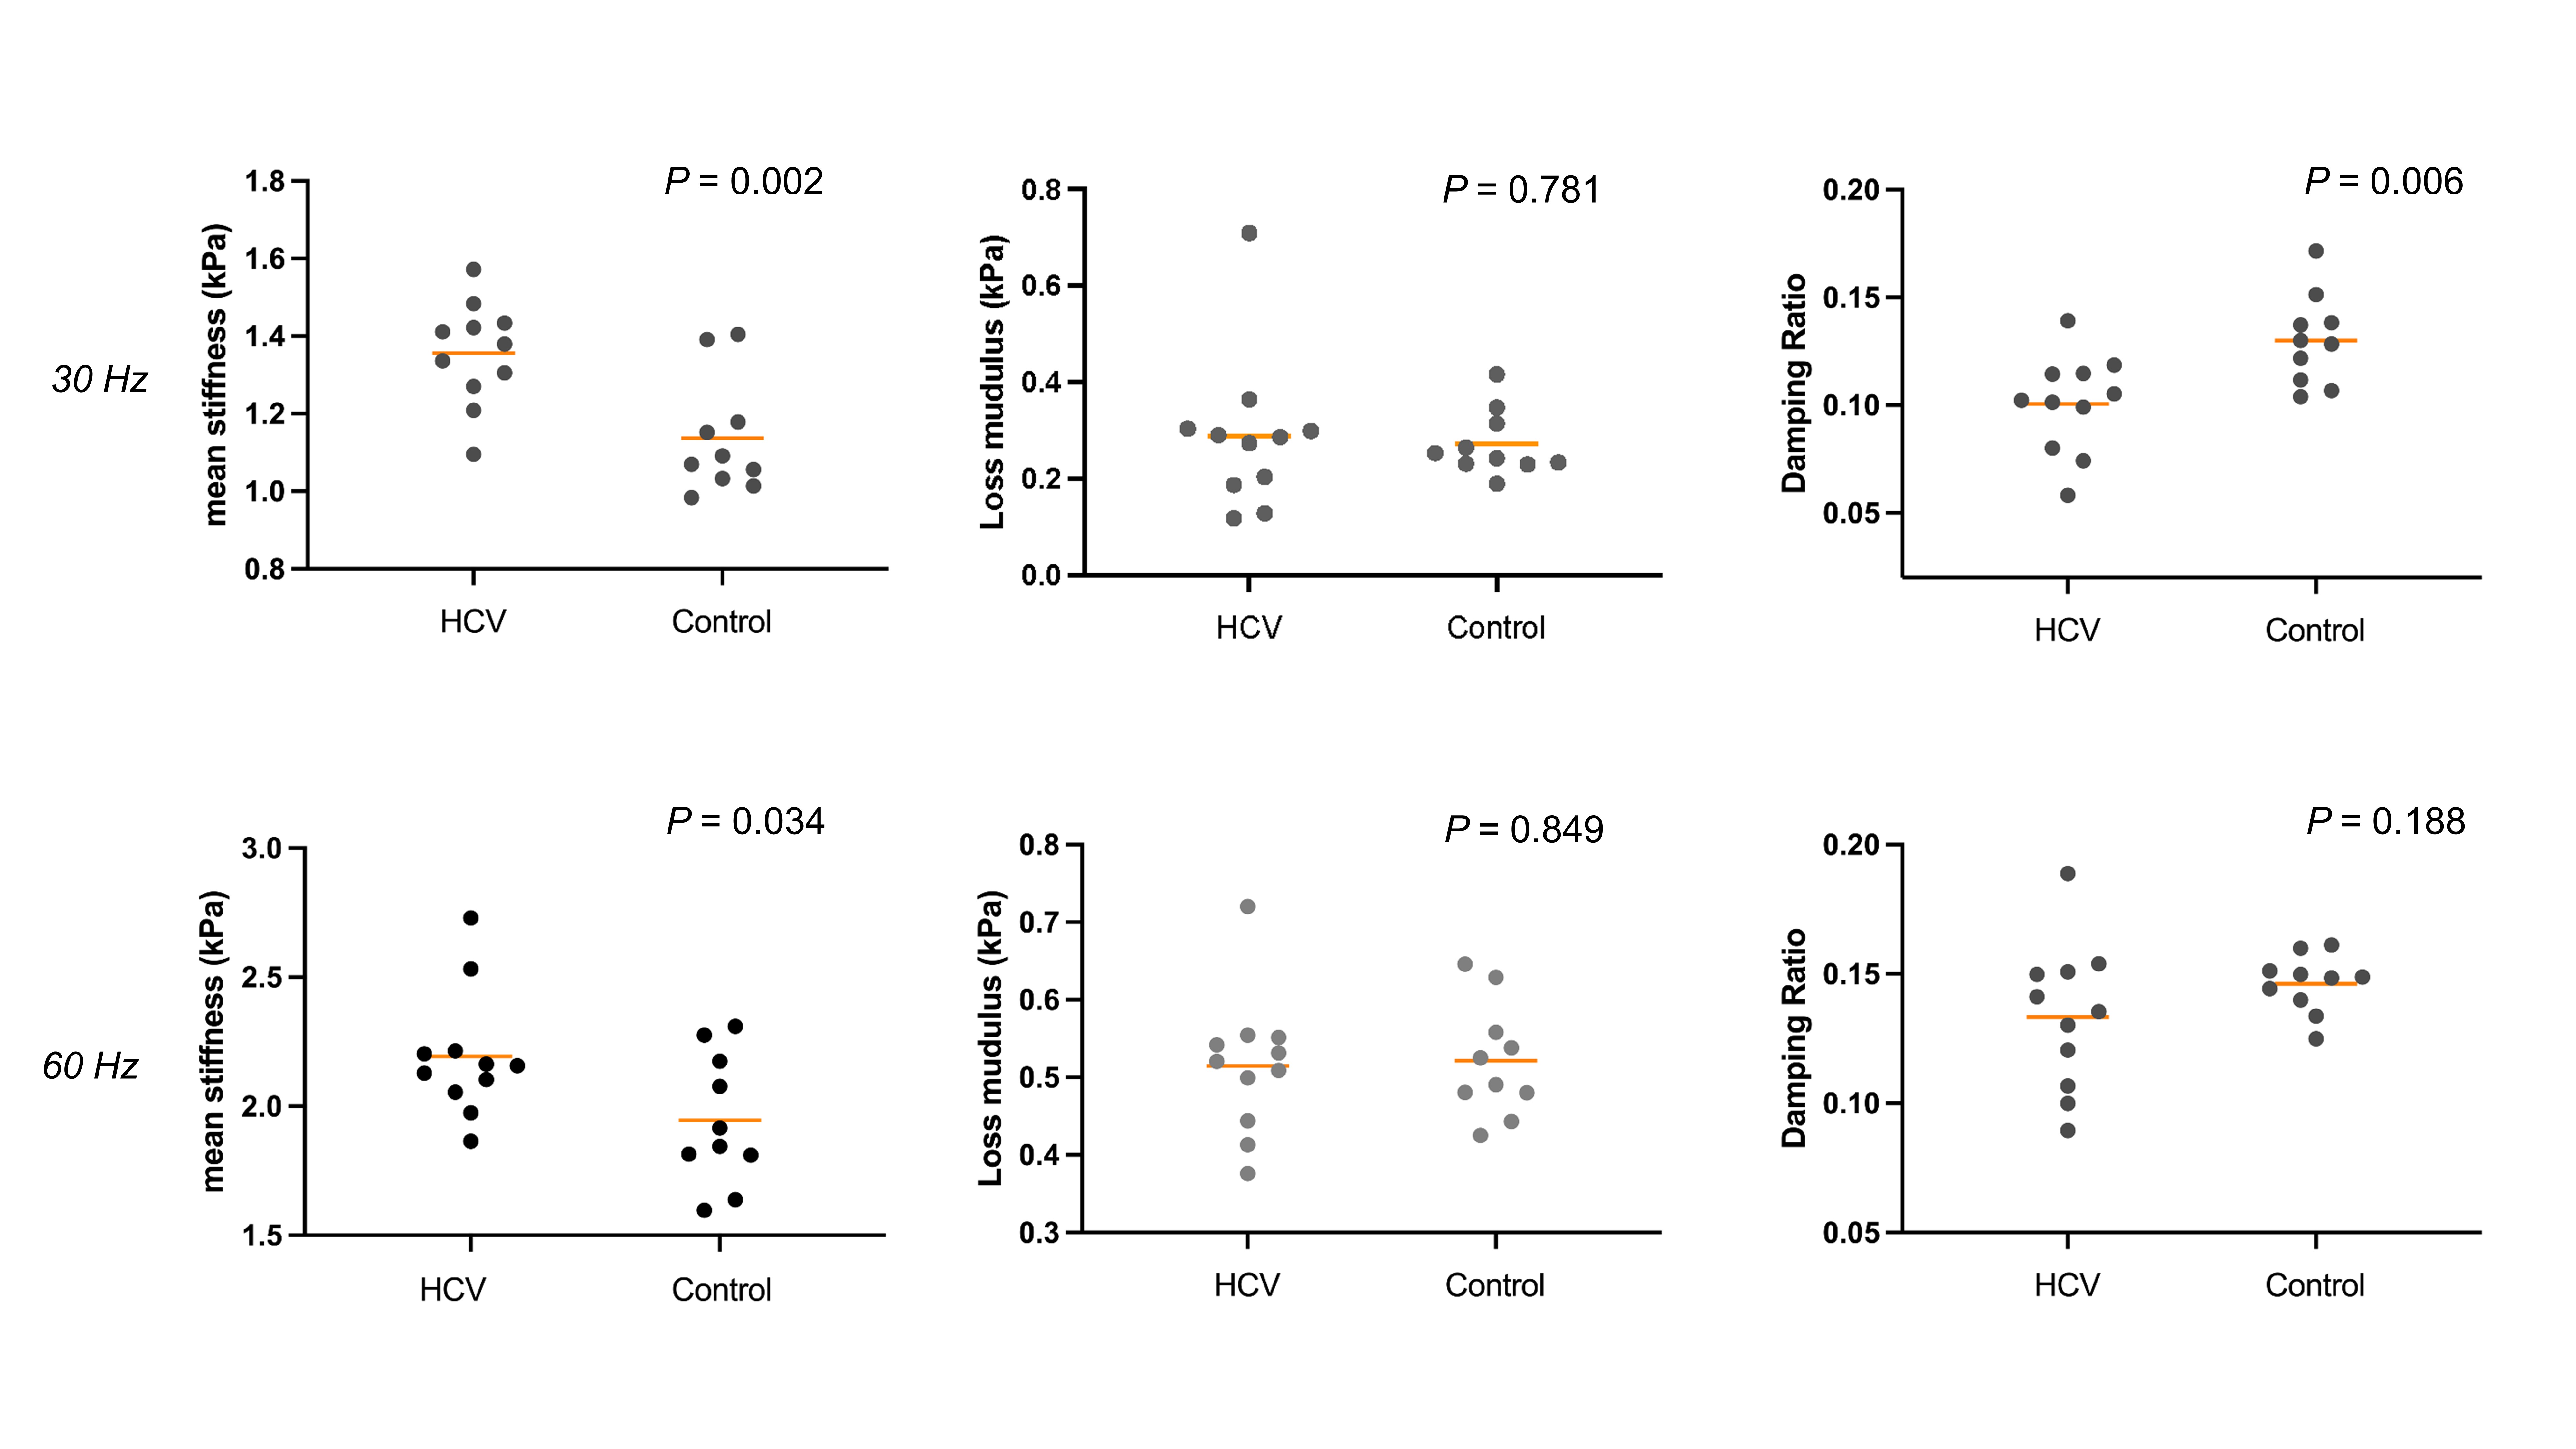
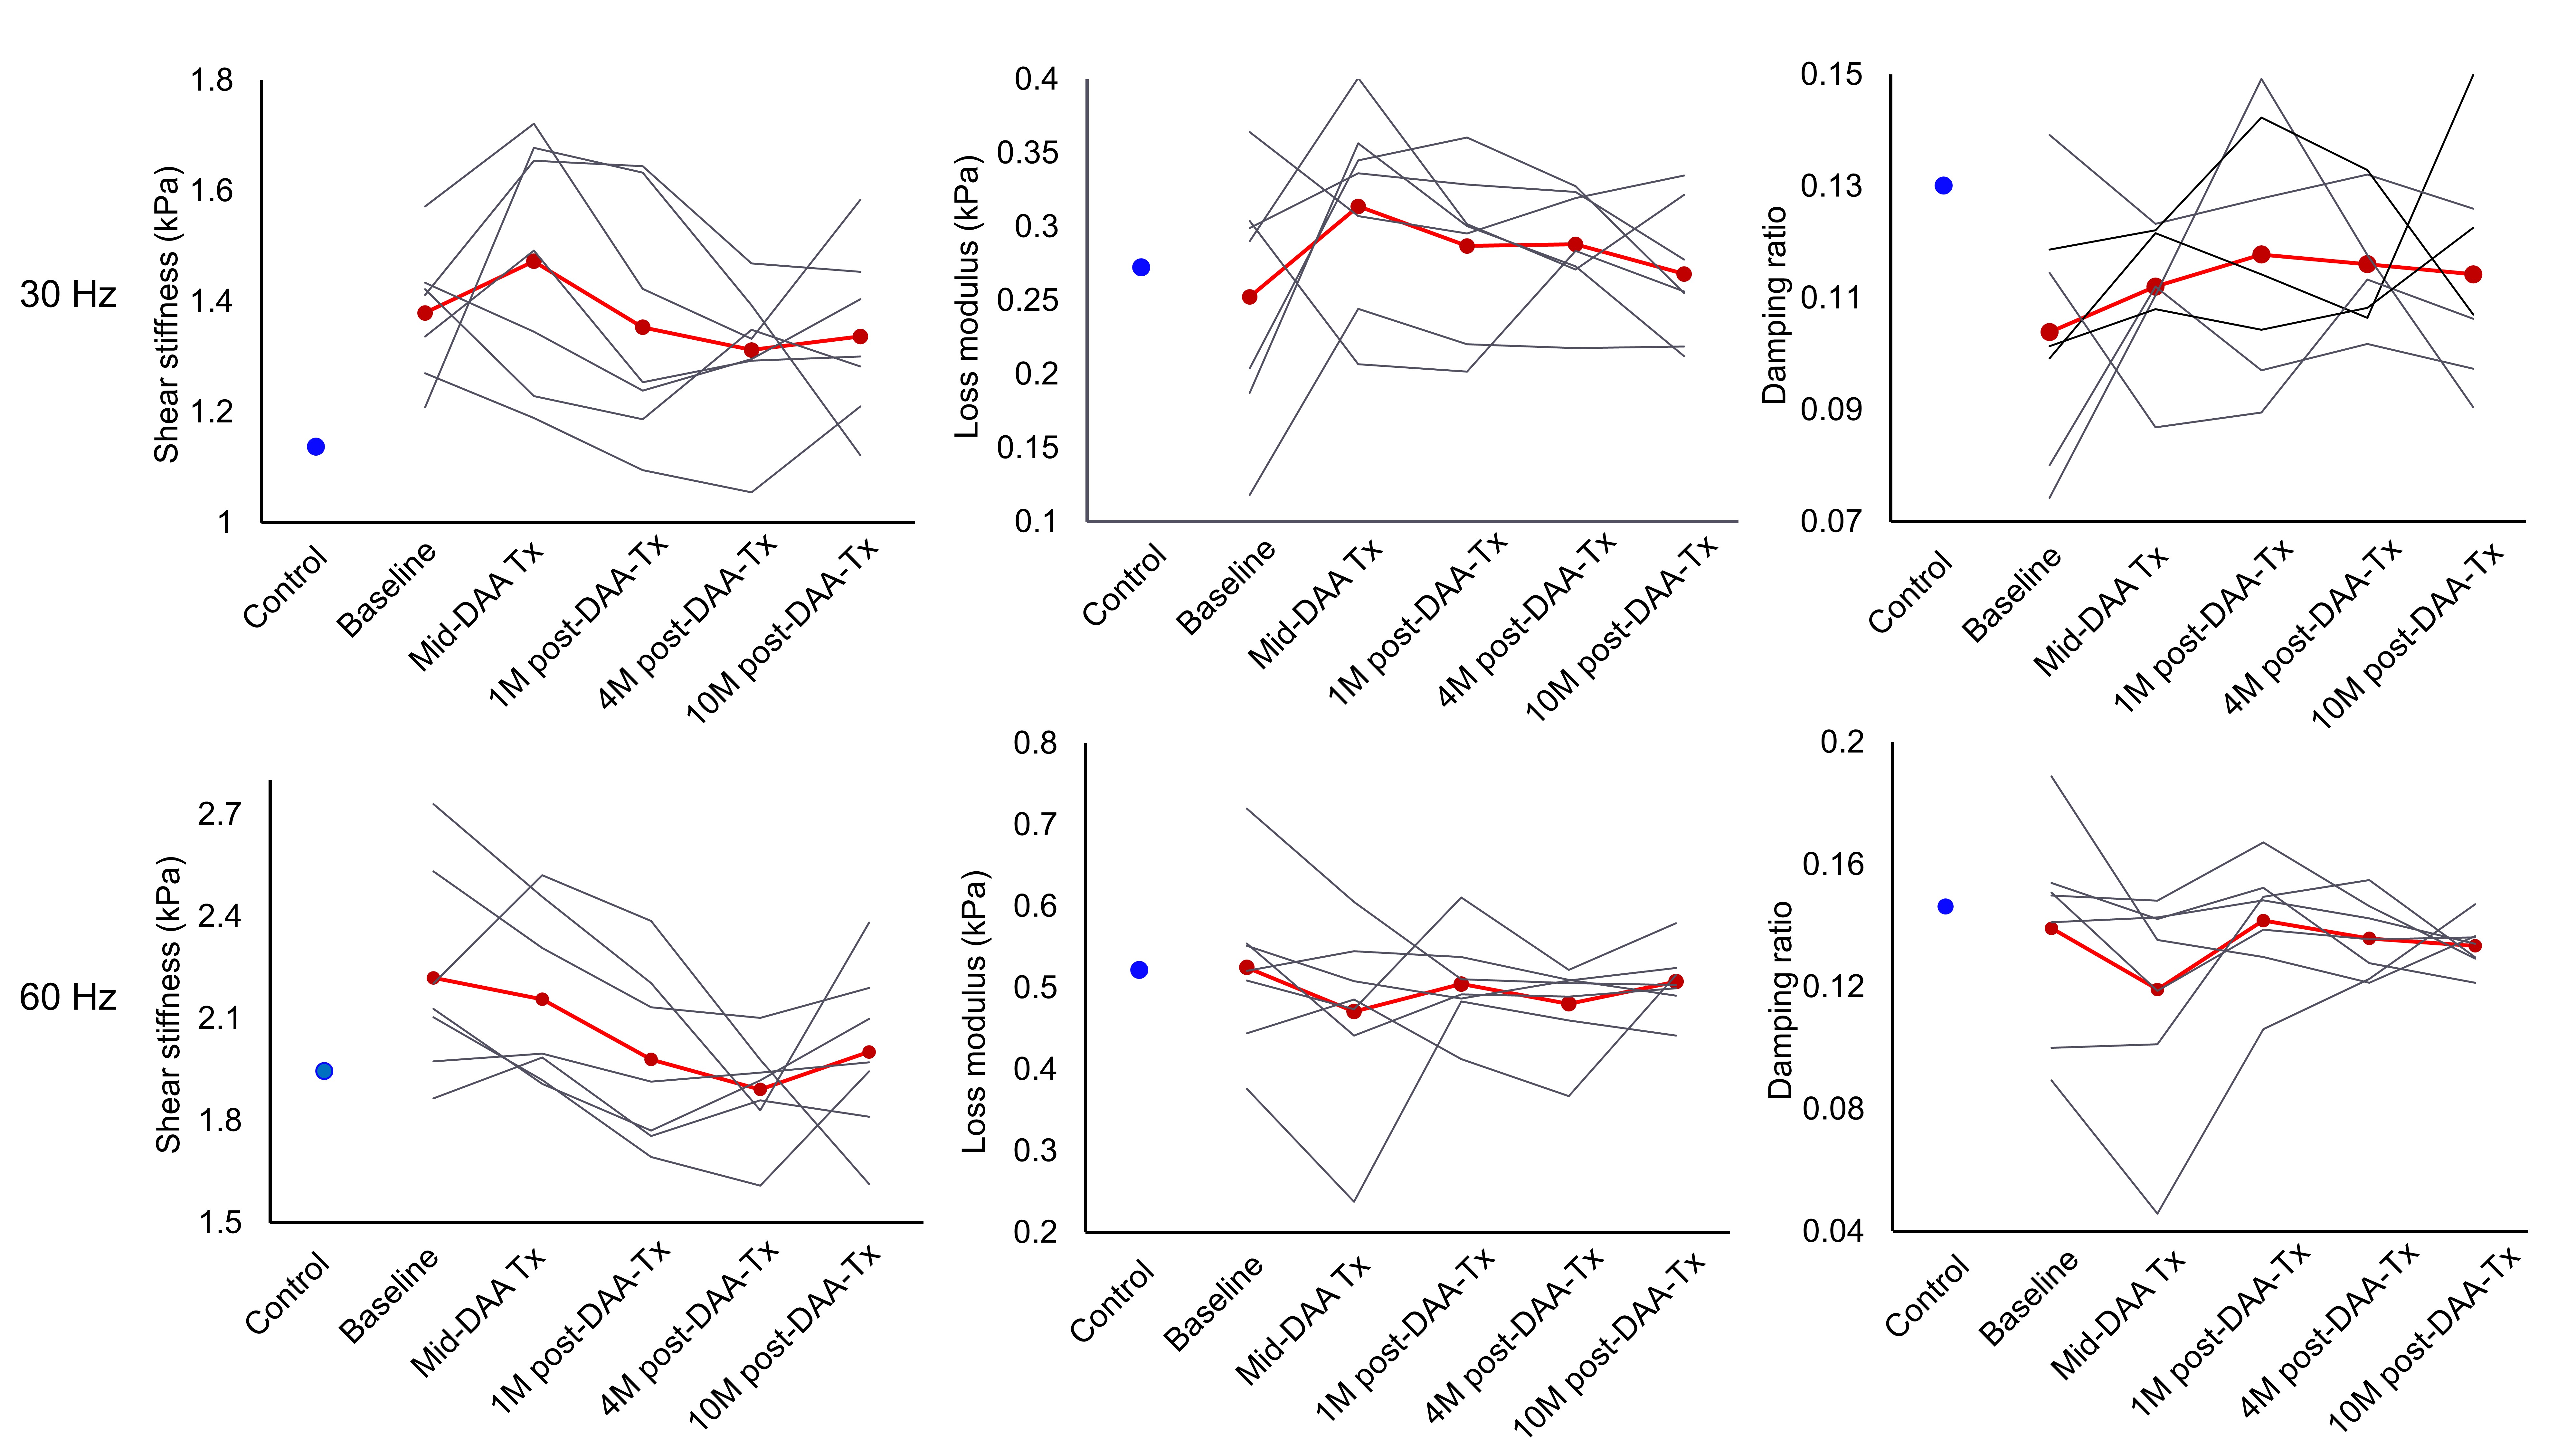
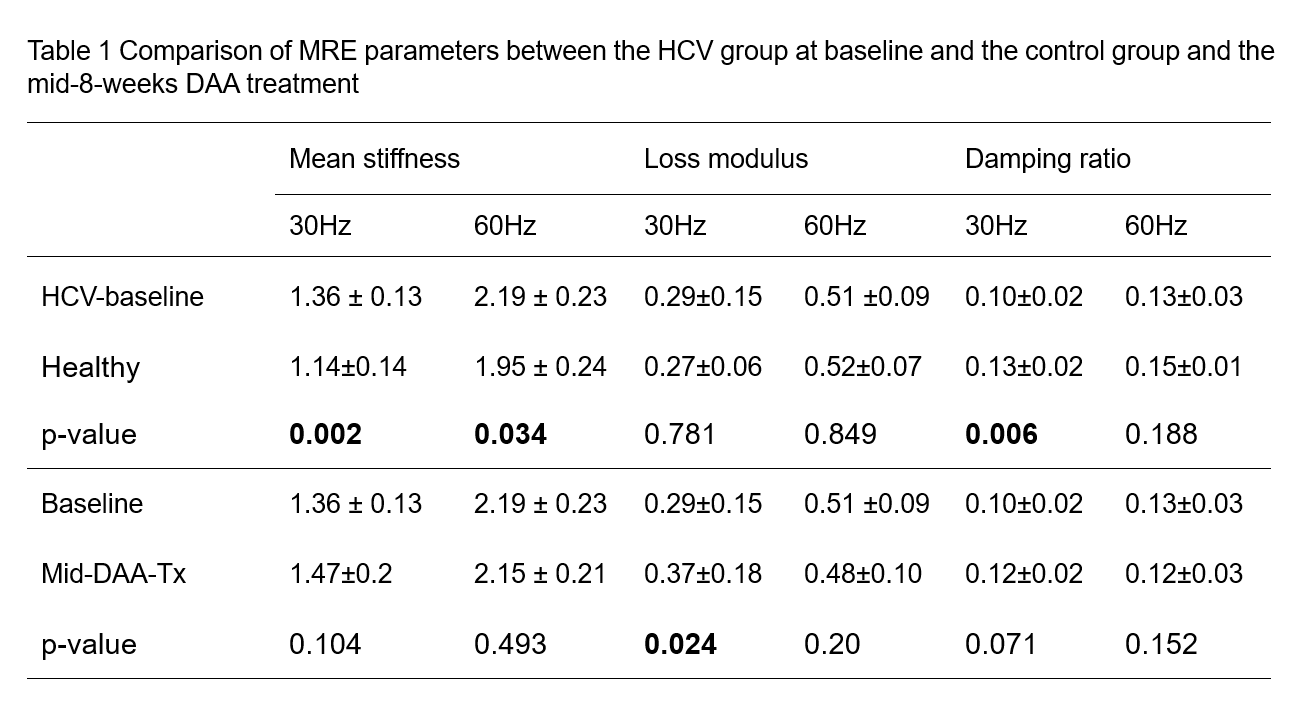
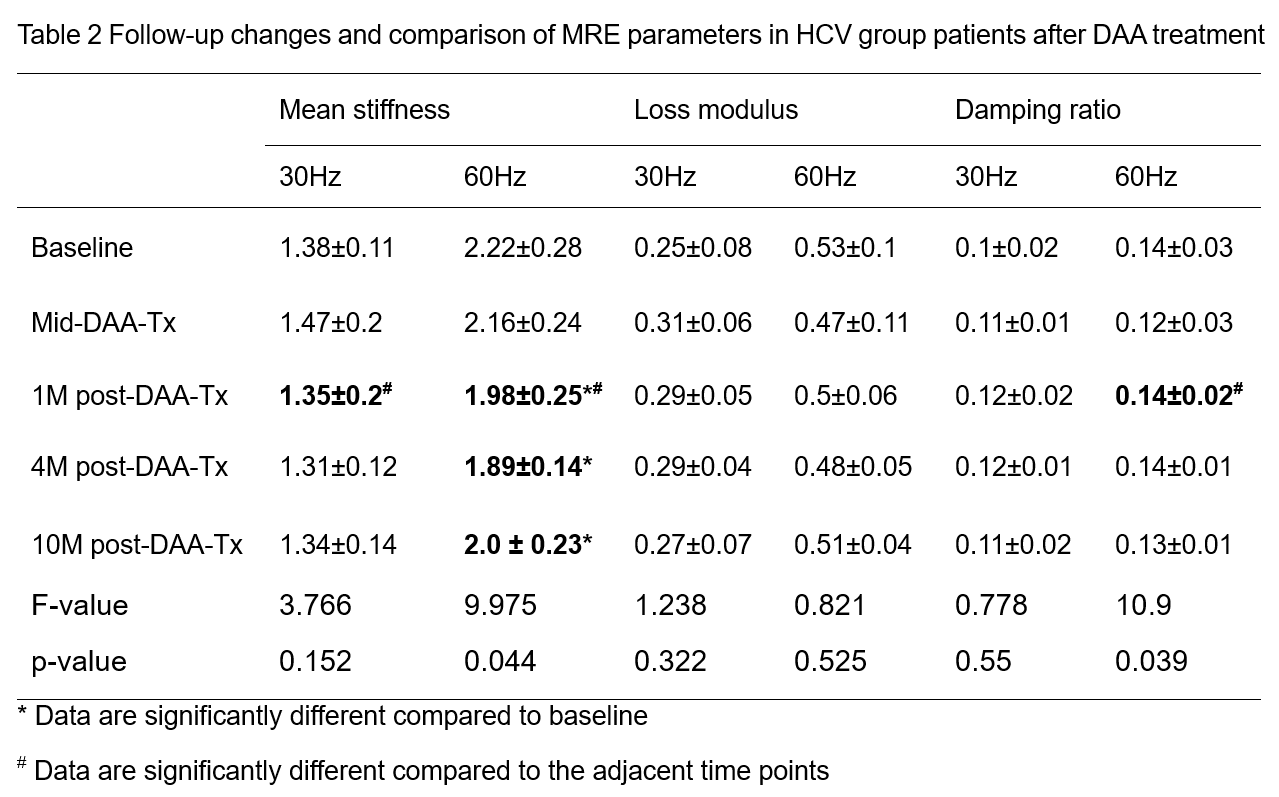
Two patients were excluded due to their clinically significant fibrosis.6 11 patients underwent baseline assessments and had a follow-up examination one month after initiation of DAA Tx (i.e., mid-DAA-Tx). Additionally, 7 patients completed a total of five follow-up examinations within 1 year after DAA treatment. Compared with the control group, the mean liver stiffness at both 30-Hz and 60-Hz was significantly augmented in the HCV group at baseline (both p<0.05); but damping ratio at 30-Hz was significantly lower in the HCV group at baseline (p < 0.05) (Table1; Fig.2). Comparing the baseline and mid-DAA-Tx time points in the HCV group, only the loss modulus at 30-Hz significantly increased (p < 0.05), and there were no statistically significant differences in other parameters (Table 1). Repeated measures analysis of variance showed that there was no difference in the mean stiffness at 60-Hz between baseline and the mid-DAA-Tx (p = 0.482), but significant reductions in measurements collected at 1 month, 4 months, and 10 months after completing DAA Tx. There is a significant decline between the mid-DAA-Tx and 1 month after completing DAA Tx. Similarly, the damping ratio at 60 Hz also significantly decreased between the mid-DAA-Tx and 1 month after completing DAA Tx (p < 0.05) (Table 2; Fig.3).Discussion
In the cross-sectional data analysis, we focused on early-stage HCV patients without MRE-detectable clinically significant fibrosis. Compared to healthy controls, multi-parameter MRE effectively detects early liver changes in HCV patients. Mean liver stiffness at 30-Hz and 60-Hz showed significant elevations at the baseline, suggesting potential tissue inflammation or even injury in the virus-infected liver. However, without corresponding liver biopsies at the baseline, it remains uncertain which specific pathophysiologic changes are associated with MRE-assessed mechanical properties. In the longitudinal data analysis, we observed that tissue viscoelasticity served as reliable biomarkers reflecting hepatic inflammatory response during the early stages of HCV, especially when subjected to successful antiviral treatment. Notably, most MRE-assessed mechanical parameters, with particular emphasis on the loss modulus,7 demonstrated a consistent pattern: a short-term rise around the mid-DAA-Tx timeframe, followed by a slow decline until 10 months post DAA-Tx completion. These results underline the potential of multi-parameter MRE as a valuable tool to track short-term inflammatory responses during therapy and to gauge the long-term enduring effects post-treatment.Conclusion
Our study underscored the potential of multi-parameter MRE in identifying early hepatic changes in HCV patients and suggests its efficacy in monitoring inflammatory responses during antiviral treatments. These findings pave the way for broader applications of MRE in gauging both short-term reactions and long-term treatment outcomes in the drug development for chronic liver diseases.Acknowledgements
noneReferences
1. World Health Organization. Guidelines for the Screening Care and Treatment of Persons with Chronic Hepatitis C Infection. Updated Version. Geneva, Switzerland: World Health Organization, 2016.
2. Manduca A, Oliphant TE, Dresner MA, et al. Magnetic resonance elastography: non-invasive mapping of tissue elasticity. Med Image Anal. 2001; 5:237-254.
3. Shi Y, Qi YF, Lan GY, et al. Three-dimensional MR Elastography Depicts Liver Inflammation, Fibrosis, and Portal Hypertension in Chronic Hepatitis B or C. Radiology. 2021; 301:154-162.
4. Allen AM, Shah VH, Therneau TM, et al. The Role of Three-Dimensional Magnetic Resonance Elastography in the Diagnosis of Nonalcoholic Steatohepatitis in Obese Patients Undergoing Bariatric Surgery. Hepatology. 2020; 71:510-521.
5. Yin M, Glaser KJ, Manduca A, et al. Distinguishing between Hepatic Inflammation and Fibrosis with MR Elastography. Radiology. 2017; 284:694-705.
6. Singh S, Venkatesh SK, Wang Z, et al. Diagnostic performance of magnetic resonance elastography in staging liver fibrosis: a systematic review and meta-analysis of individual participant data. Clin Gastroenterol Hepatol. 2015 Mar;13(3):440-451.e6.
7. Li J, Allen AM, Shah VH, et al. Longitudinal Changes in MR Elastography-based Biomarkers in Obese Patients Treated with Bariatric Surgery. Clin Gastroenterol Hepatol. 2023;21:220-222 e223.
Figures