0428
3D Fat/Water-Separated Liver T1 Mapping: A Study on the Influence of Fat and Repeatability1Bernard and Irene Schwartz Center for Biomedical Imaging, Department of Radiology, New York University Grossman School of Medicine, New York, NY, United States, 2Center for Advanced Imaging Innovation and Research (CAI2R), Department of Radiology, New York University Grossman School of Medicine, New York, NY, United States, 3Biomedical Engineering and Imaging Institute, Icahn School of Medicine at Mount Sinai, New York, NY, United States
Synopsis
Keywords: Liver, Fat
Motivation: Liver T1 estimation depends on the echo time when fat signal is not eliminated, implying that traditional T1 mapping techniques without considering the presence of fat may lack accuracy and reliability.
Goal(s): This study investigated the correlation between liver T1 and fat fraction in 3D free-breathing Fat/Water-Separated T1 mapping and the repeatability of water-specific T1 measurement.
Approach: Fifty subjects were recruited and four of them were scanned multiple times to assess the repeatability.
Results: Difference between the first echo T1 and water-specific T1 shows strong correlation with the fat fraction, while water-specific T1 shows little correlation. Water-specific T1 mapping is repeatable.
Impact: This study aims to investigate the influence of fat on liver T1 in 3D free-breathing T1 mapping. This can help understand how the fat affects liver T1 mapping and facilitate the development new techniques for estimating water-specific liver T1.
Introduction
There has been a long-standing interest in using MR T1 mapping to assess chronic liver diseases and focal liver lesions. However, the clinical value of T1 mapping remains unestablished to date. One of the primary reasons for this is the influence of various confounding factors on liver T1 mapping that impact reproducibility, repeatability, and clinical translation. Notably, several recent studies have shown the significant impact of fat as a profound confounding factor in liver T1 mapping[1-3]. These findings highlight the strong dependence of liver T1 estimation on the echo time (TE) when fat signal is not eliminated. This suggests that traditional T1 mapping techniques without considering the presence of fat might lack accuracy and reliability. The main objective of this study was to explore the correlation between liver T1 and proton density fat fraction (PDFF) in a recently developed 3D free-breathing multi-echo T1 mapping technique. In addition, we also assessed the repeatability of this technique for water-specific liver T1 mapping.Methods
Human Subject EnrollmentA total of 50 subjects including 38 healthy volunteers and 12 patients with clinically confirmed non-alcoholic fatty liver disease (NAFLD) were recruited for T1 mapping using a 3D free-breathing multi-echo T1 mapping technique based on Golden-angle Radial Sparse Parallel MRI (GraspT1-Dixon)[4]. All imaging studies were performed on a clinical 3T MRI scanner (Skyra or Prisma, Siemens Healthineers). Four subjects (two healthy volunteers, two NAFLD patients) were scanned at least three times on different dates for testing the repeatability.
Data Acquisition and Image Reconstruction
GraspT1-Dixon employs inversion-recovery(IR)-prepared 3D golden-angle stack-of-stars sampling with iterative low-rank subspace reconstruction with spatiotemporal sparsity constraints [4]–[6]. During data acquisition, the IR preparation is periodically applied, followed by multi-echo acquisition at different inversion times (TIs). This enables simultaneous estimation of PDFF, R2*, and water-specific T1 from a single acquisition. The imaging parameters are TR/TE1/ΔTE/TE6=10.8/1.4/1.6/9.4ms, flip angle = 5°, slice sptial resolution=1.4x1.4x6mm3, number of slices=16, number of echoes=6, number of TIs per TR=48ms, number of IR preparations=24, slice partial Fourier factor=75%, and total acquisition time (TA)=4min36sec.
Averaged images from all TIs are used for magnetic field map estimation using graph-cut method[7] followed by water/fat separation[8] to generate water image for each TI to calculate water-specific T1. PDFF is calculated using bias corrected formula[9]. For comparison, T1 mapping is also calculated for each echo without water-fat separation.
Image Analyses
Circle-shaped ROIs, each containing 300 voxels, are drawn on 2 slices at the middle of liver for each subject while avoiding major liver vessels. Linear regression analysis is performed with MATLAB 2021a. The repeated scans are not included in the regression analysis.
Results
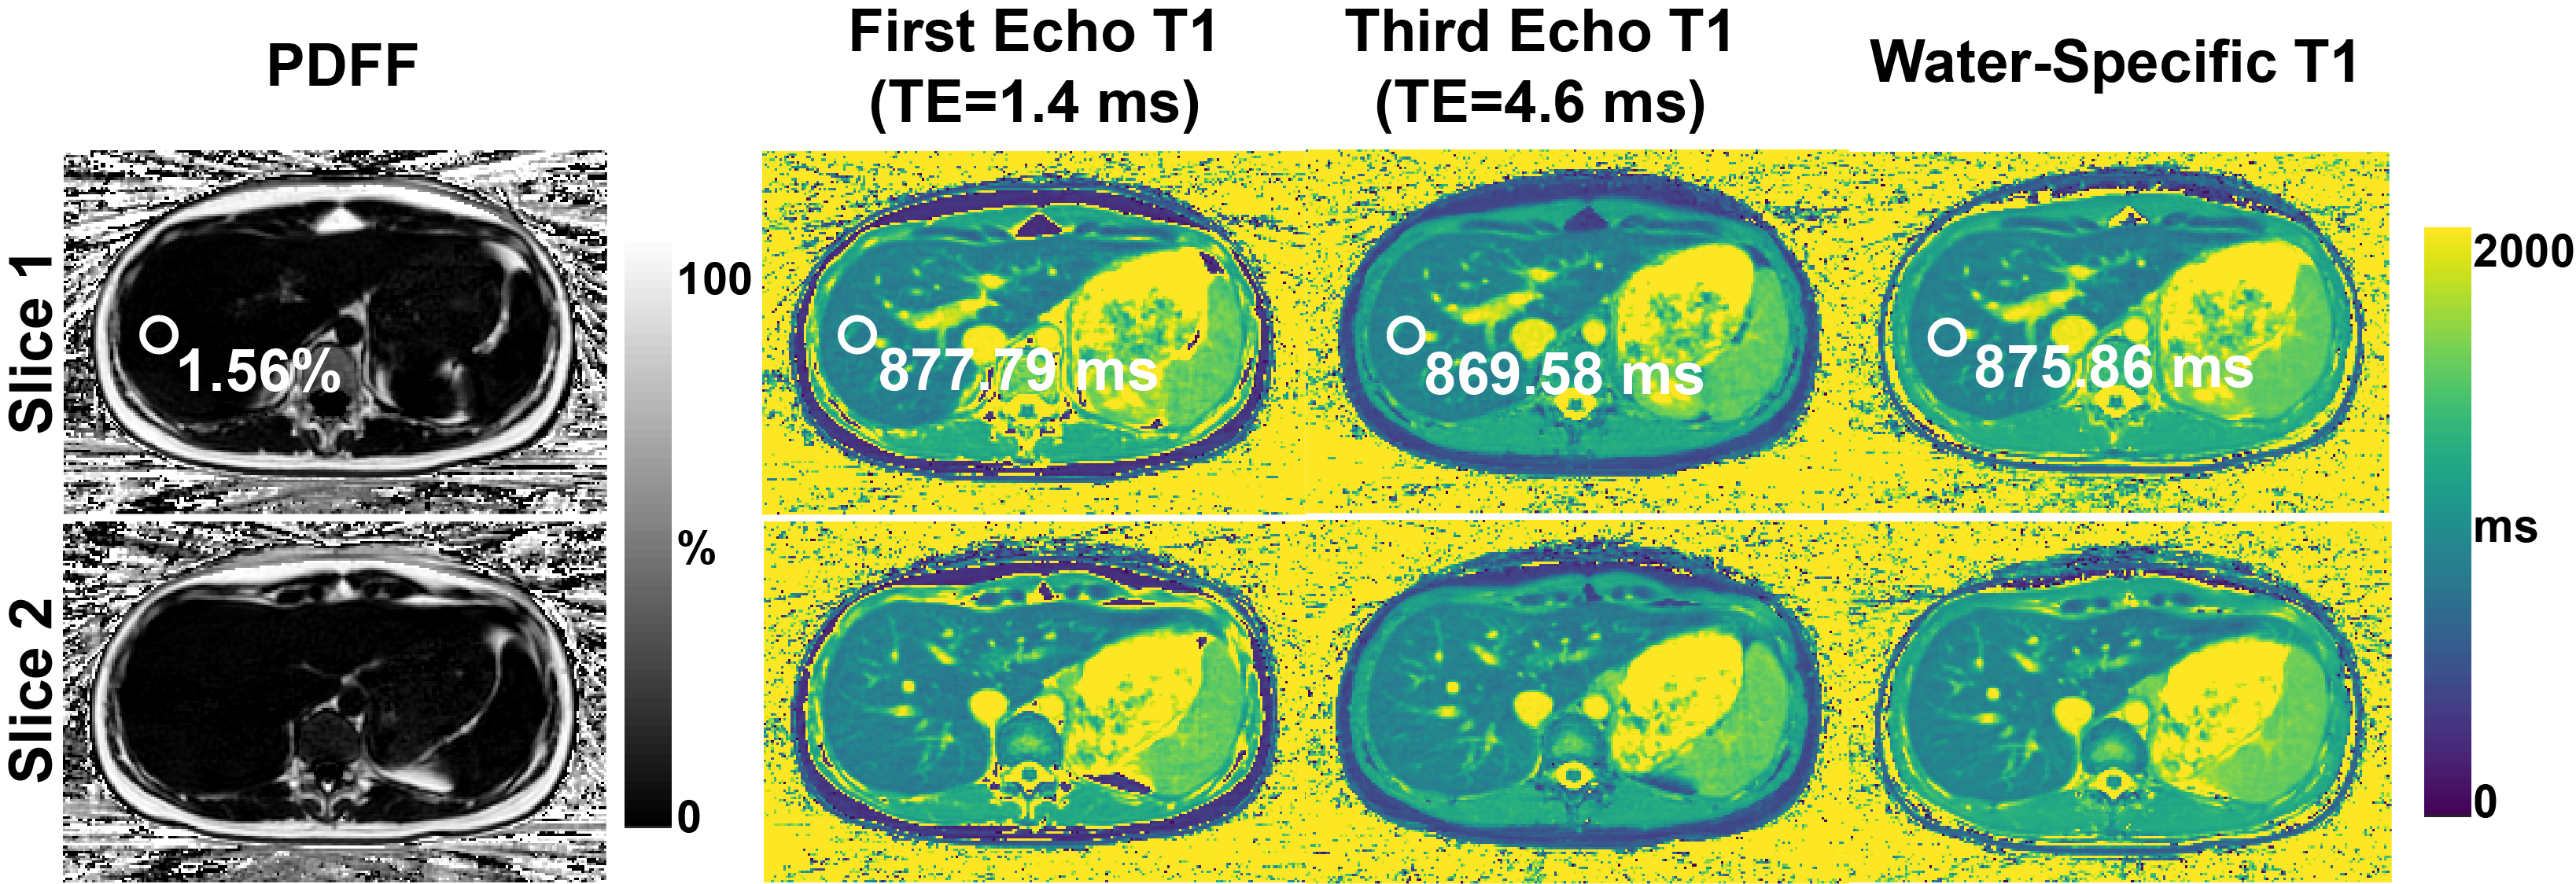
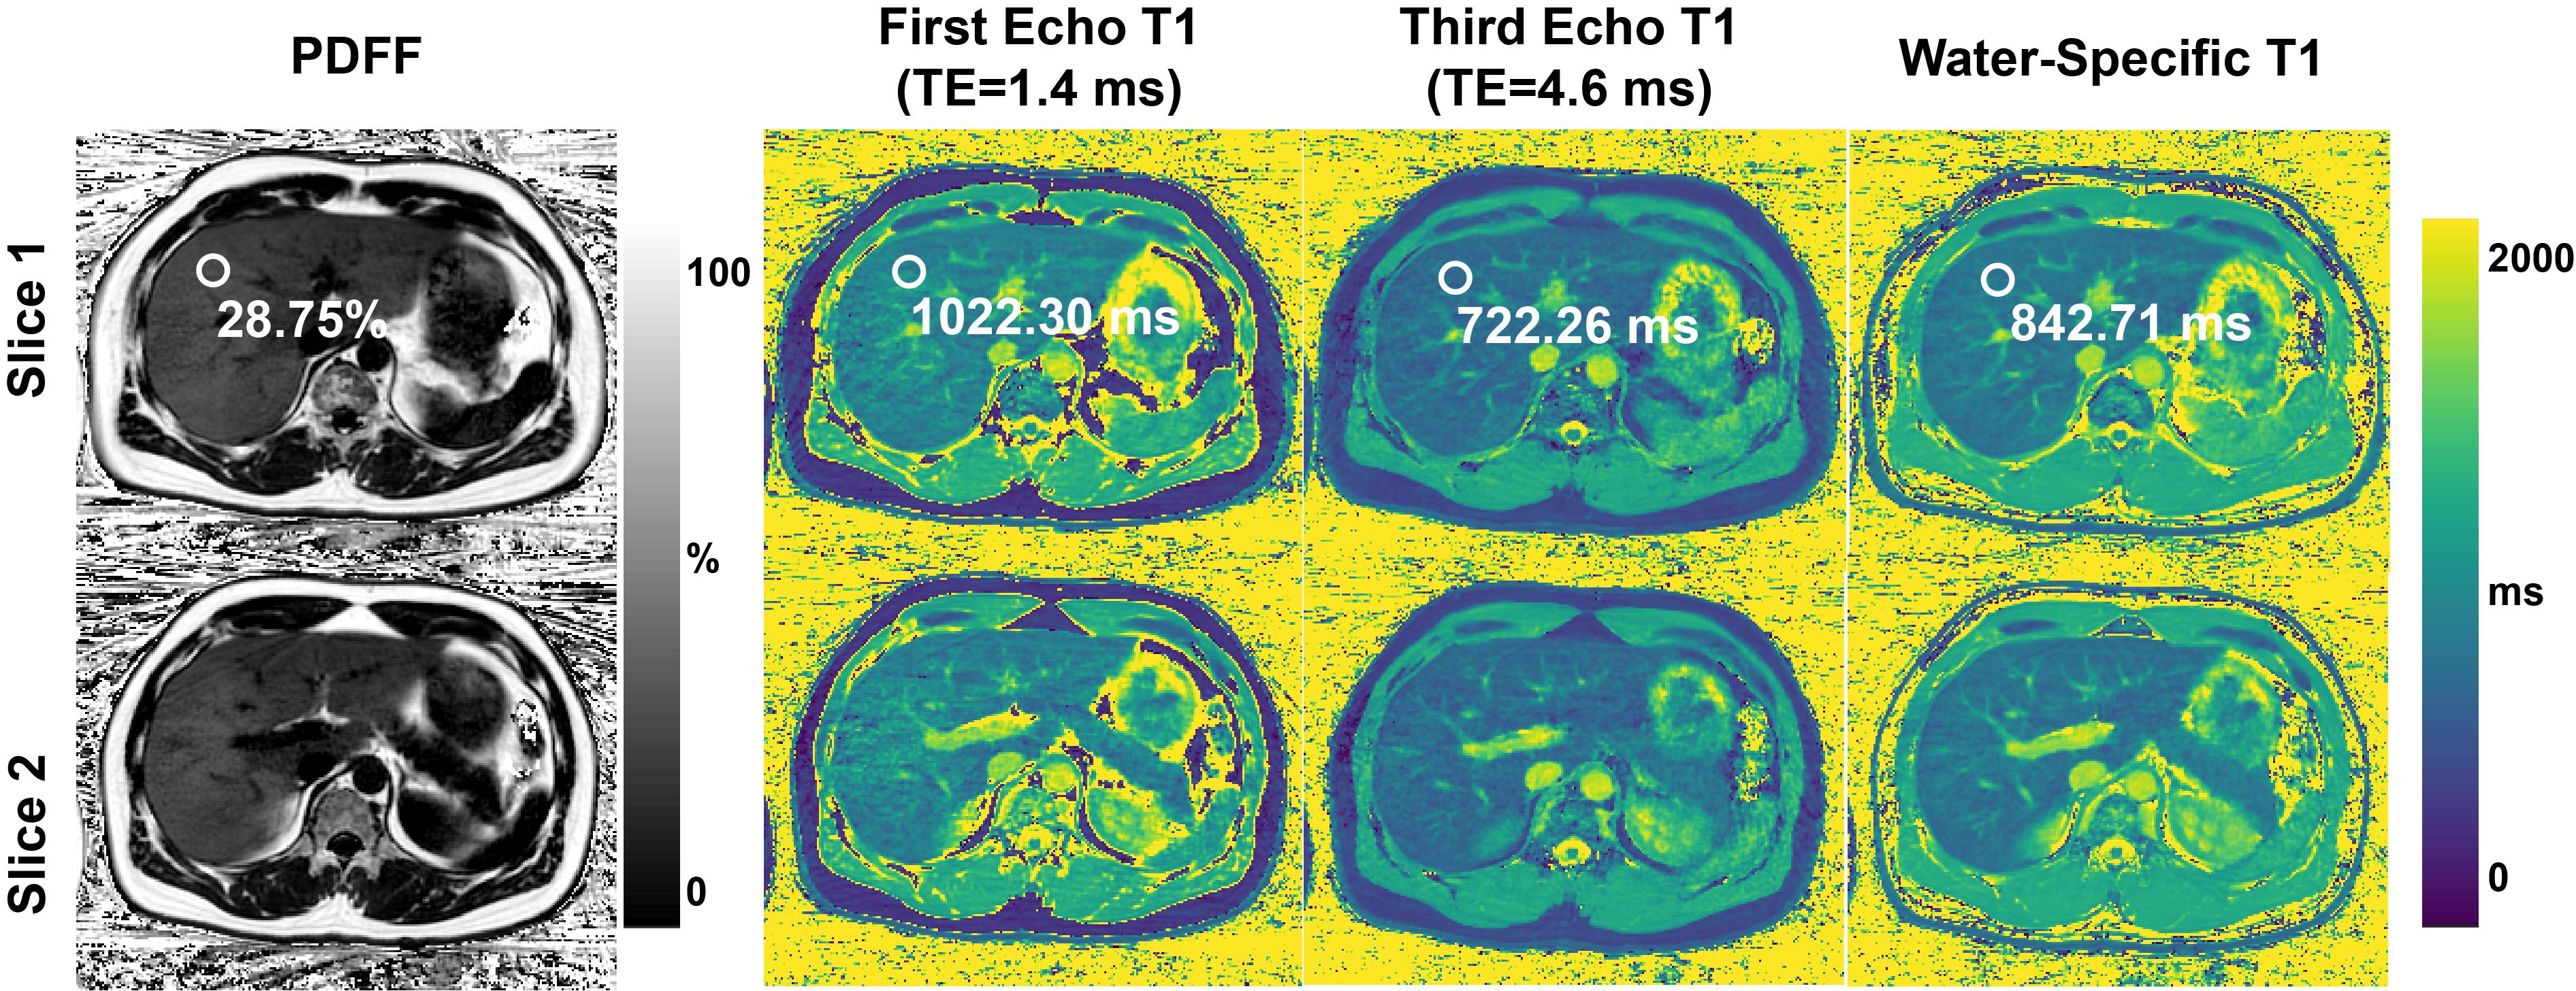
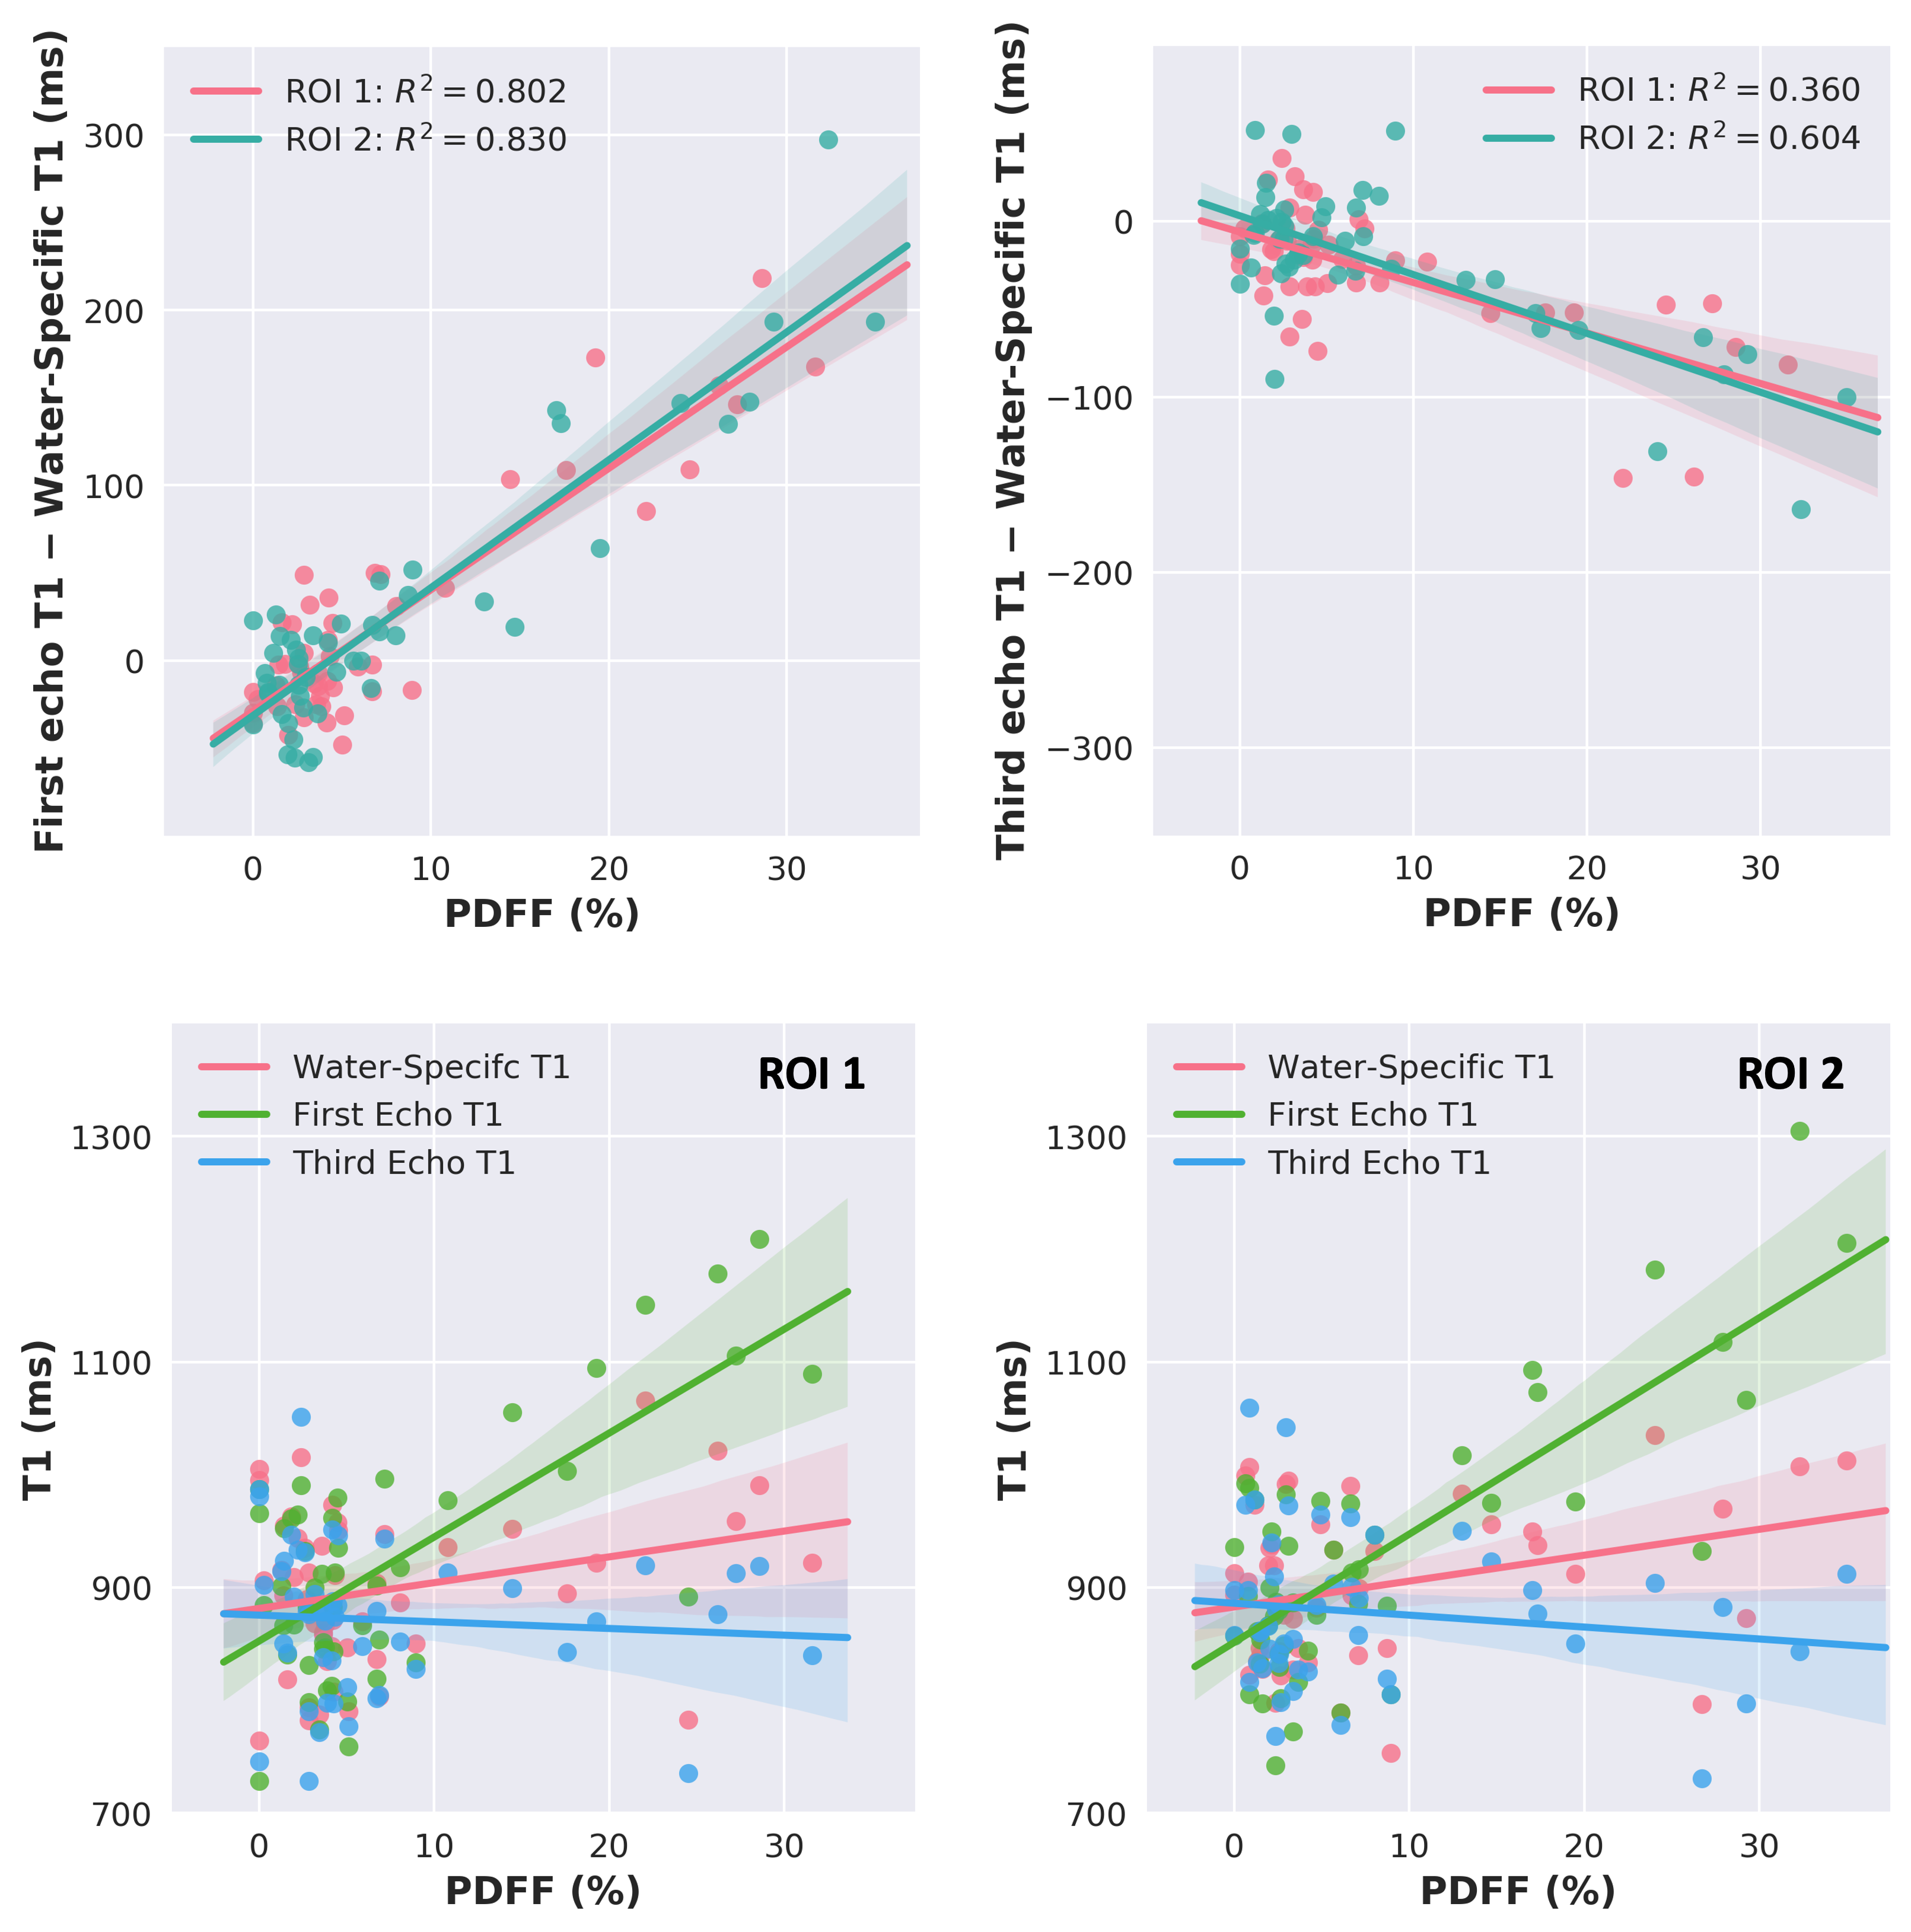
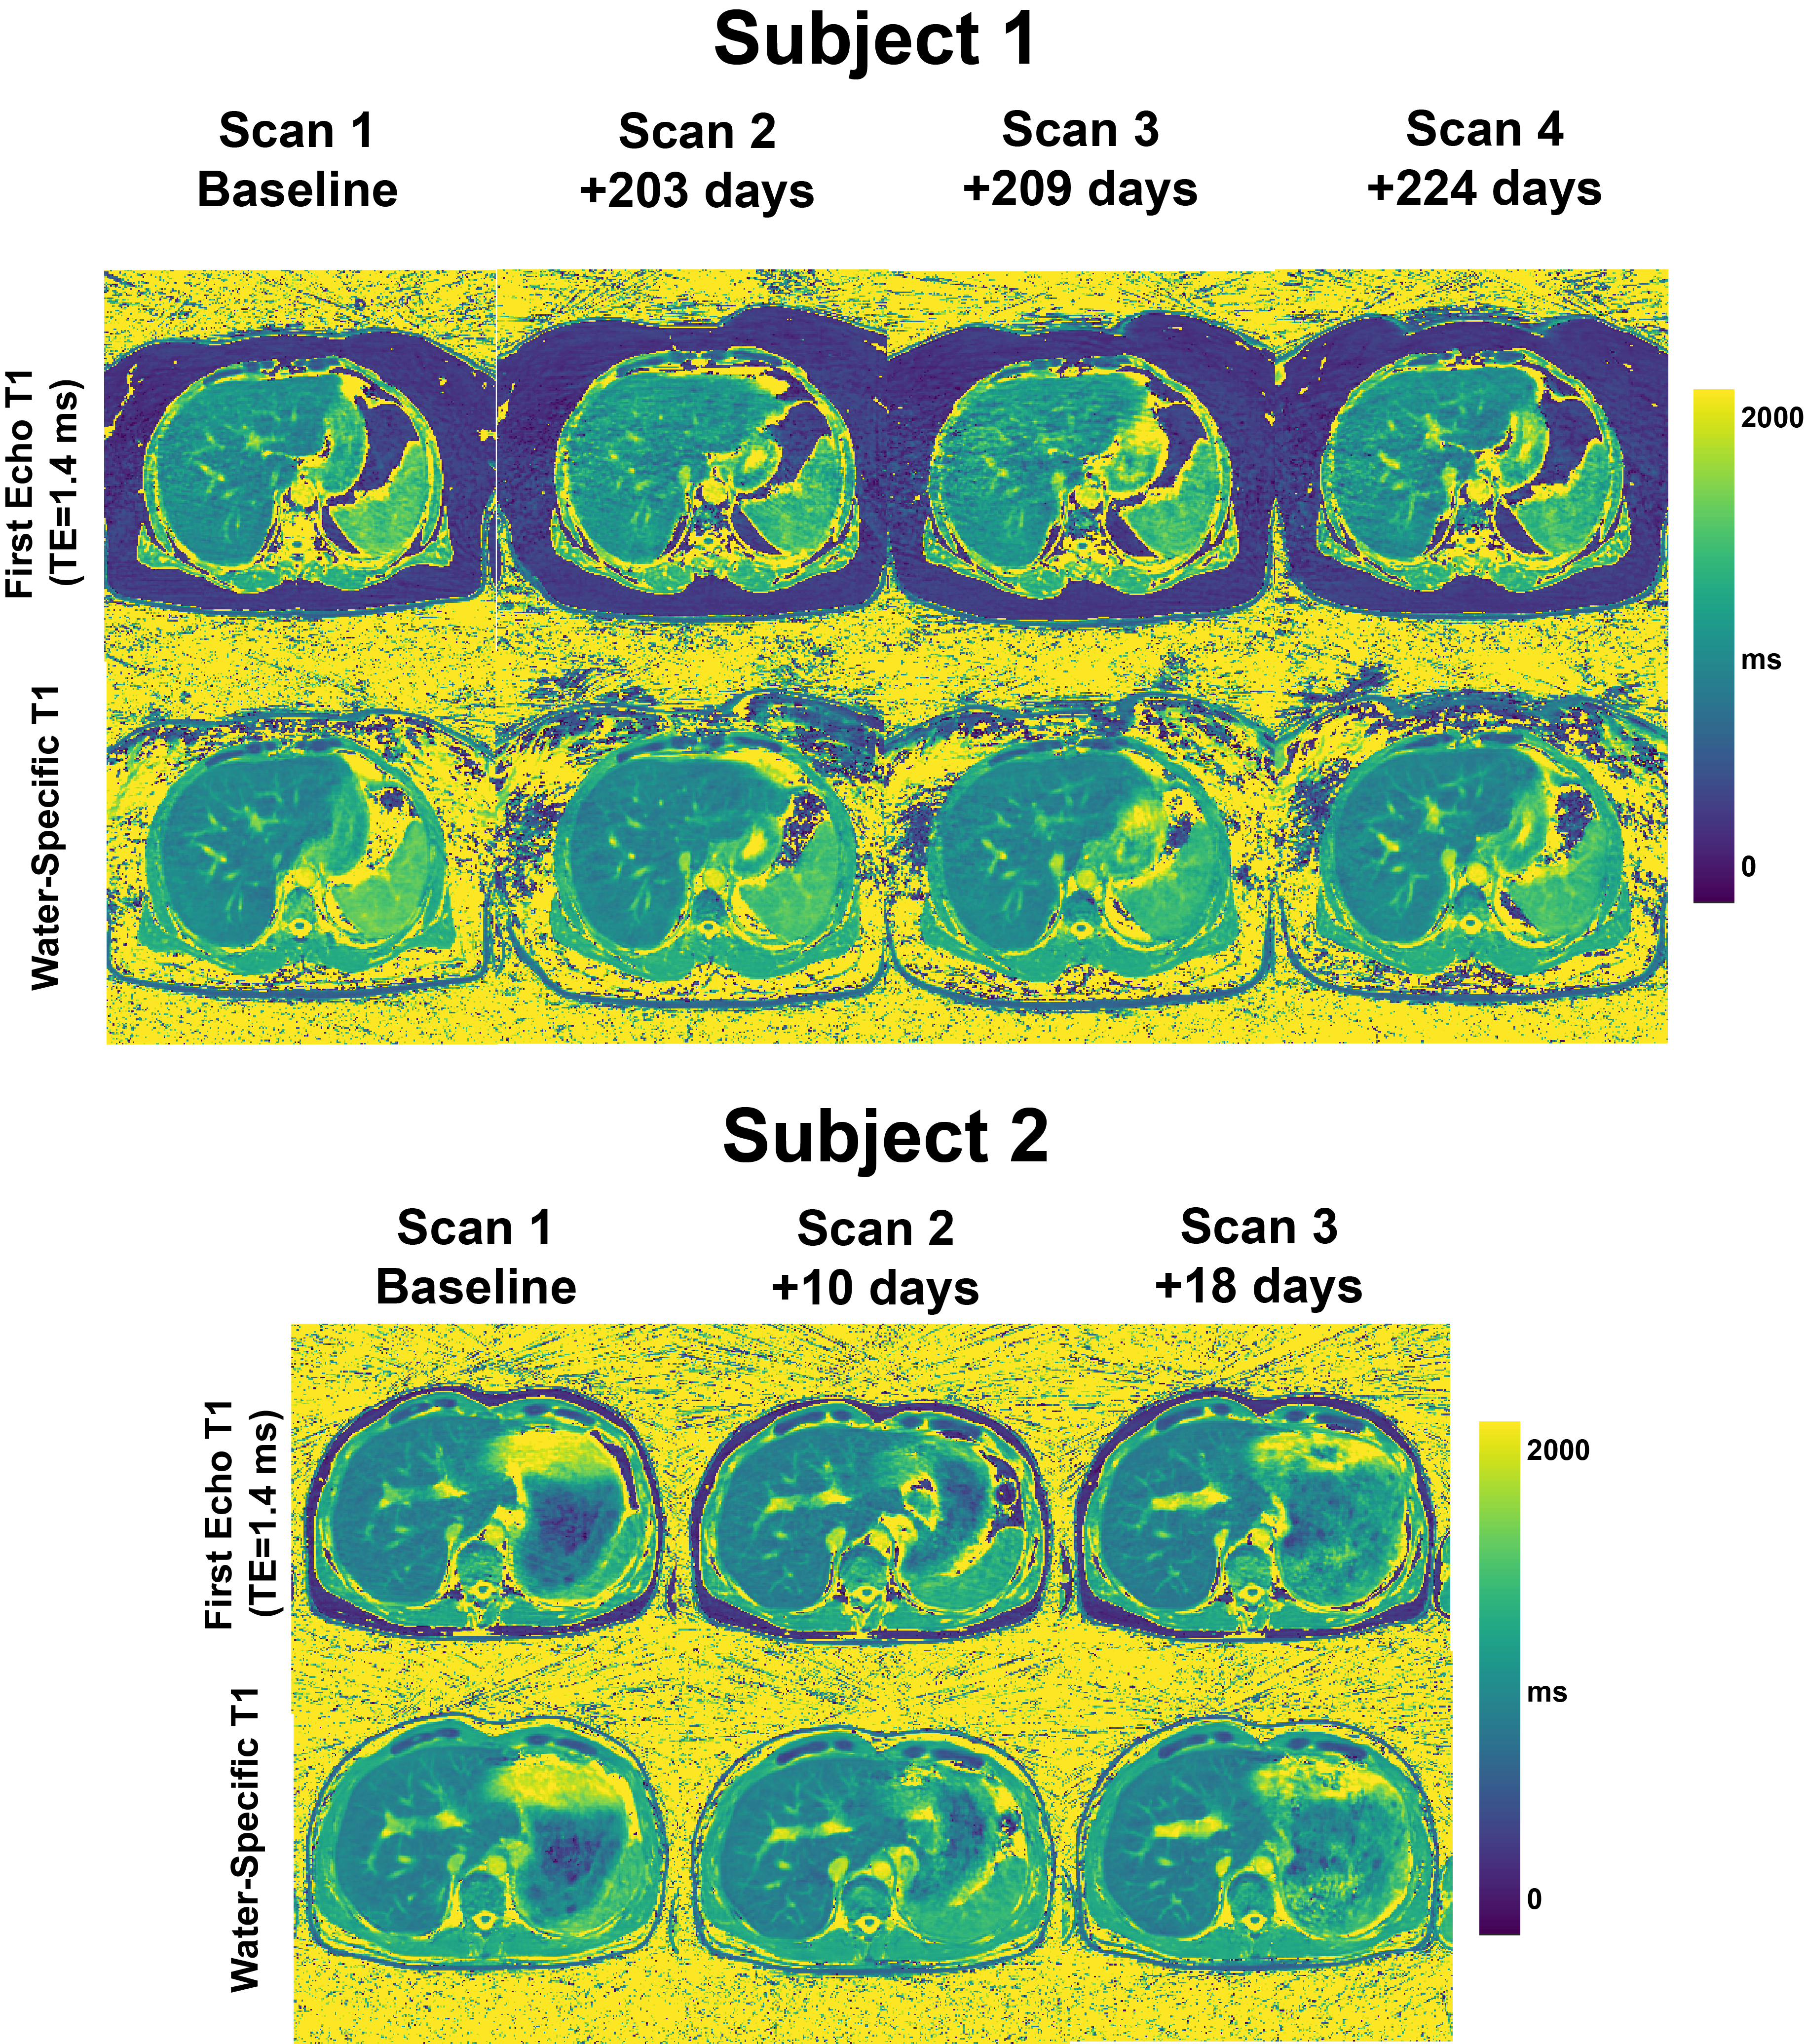
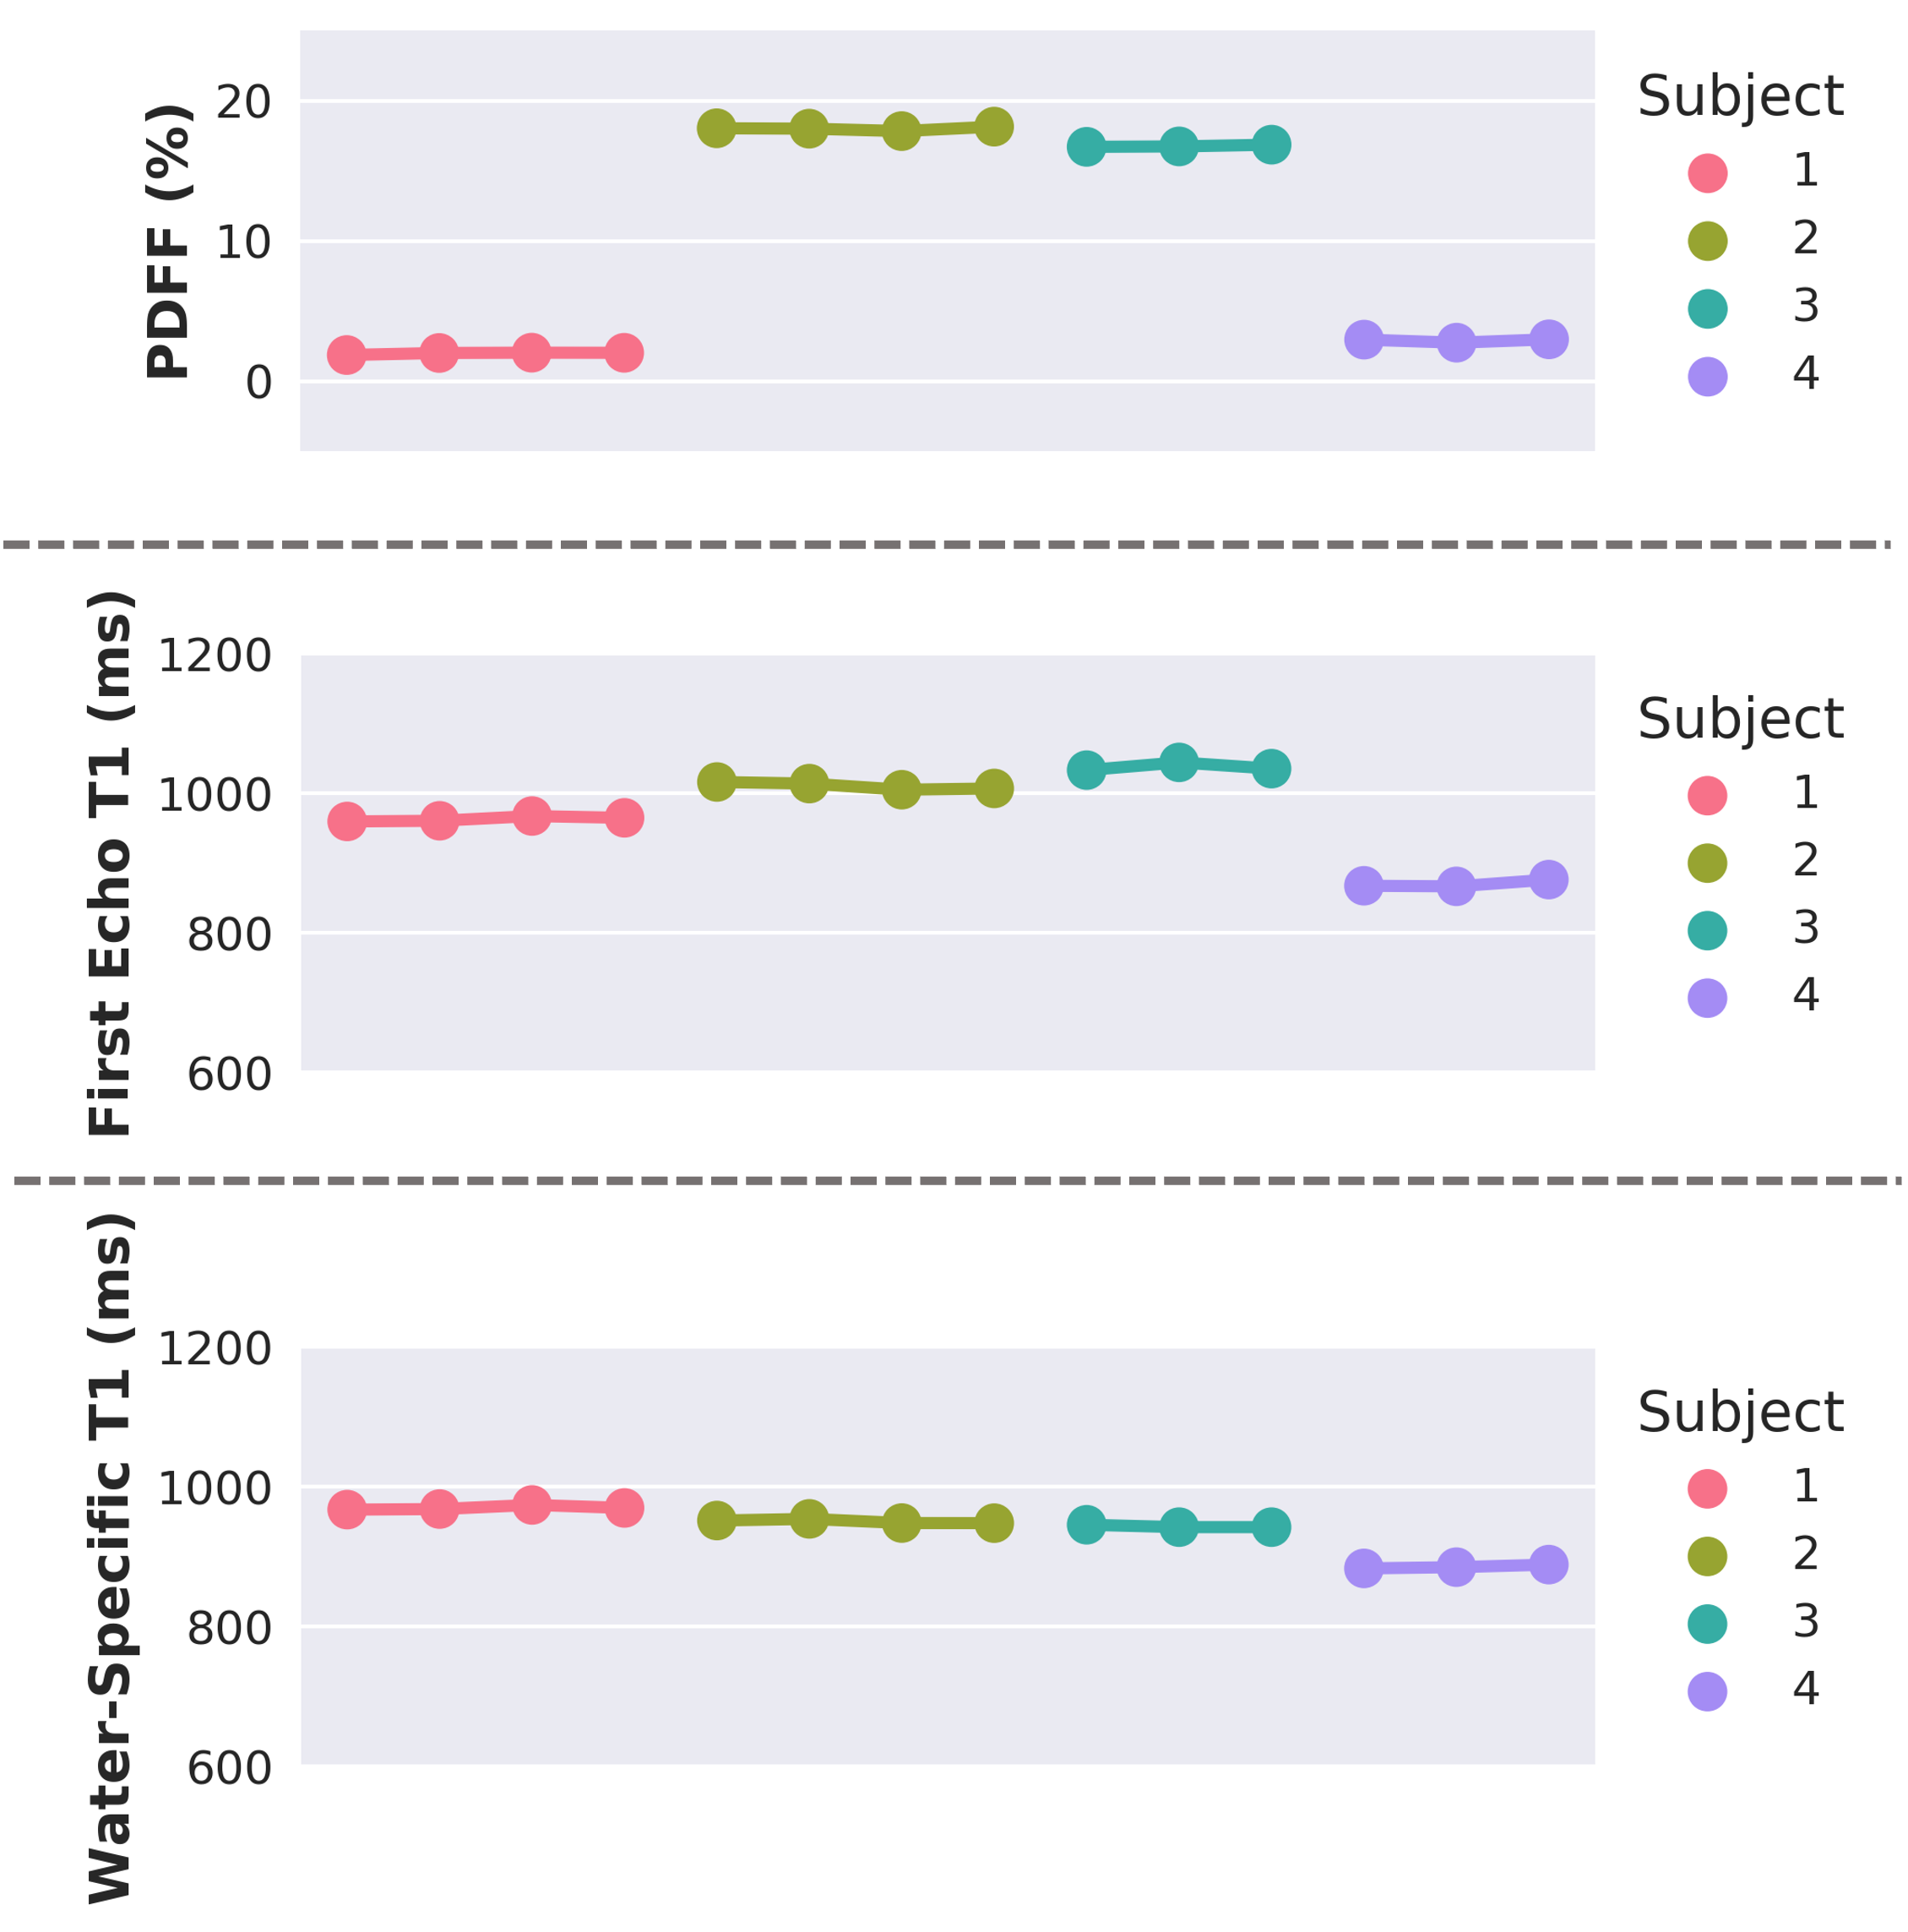
Two imaging slices of liver PDFF and T1 maps of a healthy volunteer and a NAFLD patient are shown in Figure 1 and 2, respectively. With elevated liver fat, the first echo T1 map shows blurring while the water T1 maps reveal clear liver anatomy. In Figure 3, the difference between the first echo T1 and water T1 is strongly correlated with PDFF level, difference between the third echo T1 and water T1 is negatively correlated with PDFF and the water-specific T1 is only weakly correlated with PDFF. two ROIs, the correlation between T1 and PDFF is consistent. In this study, the first echo is at TE=1.4ms is close to fat/water opposite-phase condition, and the first echo T1 shows overestimation compared to the water-specific T1, due to the contamination from fat’s low T1 value. On the other hand, the third echo is at TE=4.6ms which is close to fat/water in-phase condition, and the third echo T1 is underestimated. Figure 4 shows water-specific T1 and the first echo T1 maps acquired at different dates. Figure 5 compares mean T1 values of ROIs from 4 different subjects to demonstrate the repeatability of the method. The water-specific T1 values and PDFF both remain stable longitudinally.Discussion
We confirmed that the T1 value difference between the first echo and the water-specific T1 is highly correlated with PDFF. The weak correlation between water-specific T1 and PDFF requires further investigation as it may indicate additional pathology that results in increased T1 value, such as liver fibrosis in NAFLD patients. The time between the first echo to the actual water/fat opposite-phase time is 0.16ms; the time between the third echo to the actual water/fat in-phase time is 0.32ms. These time differences explain the angle difference(Figure 3) of the first echo T1(green) to water-specific T1(pink) regression line is larger than that of the third echo(blue) to pink regression line. Our initial experiments also demonstrated that the measurement of water-specific T1 in GraspT1-Dixon is repeatable.Acknowledgements
This work was supported by the NIH (R01EB030549, R01EB031083, R21EB032917 and P41EB017183) and was performed under the rubric of the Center for Advanced Imaging Innovation and Research (CAI2R), an NIBIB National Center for Biomedical Imaging and Bioengineering.References
[1] F. E. Mozes, E. M. Tunnicliffe, M. Pavlides, and M. D. Robson, “Influence of fat on liver T1 measurements using modified Look–Locker inversion recovery (MOLLI) methods at 3T,” Journal of Magnetic Resonance Imaging, vol. 44, no. 1, pp. 105–111, 2016, doi: 10.1002/jmri.25146.
[2] R. B. Thompson, K. Chow, D. Mager, J. J. Pagano, and J. Grenier, “Simultaneous proton density fat-fraction and imaging with water-specific T1 mapping (PROFIT1): application in liver,” Magnetic Resonance in Medicine, vol. 85, no. 1, pp. 223–238, 2021, doi: 10.1002/mrm.28434.
[3] O. Jaubert et al., “Multi-parametric liver tissue characterization using MR fingerprinting: Simultaneous T1, T2, T2*, and fat fraction mapping,” Magnetic Resonance in Medicine, vol. 84, no. 5, pp. 2625–2635, 2020, doi: 10.1002/mrm.28311.
[4] L. Feng et al., “Magnetization-prepared GRASP MRI for rapid 3D T1 mapping and fat/water-separated T1 mapping,” Magn Reson Med, vol. 86, no. 1, pp. 97–114, Jul. 2021, doi: 10.1002/mrm.28679.
[5] Z. Li, X. Xu, Y. Yang, and L. Feng, “Repeatability and robustness of MP-GRASP T1 mapping,” Magnetic Resonance in Medicine, vol. 87, no. 5, pp. 2271–2286, 2022, doi: 10.1002/mrm.29131.
[6] L. Feng, Q. Wen, C. Huang, A. Tong, F. Liu, and H. Chandarana, “GRASP-Pro: imProving GRASP DCE‐MRI through self-calibrating subspace-modeling and contrast phase automation,” Magn Reson Med, vol. 83, no. 1, pp. 94–108, Jan. 2020, doi: 10.1002/mrm.27903.
[7] D. Hernando, P. Kellman, J. P. Haldar, and Z.-P. Liang, “Robust Water/Fat Separation in the Presence of Large Field Inhomogeneities Using a Graph Cut Algorithm,” Magn Reson Med, vol. 63, no. 1, pp. 79–90, Jan. 2010, doi: 10.1002/mrm.22177.
[8] T. Benkert, L. Feng, D. K. Sodickson, H. Chandarana, and K. T. Block, “Free-breathing volumetric fat/water separation by combining radial sampling, compressed sensing, and parallel imaging,” Magnetic Resonance in Medicine, vol. 78, no. 2, pp. 565–576, 2017, doi: 10.1002/mrm.26392.
[9] C.-Y. Liu, C. A. McKenzie, H. Yu, J. H. Brittain, and S. B. Reeder, “Fat quantification with IDEAL gradient echo imaging: Correction of bias from T1 and noise,” Magnetic Resonance in Medicine, vol. 58, no. 2, pp. 354–364, 2007, doi: 10.1002/mrm.21301.
Figures