0427
Free-Breathing Stack-of-Stars Look-Locker T1-mapping with Whole Liver Coverage1Siemens Medical Solutions USA, Tucson, AZ, United States, 2Department of Radiological Sciences, University of California Los Angeles, Los Angeles, CA, United States, 3Department of Electrical Engineering, University of Arizona, Tucson, AZ, United States, 4Siemens Medical Solutions USA, Austin, TX, United States, 5Siemens Medical Solutions USA, San Francisco, CA, United States, 6Department of Medical Imaging, University of Arizona, Tucson, CA, United States
Synopsis
Keywords: Liver, Liver
Motivation: Many patients cannot hold their breath as required on standard protocols for abdominal imaging
Goal(s): We develop a new new free-breathing Look-Locker T1-mapping method with whole liver coverage.
Approach: The new free-breathing Look-Locker T1-mapping method employs a pilot tone signal for detecting the respiratory state. This signal is used to reconstruct motion-corrected T1-weighted images, which are used to calculate T1-maps.
Results: Robust T1-maps are obtained covering the whole liver obtained from 6 min free-breathing scan.
Impact: A new free-breathing Look-Locker T1-mapping method with whole liver coverage has been developed for patients who are not able to hold their breath as required in standard protocols.
Introduction
It has been shown that robust T1-maps can be obtained with breath-hold (BH) radial Look-Locker (LL) methods. Although the technique has been optimized for a single BH [1], patients often cannot hold their breath reliably for the required duration. For these cases, a free-breathing (FB) method is needed. Here, we propose a new FB stack-of-stars (SOS) LL T1-mapping approach [2] which takes advantage of a pilot tone device to probe the respiratory state [3] for the reconstruction of motion-free data [4]. The accuracy and repeatability of the T1-values are evaluated.Method
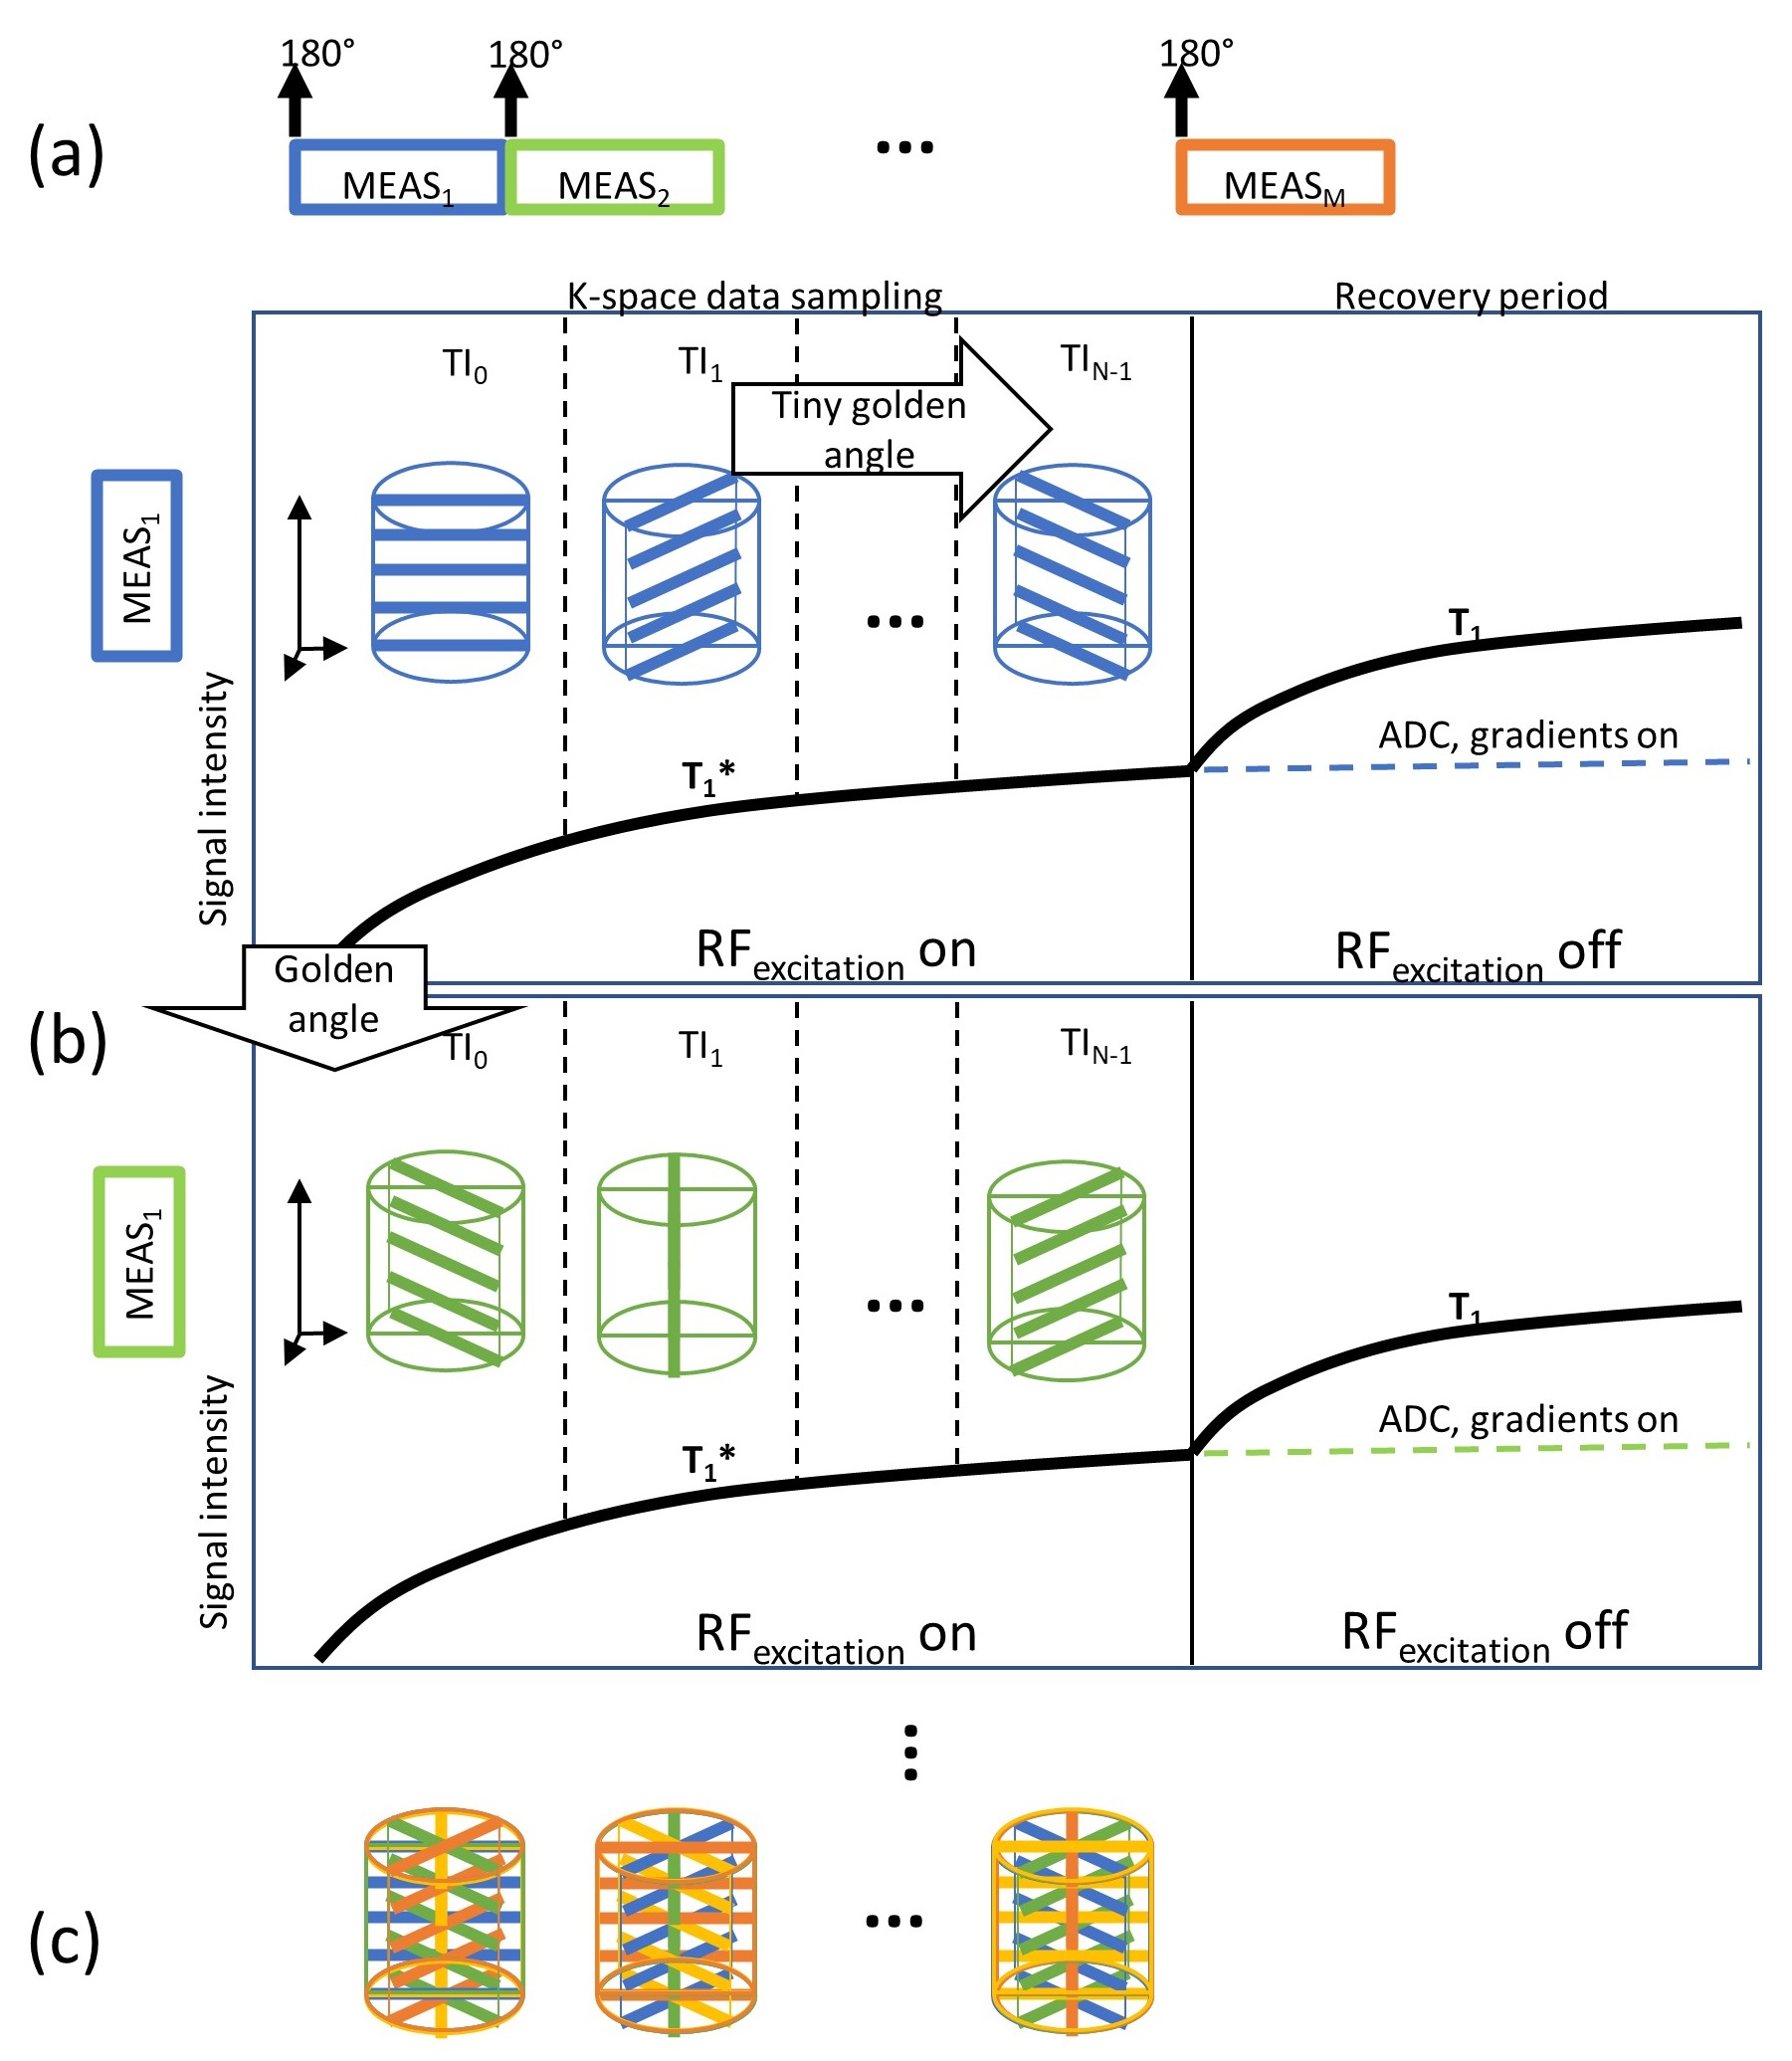
T1 Mapping: Multiple measurements (MEAS) of the prototype LL T1 mapping sequence [2], each consisting of a non-selective 180° inversion pulse, were acquired with SOS k-space sampling (Fig. 1) as indicated by the colored lines (Fig. 1b-c). Prior to further processing, the k-space data (Fig. 1c) were Fourier-transformed along the through-plane direction generating a stack of 32 slices.The sampling of the inversion recovery curve resulted in a steady-state magnetization MSS lower than the equilibrium magnetization M0 yielding an apparent relaxation term T1* (Fig. 1b). During the recovery period, the excitation pulses were turned off allowing for undisturbed relaxation of the longitudinal magnetization with T1. For short durations of the MEAS-blocks, the recovery of the longitudinal magnetization was incomplete, resulting in a reduced M0’-magnetization after the subsequent inversion. Fitting the ABT1-model [7] to the T1-weighted images acquired at different inversion times (TI) provides T1*, MSS and M0’. The corrected T1-values were calculated from these parameters [6].
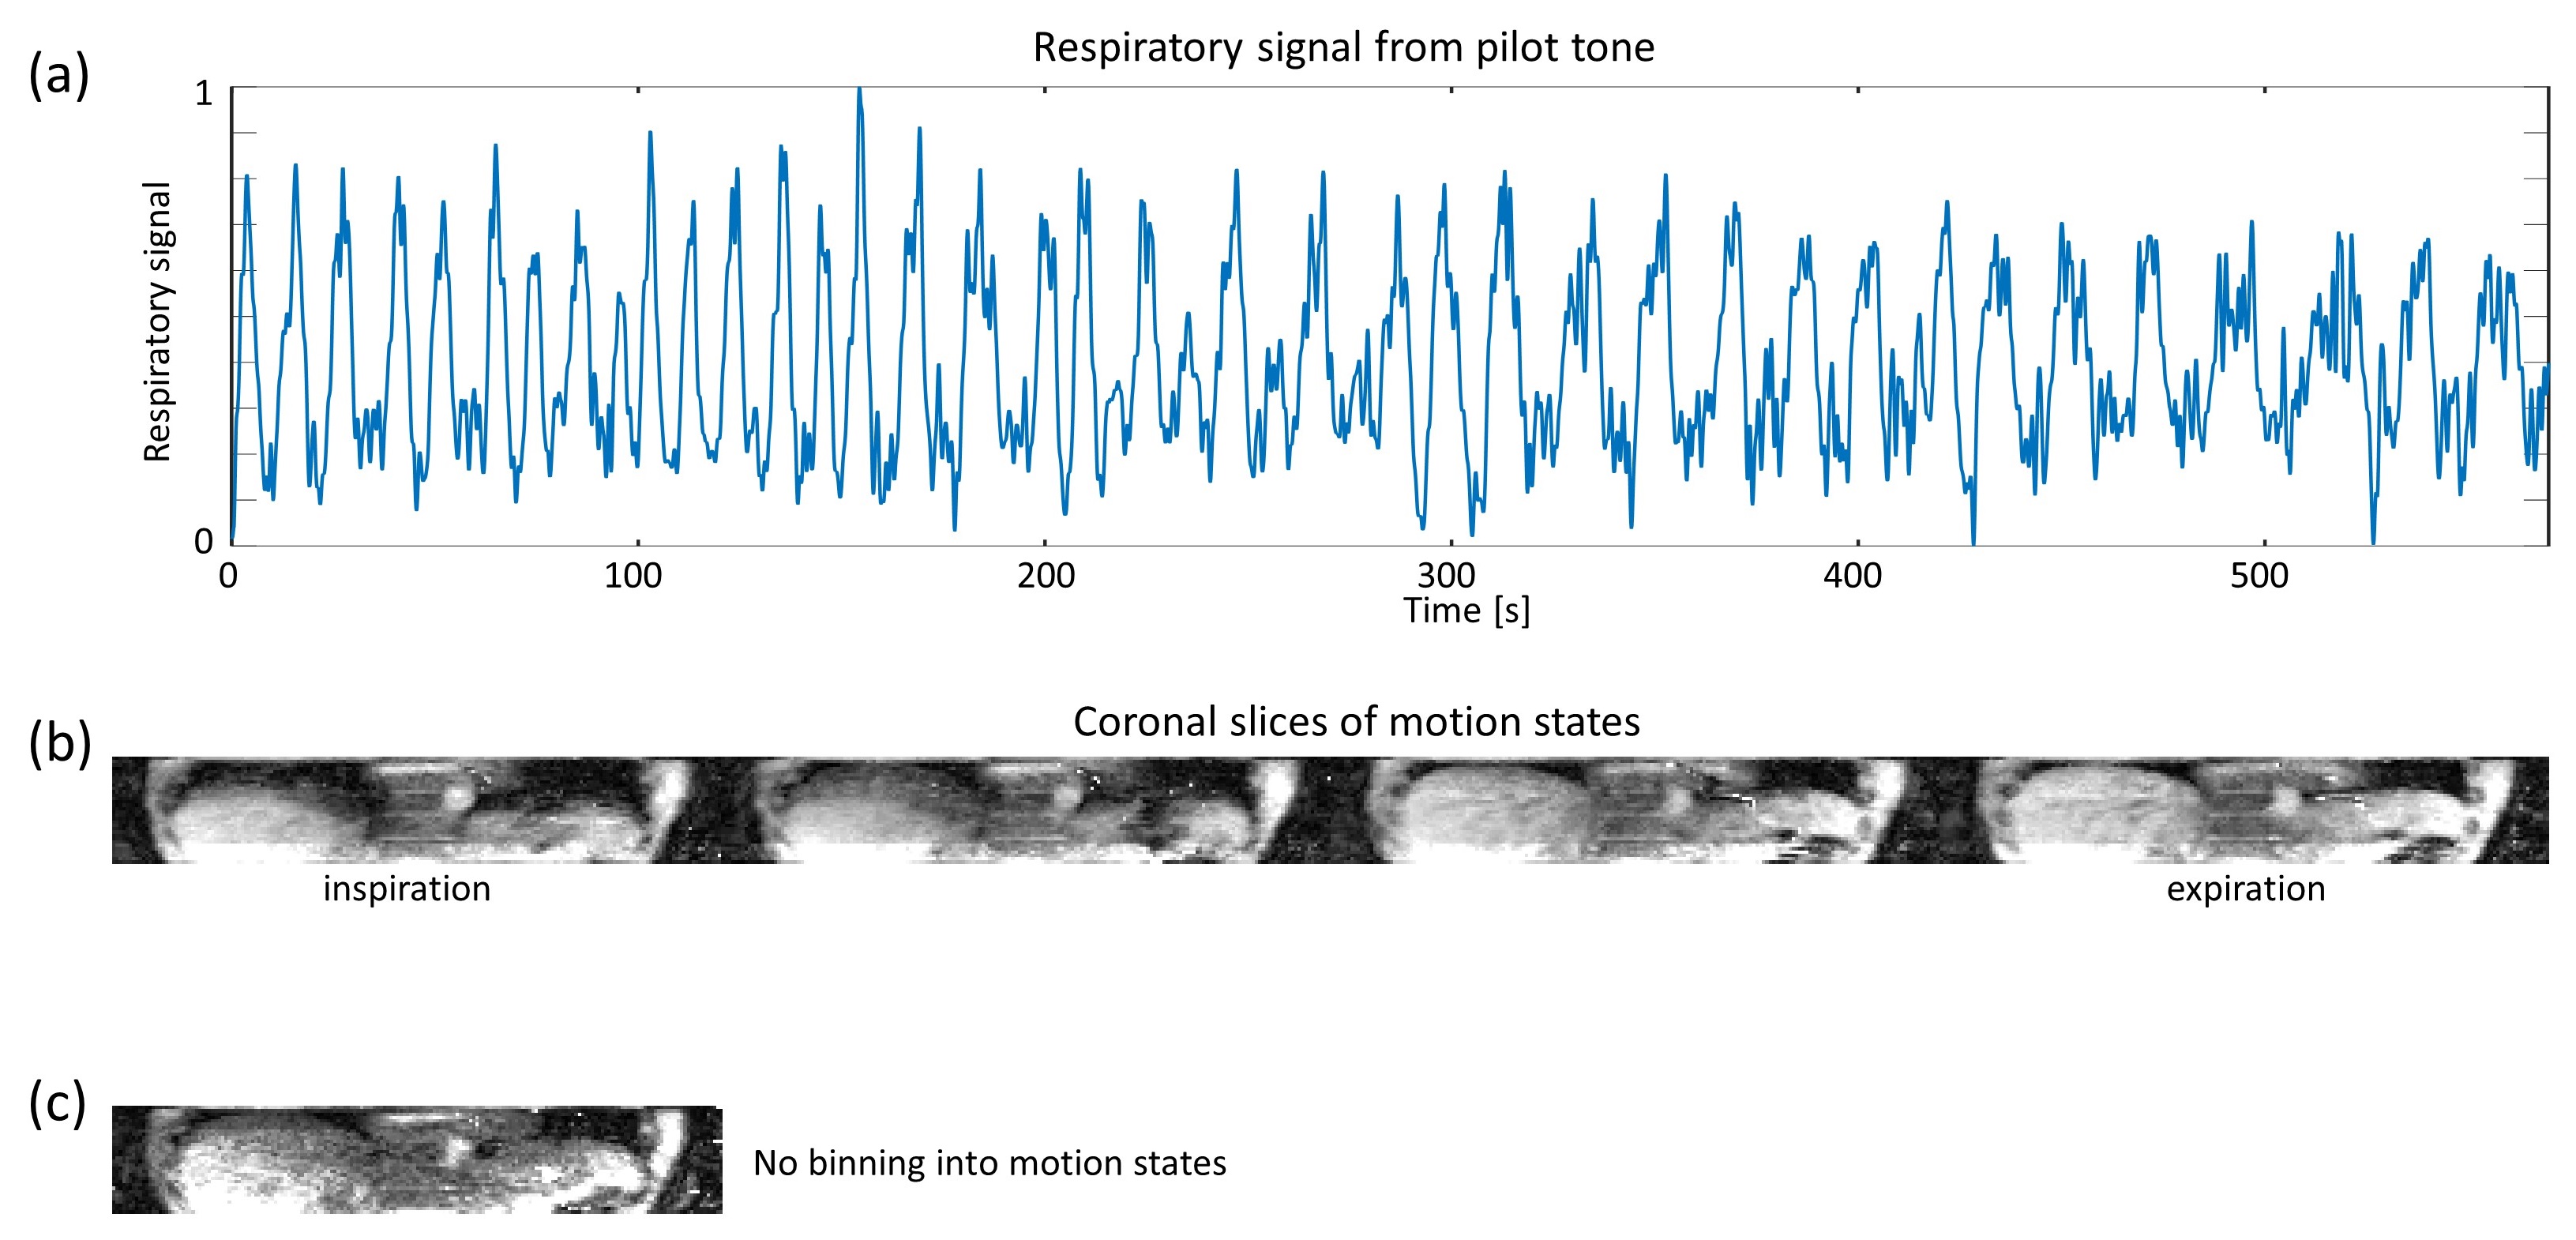
Respiratory signal and motion states: To characterize the respiratory state during FB, a hardware module transmitting a low power RF signal (pilot tone) was used. [3]. This signal was measured continuously during k-space data sampling and the subsequent recovery period. The respiratory signal was obtained from the pilot tone signal using filtering (Fig. 2a). The complete SOS k-space data for each TI and slice were then sorted into four motion states based on the respiratory signal.
Imaging experiments: In an IRB-approved study, three subjects were scanned at 3 T (MAGNETOM Skyra, Siemens Healthineers, Erlangen, Germany) with the FB SOS LL method. For comparison, data were acquired with a navigator-based 2D PACE-triggered and BH LL methods without the pilot tone. Imaging parameters for the three methods were: in-plane resolution 2.3x2.3 mm2, slice thickness of 5 mm (FB SOS) and 6 mm (BH, PACE), TE=1.75 ms, TR=3.7 ms, receiver bandwidth=610 Hz/pixel, base resolution=256. FB SOS LL data were acquired with 80 MEAS for 30 TIs (10 min) or 64 MEAS and 23 TIs (6 min). For reproducibility experiments, subjects were imaged twice taken out of the magnet in between scans.
Reconstructions: For the FB SOS LL technique, the images at different TIs for each motion state were reconstructed using XD-GRASP [4] after binning the k-space of each TI into four motion states. The TI images for the 2D BH and PACE-triggered LL acquisitions were reconstructed using GRASP [5]. For the latter case, the corrected T1-values were obtained from the apparent T1*-values [7].
Results
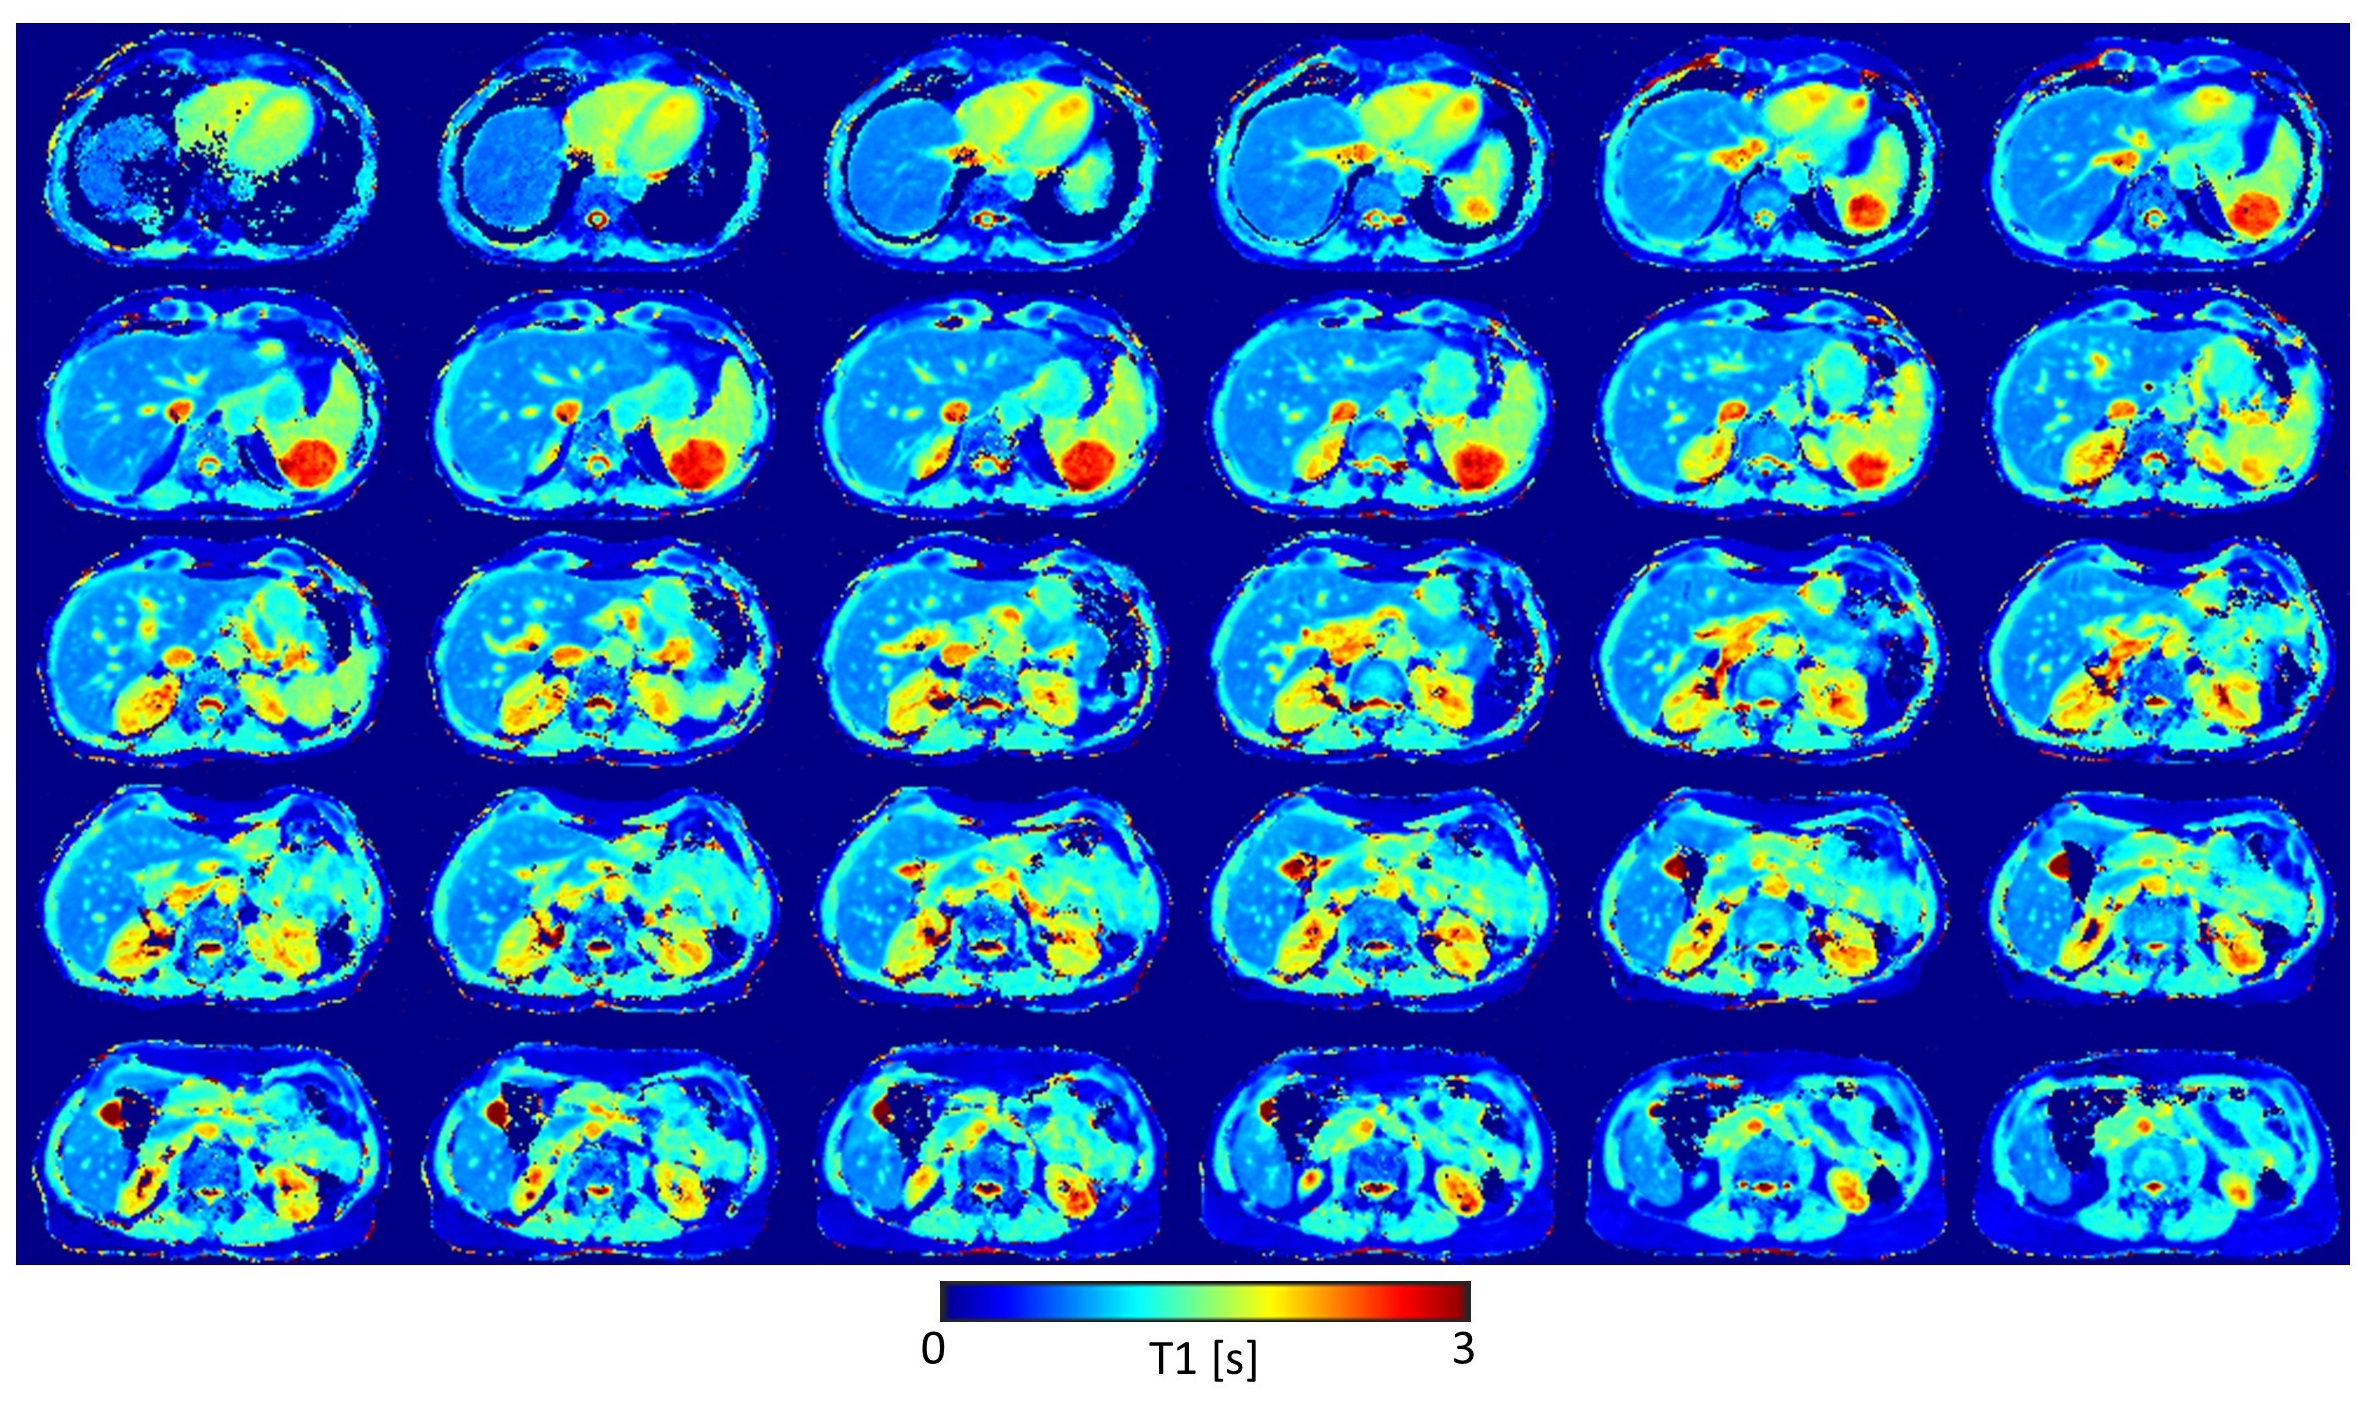
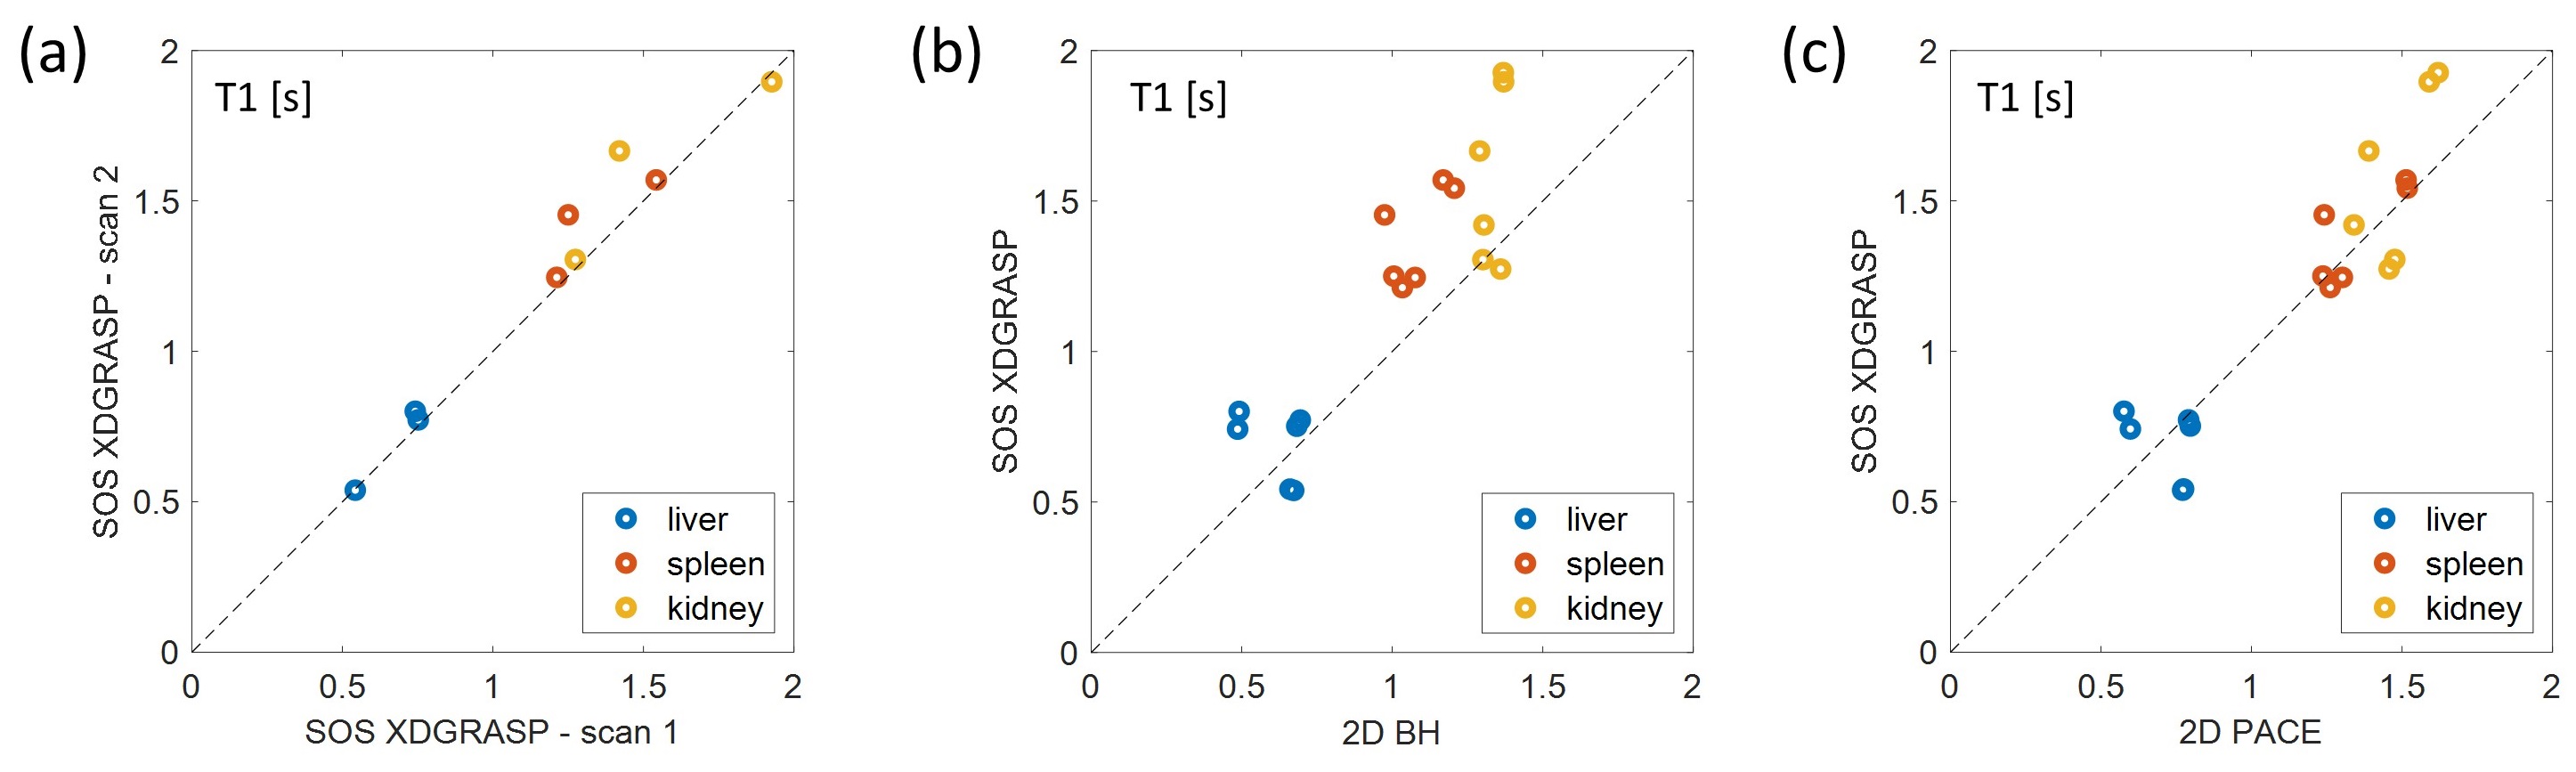
Fig. 3 shows the T1 maps for 30 out of the 32 acquired slices calculated from the 10 min FB SOS LL data. Whole liver coverage is achieved with the FB T1-mapping protocol providing robust T1-maps.The quantitative analysis (Fig. 4a) reveals that the scan-rescan repeatability of the FB SOS LL technique is good for liver. For spleen and kidney, a higher variability was observed due to difficulties picking similar ROIs between the two scans. Fig. 4b shows that the FB SOS LL acquisition reconstructed with XD-GRASP overestimated T1 compared to the 2D BH LL acquisition with GRASP-reconstruction, but reproduced values similar to those obtained with GRASP-reconstructed PACE-triggered LL data.
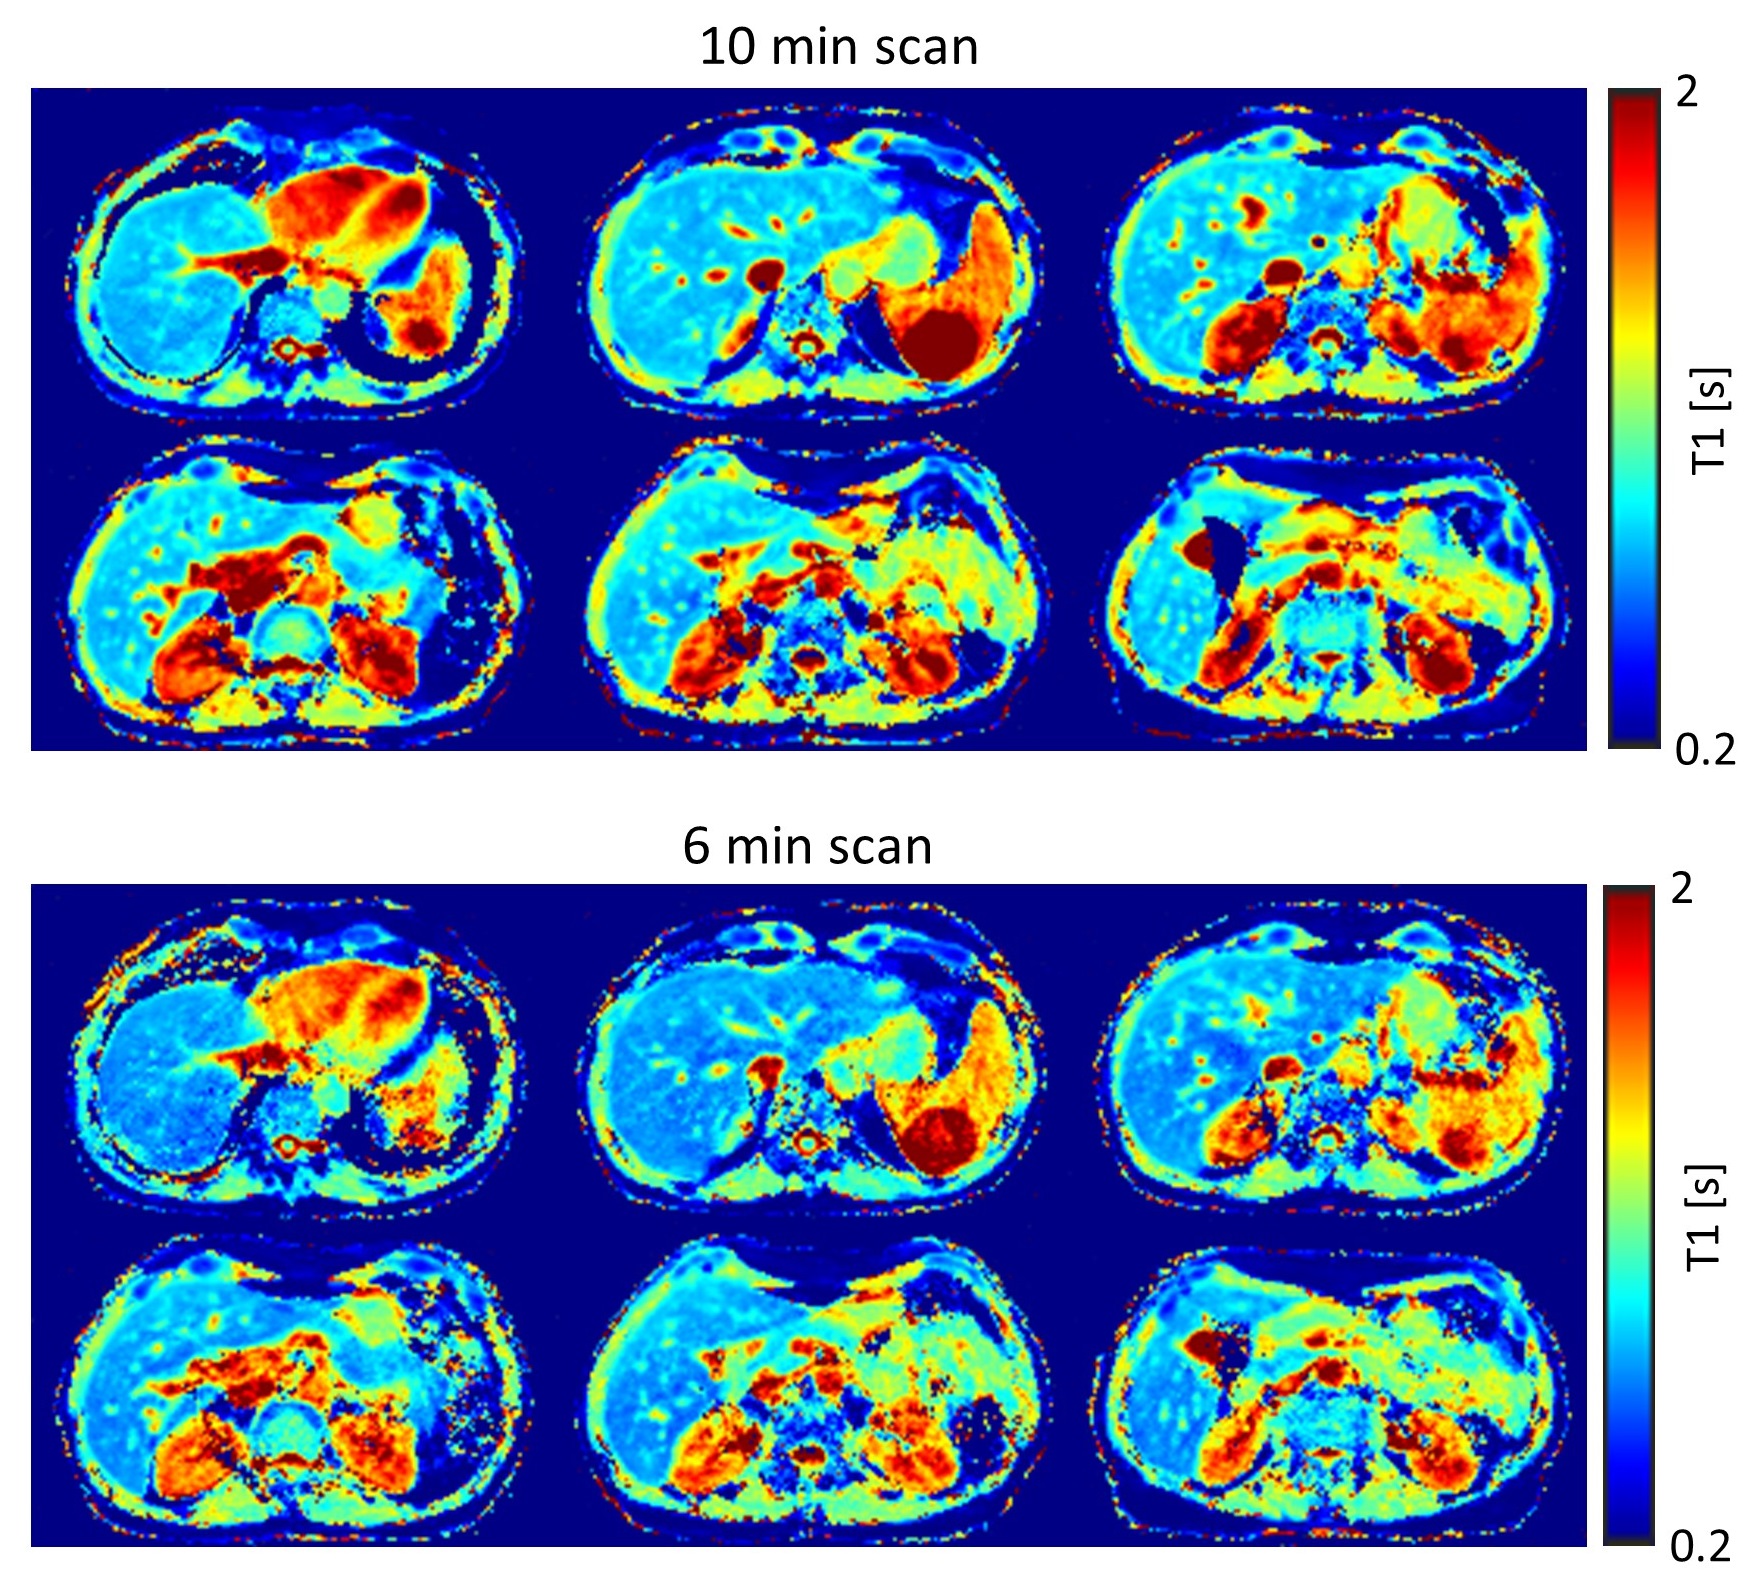
In Fig. 5, corrected T1-maps [6] obtained from a 6 min FB SOS LL scan with a shortened duration of the MEAS-block (5.5 s) is compared to the 10 min FB-SOS scan (MEAS-block duration 7.1 s). The maps had similar values, even for long T1-species with incomplete recovery of the longitudinal magnetization between MEAS-blocks.
Discussion
We demonstrated that FB SOS LL T1-mapping reconstructed with XD-GRASP with whole liver coverage is feasible. Differences in the corrected T1-values between the FB approaches (SOS, PACE) and the BH method probably arise from residual impact of the motion on the shape of the inversion recovery curve. The FB SOS LL technique will be further optimized to achieve clinically relevant total imaging times.Acknowledgements
We would like to acknowledge grant support from the National Institutes of Health (CA245920 and EB031894), Arizona Biomedical Research Centre (CTR056039), and the Technology and Research Initiative Fund (TRIF) Improving Health Initiative.References
[1] Ahanonu E., Goerke U., Johnson K., Toner B., Deshpande V., Bilgin A., Altbach M. T1 mapping of the entire abdomen using a time efficient free breathing neural network radial Look Locker approach, Proceedings of Annual Meeting of the ISMRM, 31:664, 2023
[2] Li Z, Fu Z, Keerthivasan M, et al., Magn Reson. Imaging 79 (2021): 28
[3] Solomon E, Rigie DS, Vahle T, et al., Magn. Reson. Med. 85 (2021): 2672
[4] Feng L, Axel L, Chandara H, et al., Magn. Reson. Med. 75 (2016): 775
[5] Feng L, Grimm R, Block KT, et al., Magn. Reson. Med. 72 (2014): 707
[6] Wang X, Rosenzweig S, Roeloffs V, Blumenthal M, et al., Magn. Reson. Med. 89 (2023): 1368
[7] Deichmann R, Magn. Res. Med. 54 (2005): 20
Figures