0412
Radiogenomics reveals tumor heterogeneity associated with the response to neoadjuvant chemotherapy in luminal breast cancer1Fudan University Shanghai Cancer Center, Shanghai, China
Synopsis
Keywords: Breast, Breast, Luminal breast cancer, Radiomics, Magnetic resonance imaging (MRI), Tumor heterogeneity, Interpretability
Motivation: There is an urgent clinical need to develop predictive biomarkers that can help identify proper candidates for neoadjuvant chemotherapy (NAC) in luminal breast cancer.
Goal(s): To develop tailored prediction model for response to NAC, identify stable predictive features shared between Eastern and Western populations and reveal their biological interpretability.
Approach: Multiscale radiomic features, multiple feature selection methods and classifiers, bioinformatics analysis, three independent cohorts.
Results: The combination of "high-frequency features-XGBoost" demonstrated the best predictive performance for NAC response. Four multiscale radiomic features were identified as stable and discriminative predictive features between Eastern and Western populations, which associated with the immune-related and PPAR pathways.
Impact: We proposed a more rigorous approach to ensure the robustness of radiomic features and explored the stable predictive features and their biological significance across different populations of luminal breast cancer. It will capture the interest of radiologist and clinicians.
Introduction
Luminal breast cancer (BC) is the most prevalent subtype, accounting for 78% of all BC [1]. Neoadjuvant chemotherapy (NAC) is the standard care for locally advanced luminal BC [2]. However, the complexity of tumor heterogeneity results in about one-third of patients with residual invasive cancer after NAC still at risk of recurrence for over five to ten years [3-4]. Therefore, there is an urgent clinical need to develop predictive biomarkers that can help identify proper candidates for NAC at an early stage and provide potential treatment options for non-responders, ultimately improving treatment decisions and long-term prognosis. While data-driven radiomics has promoted precision oncology, there are still some concerning challenges, such as the generalizability and interpretability of models [5]. The stability of predictive features significantly influences model generalizability [6]. Additionally, racial diversity might impact prediction model performance, as studies indicate differences in predictive radiomic features across racial populations [7-9]. On the other hand, the unclear biological significance of radiomic features hinders their clinical translation and application, presenting another important real-world challenge.Methods
This study enrolled luminal BC patients from two cohorts from January 2000 to March 2022, including Cohort 1 (253 Eastern patients), Cohort 2 (176 Western patients), and Cohort 3 (81 patients with both radiomic and transcriptomic data). There three parts in this study: (1) To develop an optimal prediction model for treatment response, we extracted multiscale radiomic features to capture tumor heterogeneity, including intratumoral subregions, peritumoral and whole-tumor regions and kinetic features. Five feature selection methods (LR, Lasso, RFE, XGBoost and high-frequency features method) and four classifiers (LR, Lasso, SVM, XGBoost) were used to develop prediction model in Cohort 1 and identify optimal predictive features for Eastern population. The high-frequency features method integrates features that are selected by more than half of the methods simultaneously. (2) To explore stable and predictive features in both Eastern and Western populations, we conducted the same selection process in Cohort 2 to identify optimal predictive features for Western population. Then, the features shared between Eastern and Western populations were identified as population-independent stable features, potentially representing a more direct and significant correlation with treatment response. (3) To reveal the biological significance of these stable features, we associated radiomic features with RNA-seq data for gene difference analysis and pathway enrichment analysis in Cohort 3.Results
The combination of "high-frequency features-XGBoost" demonstrated the best predictive performance for NAC response in both Cohort 1 (AUC = 0.78-0.92) and Cohort 2 (AUC = 0.85-0.92). In the Eastern and Western populations, four radiomic features were identified as stable and discriminative predictive features (AUC = 0.70-0.80 in Cohort 1; 0.68-0.79 in Cohort 2). Among them, predictive features of non-response to NAC were primarily associated with the inhibition of immune-related and PPAR pathways. Predictive features of response to NAC were predominantly associated with the activation of metabolism and hormone synthesis pathways.Discussion
In this study, we proposed several strategies to address challenges of luminal BC: (1) We expand the dimensions of predictive features by extracting multiscale radiomic features. The results showed that the combined model allows for a comprehensive characterization of heterogeneity, including spatial heterogeneity, hemodynamic heterogeneity and tumor microenvironment. (2) We employed a more rigorous approach to ensure the robustness of radiomic features. Unlike previous studies that used a single random grouping, we conducted multiple rounds of random groupings and feature selection to explore robust features within the same method. We also conducted a horizontal comparison of predictive features across different feature selection methods to extract high-frequency features. This method reduced the impact of random grouping on feature selection, improving the stability and reliability of prediction model [10]. (3) We identified four shared predictive features (LAHGLE, PALISP, Cluster Shade, Zone Entropy) in both populations. They displayed consistent distribution patterns and stable predictive values (AUC = 0.70-0.80; 0.68-0.79), indicating the robust predictive ability for NAC response across different racial populations. The feature LAHGLE represents the proportion of larger size zones with higher gray-level values in the image. High-level LAHGLE was primarily associated with the activation of immune-related pathways. The features Cluster Shade and Zone Entropy represent the uniformity and randomness of gray scale distribution, and were negatively correlated with treatment response. High-level of Cluster Shade is primarily associated with the downregulation of the PPAR pathways, suggesting potential benefits from PPAR agonists [11].Conclusions
Our study proposes an approach to develop prediction models for NAC response and provides a preliminary exploration of stable and interpretable radiomic features in both Eastern and Western populations, which helps reveal tumor heterogeneity and precise treatment decision-making in luminal BC.Acknowledgements
Not applicable.References
[1] Giaquinto AN, Sung H, Miller KD, et al. Breast Cancer Statistics, 2022. CA Cancer J Clin. 2022 Oct 3. [2] Collins PM, Brennan MJ, Elliott JA, et al. Neoadjuvant chemotherapy for luminal a breast cancer: Factors predictive of histopathologic response and oncologic outcome. Am J Surg. 2021 Aug;222(2):368-376.
[3] Pan H, Gray R, Braybrooke J, et al. 20-Year Risks of Breast-Cancer Recurrence after Stopping Endocrine Therapy at 5 Years. N Engl J Med. 2017;377(19):1836-1846.
[4] Loibl S, Marmé F, Martin M, et al. Palbociclib for Residual High-Risk Invasive HR-Positive and HER2-Negative Early Breast Cancer-The Penelope-B Trial. J Clin Oncol. 2021 May 10;39(14):1518-1530.
[5] Bera K, Braman N, Gupta A, et al. Predicting cancer outcomes with radiomics and artificial intelligence in radiology. Nat Rev Clin Oncol. 2022 Feb;19(2):132-146.
[6] Jha AK, Mithun S, Sherkhane UB, et al. Emerging role of quantitative imaging (radiomics) and artificial intelligence in precision oncology. Explor Target Antitumor Ther. 2023;4(4):569-582.
[7] Sparano JA, Wang M, Zhao F, et al. Race and hormone receptor-positive breast cancer outcomes in a randomized chemotherapy trial. J Natl Cancer Inst. 2012 Mar 7;104(5):406-14.
[8] Shubeck S, Zhao F, Howard FM, et al. Response to Treatment, Racial and Ethnic Disparity, and Survival in Patients With Breast Cancer Undergoing Neoadjuvant Chemotherapy in the US. JAMA Netw Open. 2023 Mar 1;6(3):e235834.
[9] Dercle L, Yang M, Gönen M, et al. Ethnic diversity in treatment response for colorectal cancer: proof of concept for radiomics-driven enrichment trials. Eur Radiol. 2023 Jun 27.
[10] Shen C, Nguyen D, Zhou Z, et al. An introduction to deep learning in medical physics: advantages, potential, and challenges. Physics In Medicine and Biology 2020;65(5):05tr01.
[11] Qian Z, Chen L, Liu J, et al. The emerging role of PPAR-alpha in breast cancer. Biomed Pharmacother. 2023 May;161:114420.
Figures
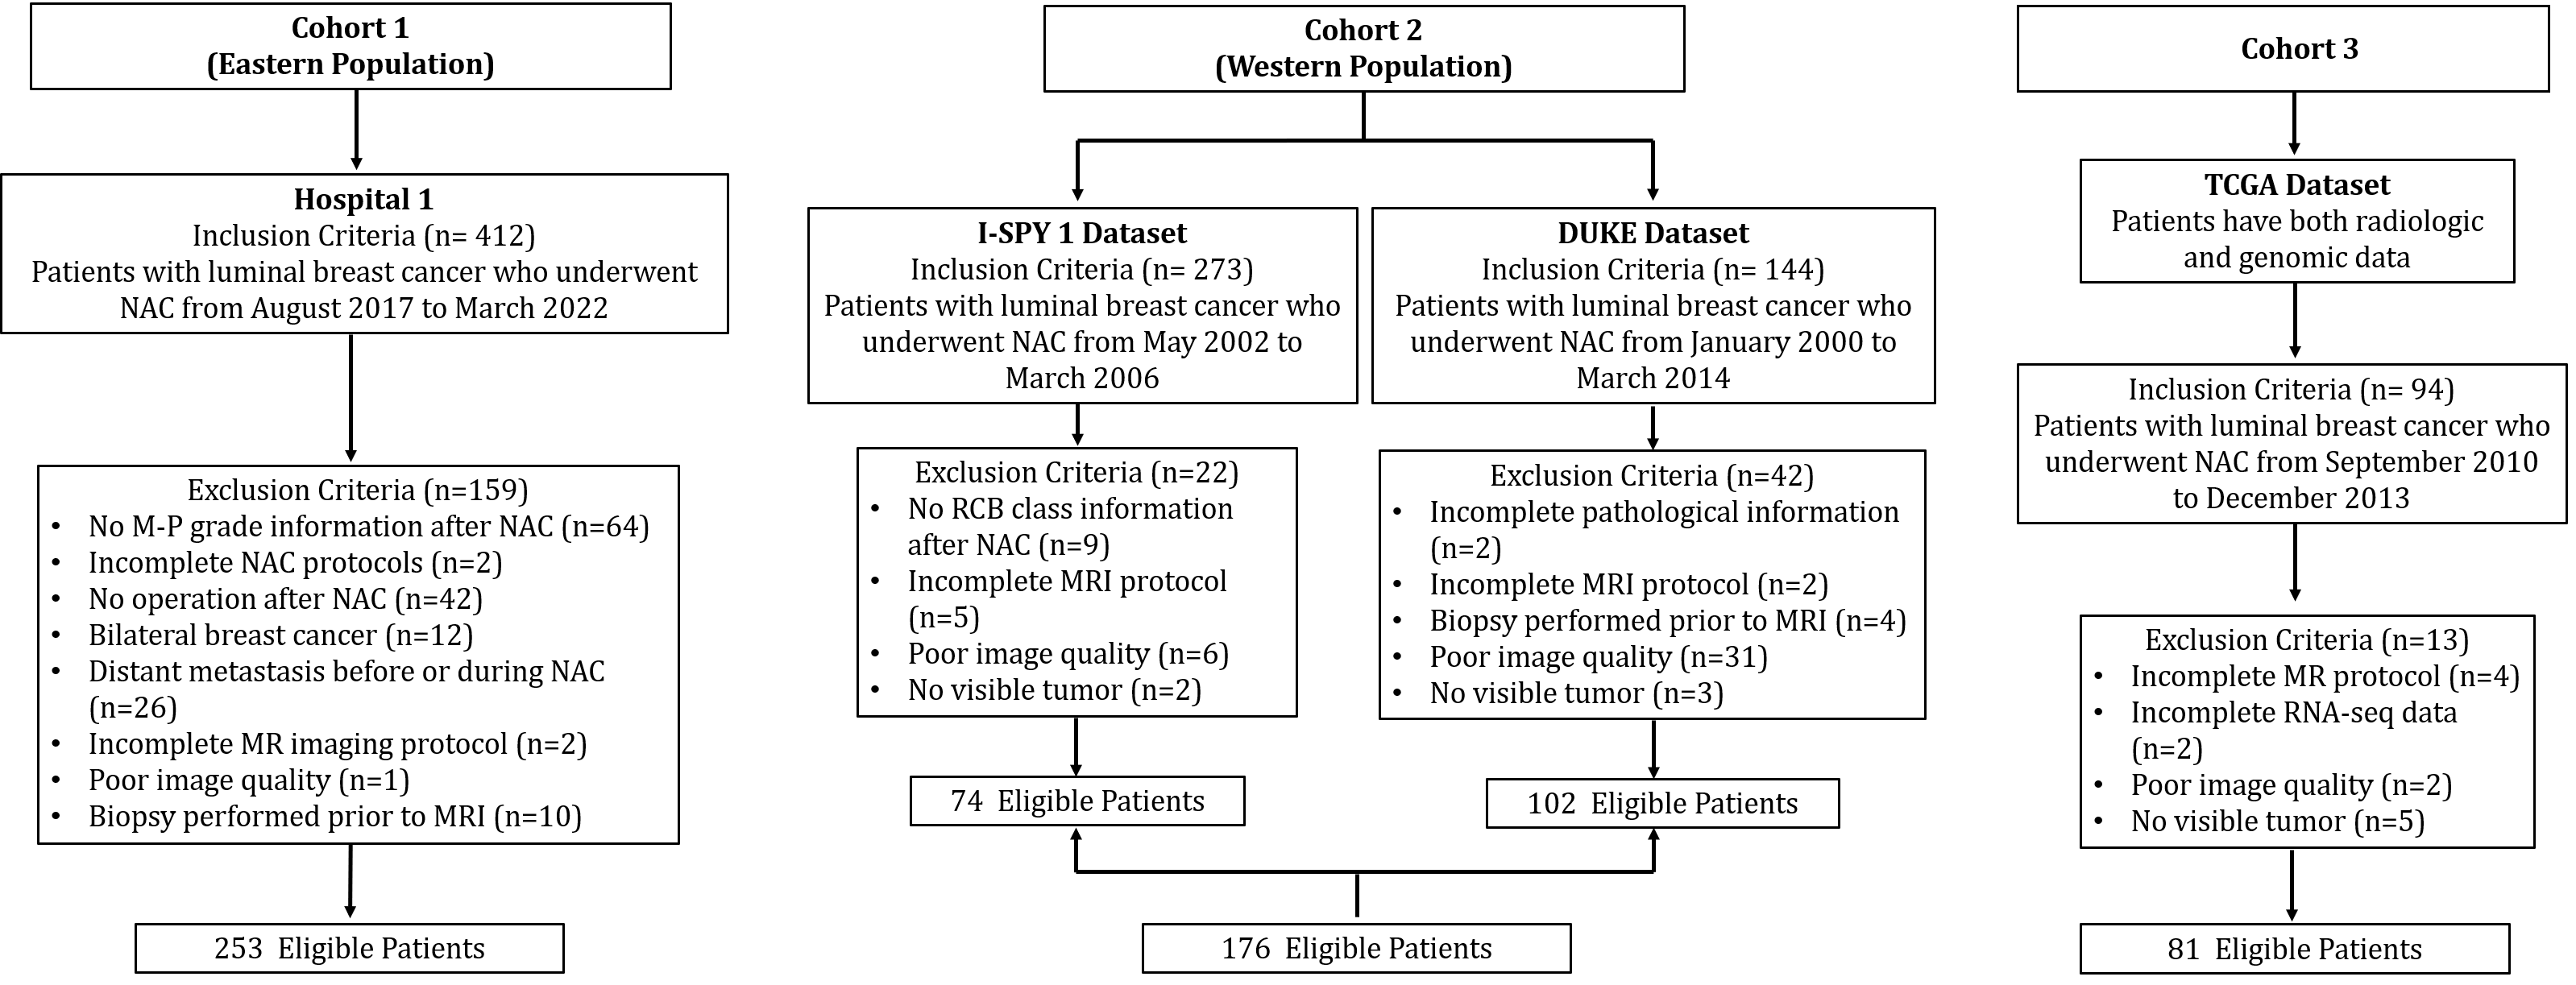
Figure 1. Cohort selection flowchart.
DUKE: The dataset of DUKE-Breast-Cancer-MRI. I-SPY1: The dataset of investigation of serial studies to predict your therapeutic response with imaging and molecular analysis 1. TCGA: The Cancer Genome Atlas. M-P: Miller-Payne grade. RCB: Residual cancer burden system.
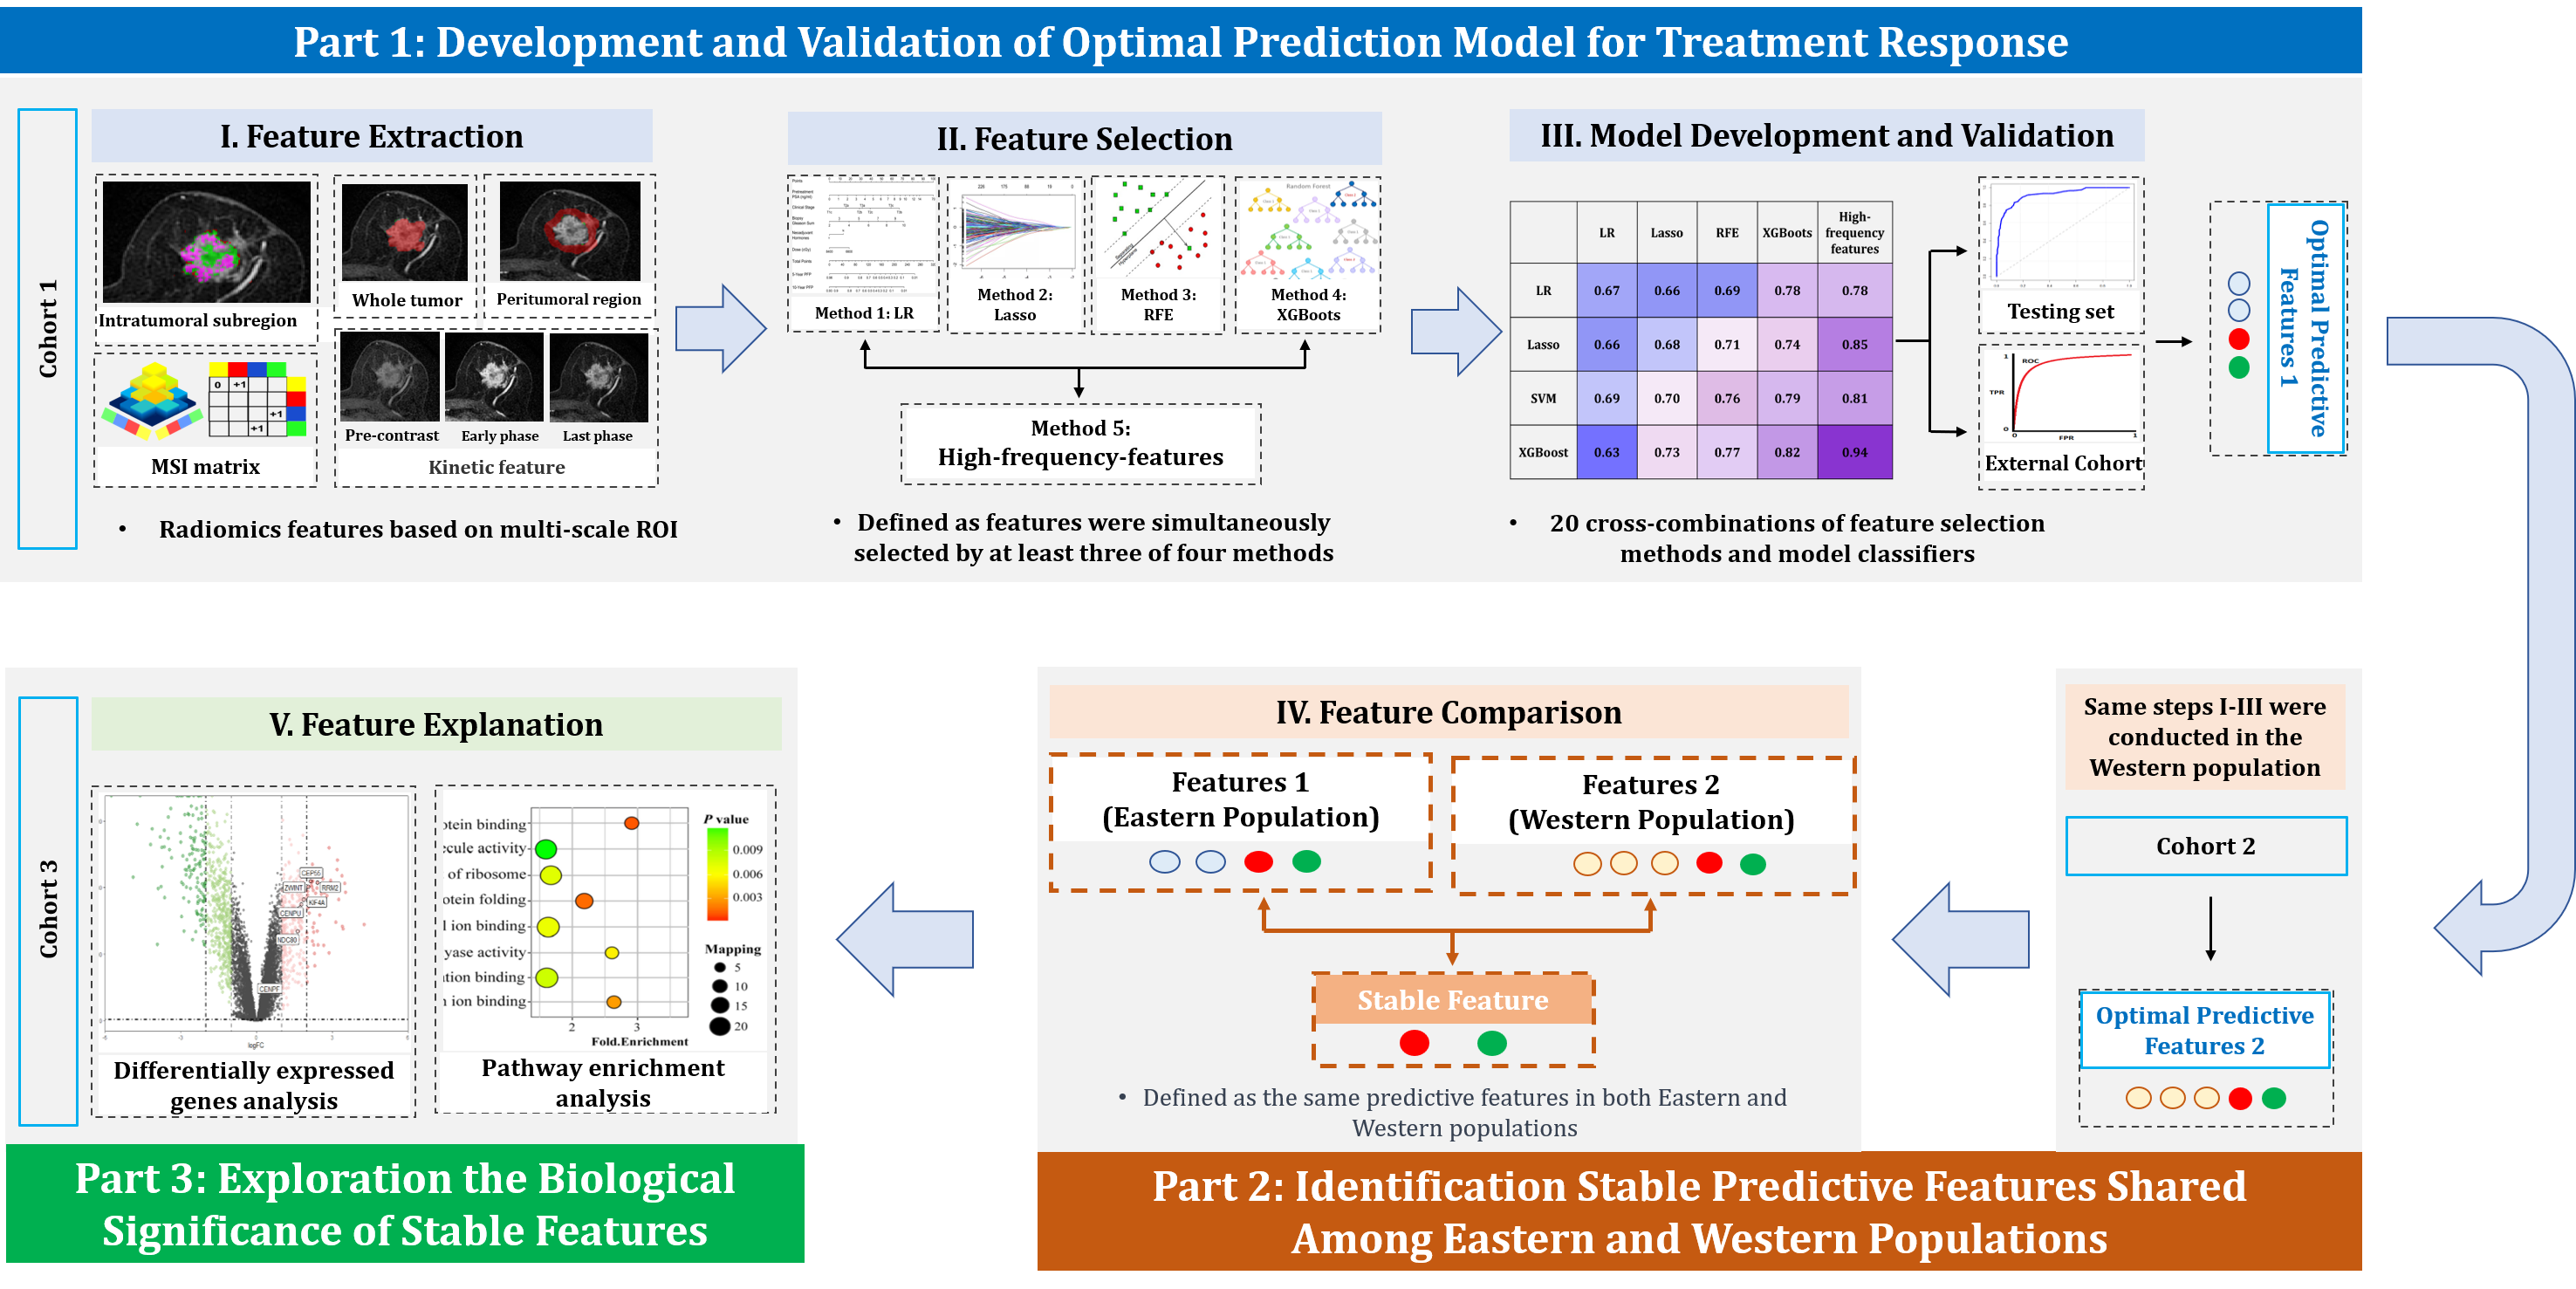
Figure 2. Study framework overview.
Five feature selection methods and four classifiers were used to develop prediction model in Cohort 1 and identify optimal predictive features for Eastern population. Same approach was applied in Cohort 2 to identify optimal predictive features for Western population. Features shared by Eastern and Western populations were identified as population-independent stable features. Transcriptomic data were correlated to reveal the biological significance of stable features in Cohort 3.
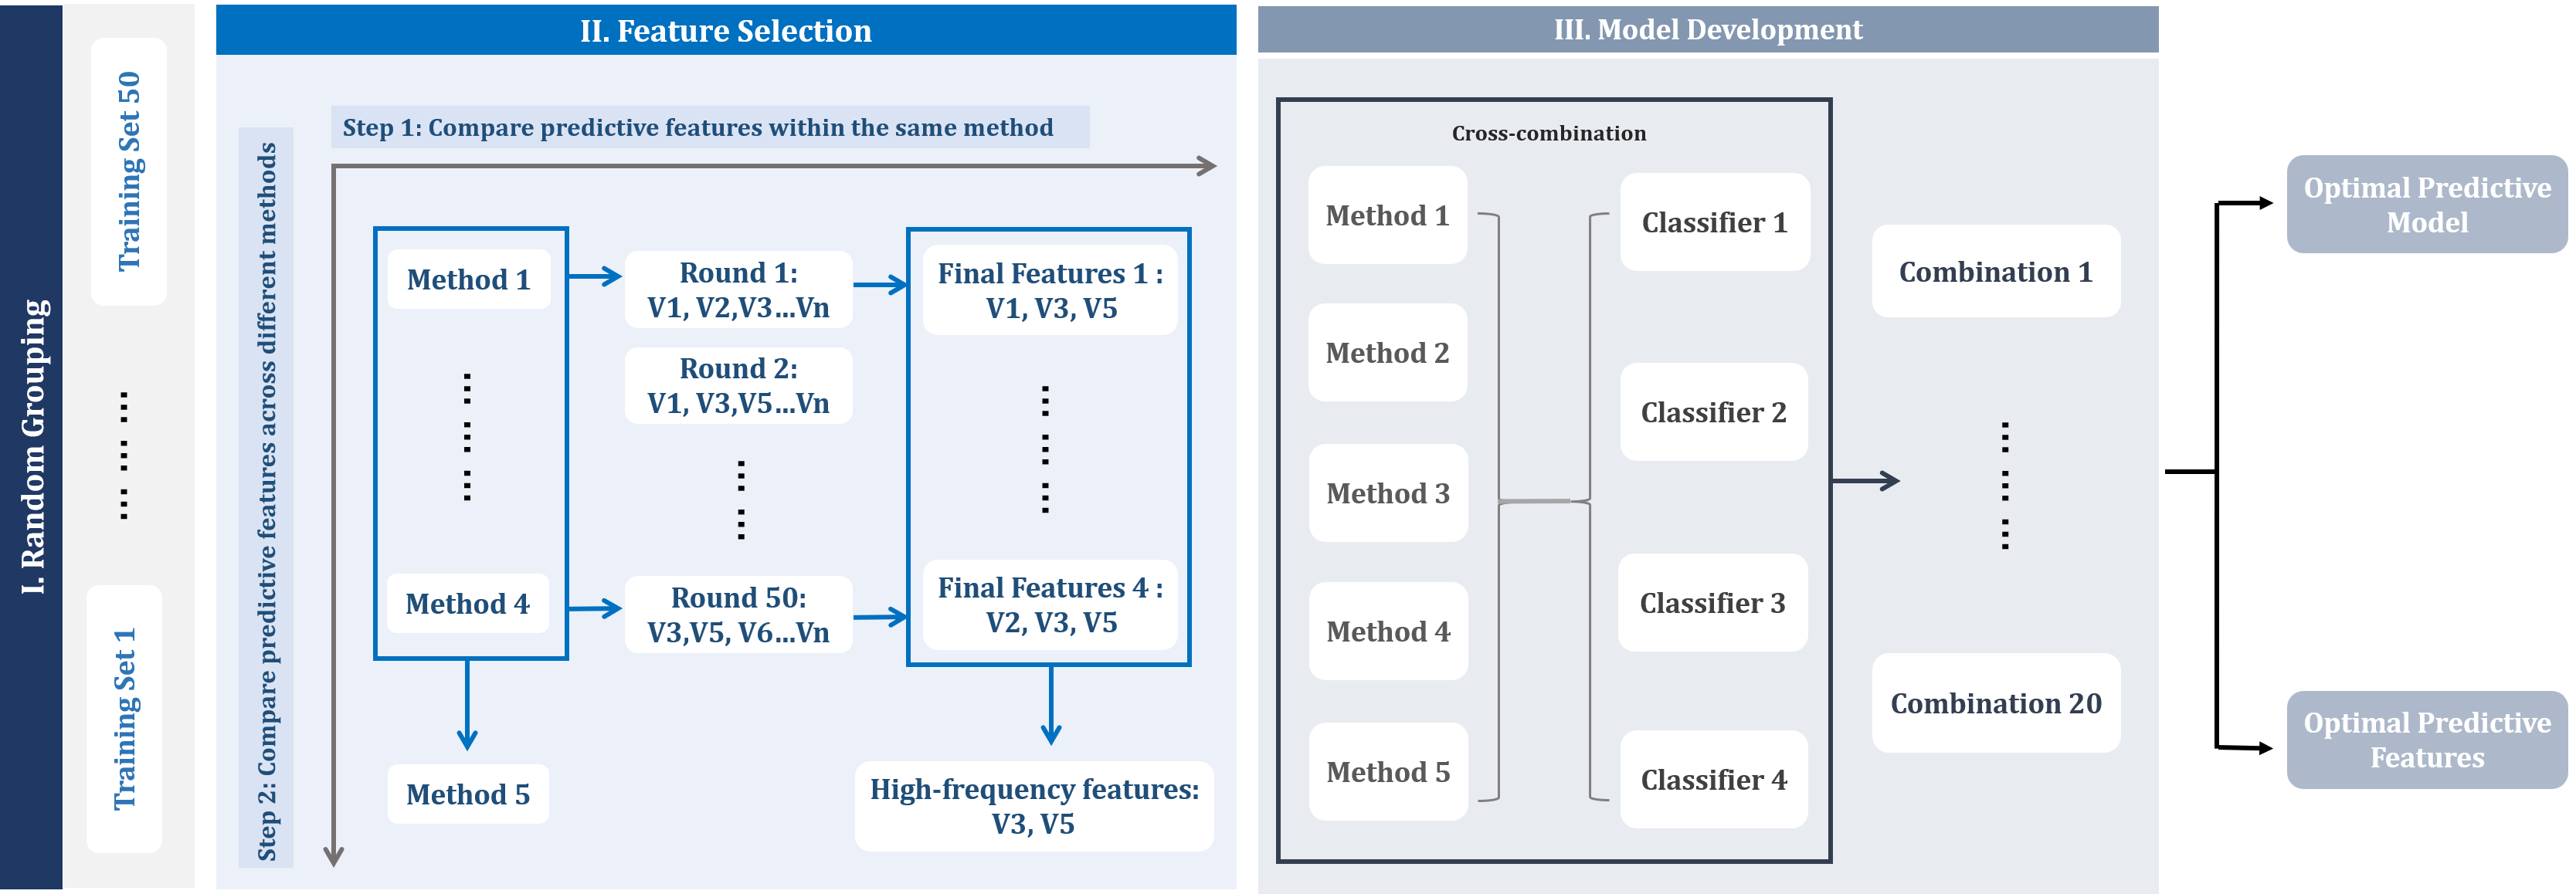
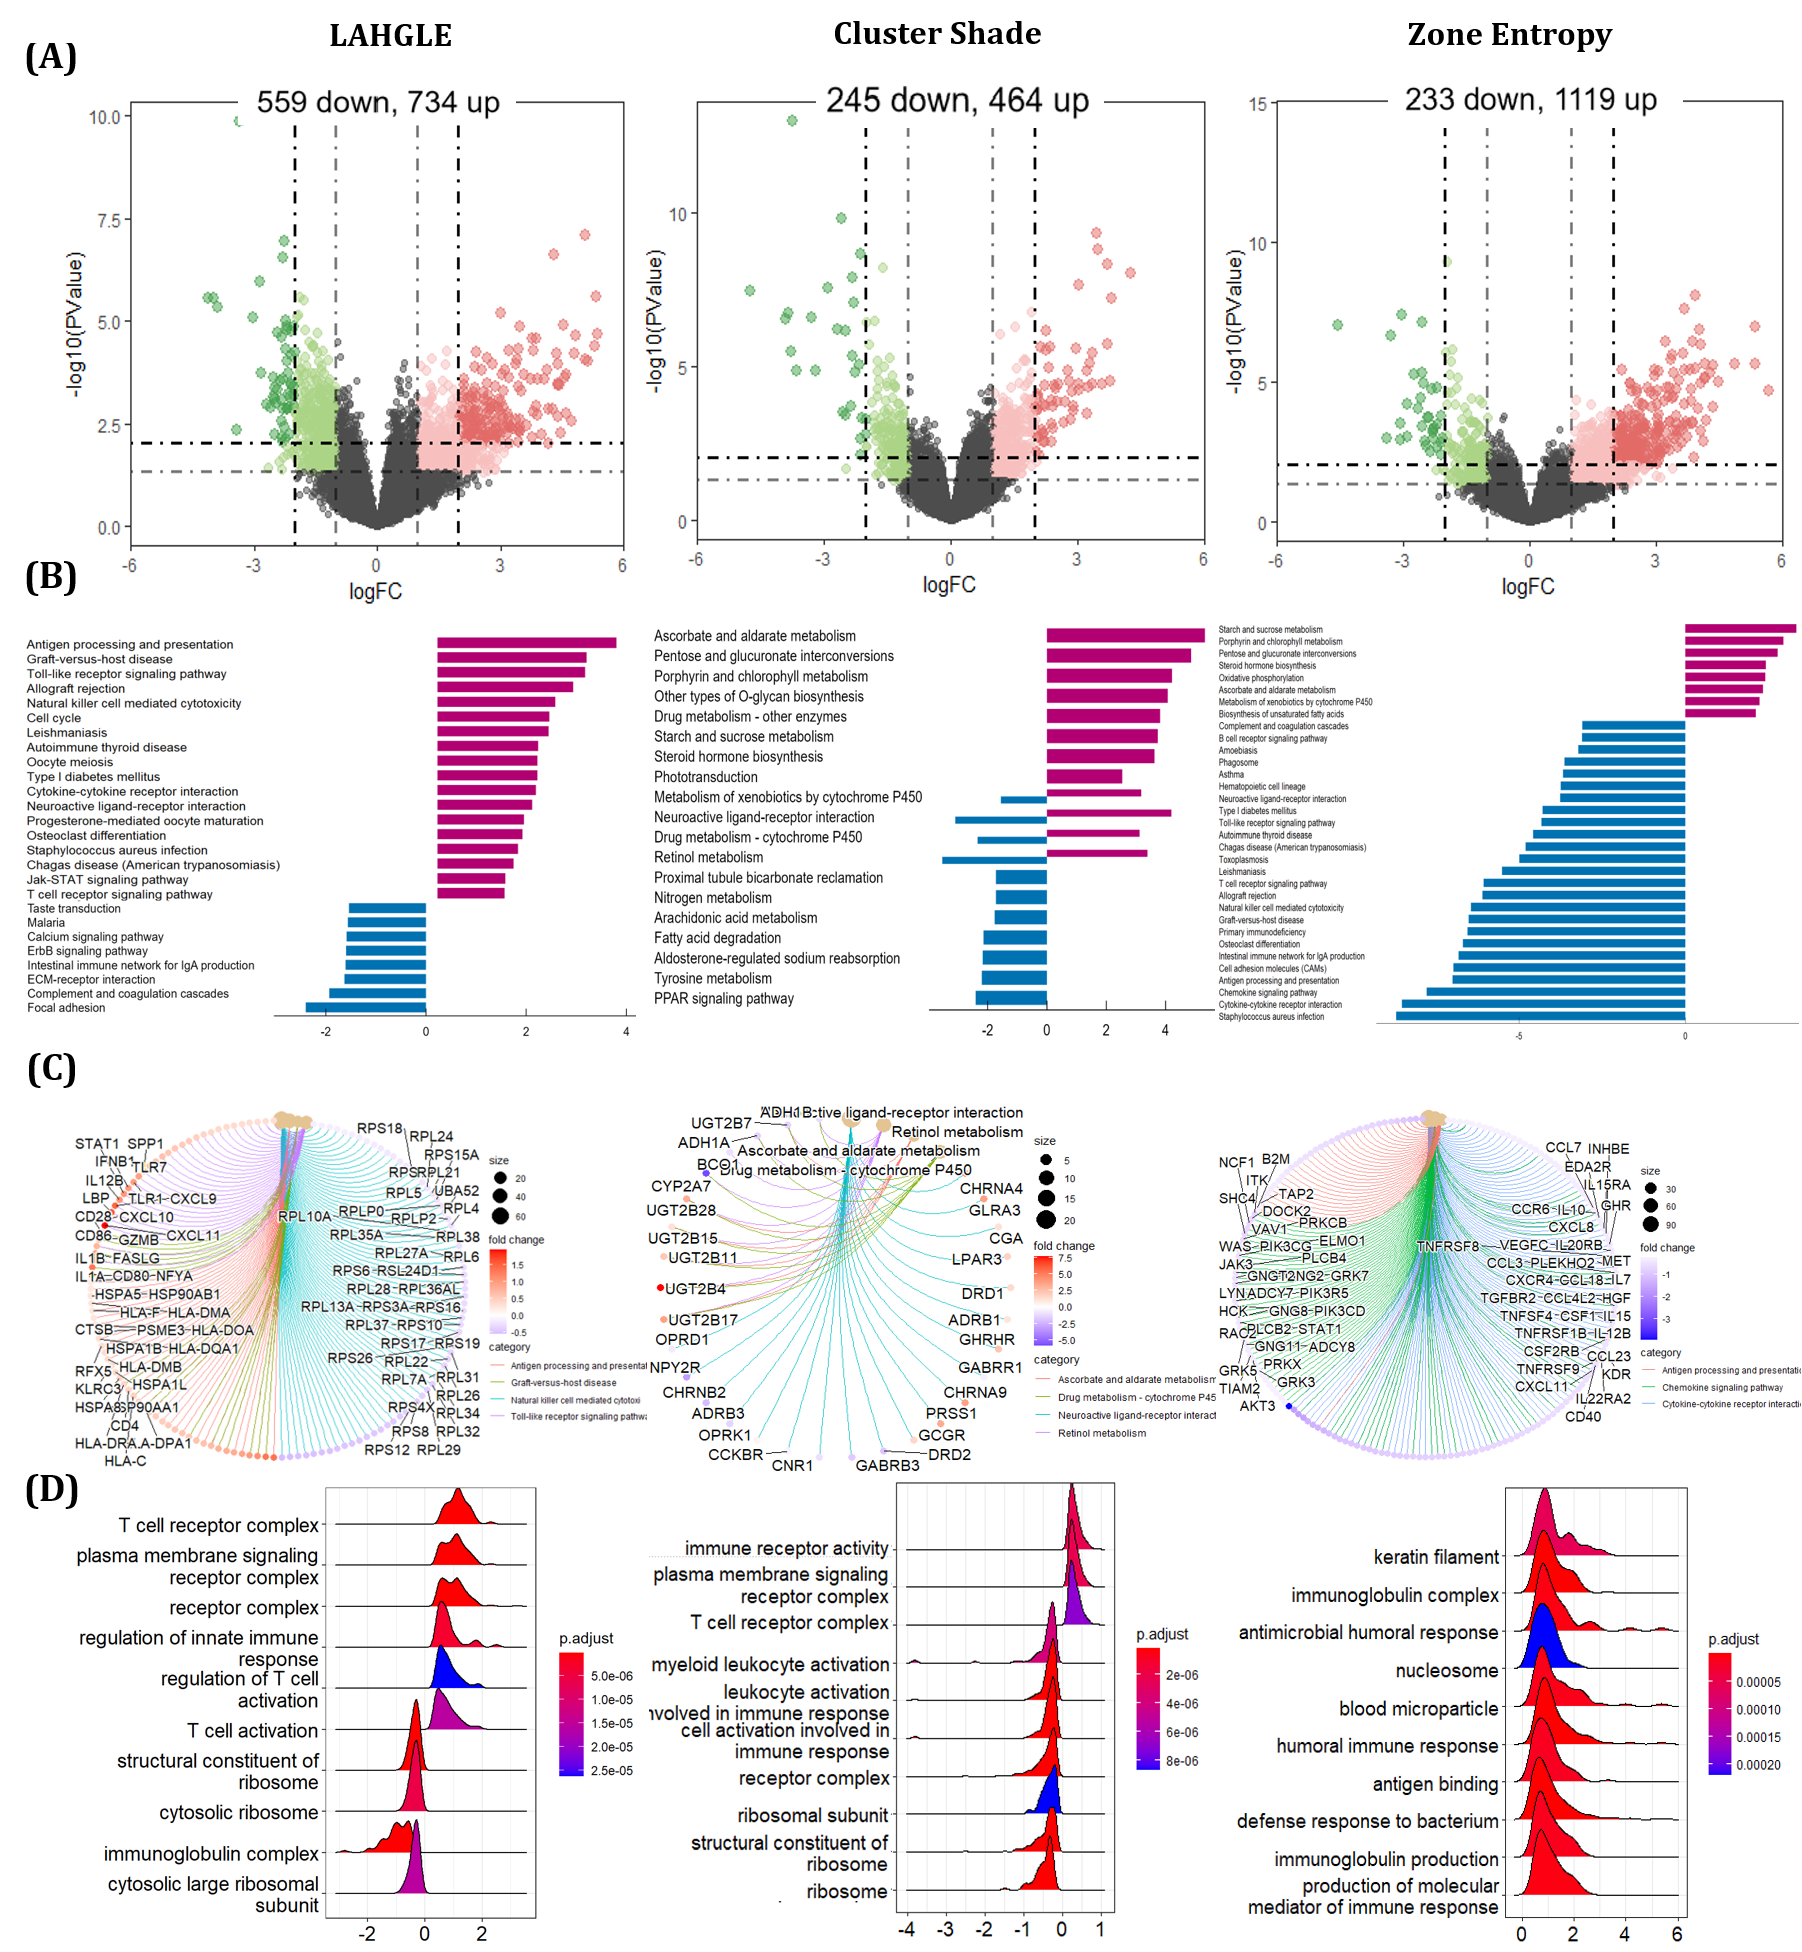
Figure 6. The biological Significance of Stable Predictive Features.
(A) Differentially expressed genes (DEGs) associated with the four stable features. (B) The bar plots display the top 20 upregulated and downregulated pathways discovered in the NAC responsive group (red) and non-responsive group (blue) through KEGG enrichment analysis of three stable features. (D) The ridge plots show that the top 10 upregulated and downregulated pathways in the NAC responsive group (x-axis >0) and non-responsive group (x-axis <0) through GO enrichment analysis of three stable features.