0411
Prospective performance of an MRI algorithm for early re-direction of breast cancer neoadjuvant treatment1Department of Radiology & Biomedical Imaging, University of California, San Francisco, San Francisco, CA, United States, 2I-SPY 2 Advocacy Group, San Francisco, CA, United States, 3Department of Pathology, MD Anderson Cancer Center, Houston, TX, United States, 4Department of Surgery, University of California, San Francisco, San Francisco, CA, United States, 5Department of Epidemiology & Biostatistics, University of California, San Francisco, San Francisco, CA, United States, 6University of California, San Francisco, San Francisco, CA, United States, 7Department of Medical Oncology, University of Pennsylvania, Philadelphia, PA, United States
Synopsis
Keywords: Breast, Cancer
Motivation: In our preliminary study of breast cancer patients undergoing neoadjuvant treatment in the I-SPY 2 TRIAL, functional tumor volume (FTV)-based algorithm using 3-week and 6-week MRI successfully identified sub-optimal responders as potential candidates for early treatment re-direction.
Goal(s): We aimed to evaluate the performance of the algorithm using data collected after the requirement for 6-week MRI based on 3-week response was officially added.
Approach: We tested PPV and sensitivity of the algorithm in 146 patients enrolled in I-SPY 2 between October 2021 and June 2022.
Results: The combined 3-week and 6-week MRI algorithm showed high PPV and high sensitivity in identifying sub-optimal responders.
Impact: In the I-SPY 2 neoadjuvant breast cancer trial, an MRI-based algorithm demonstrated its ability to identify sub-optimal responders at 6 weeks of treatment. This will impact response-based personalization of treatment in future clinical trials and ultimately treatment in the clinic.
Purpose
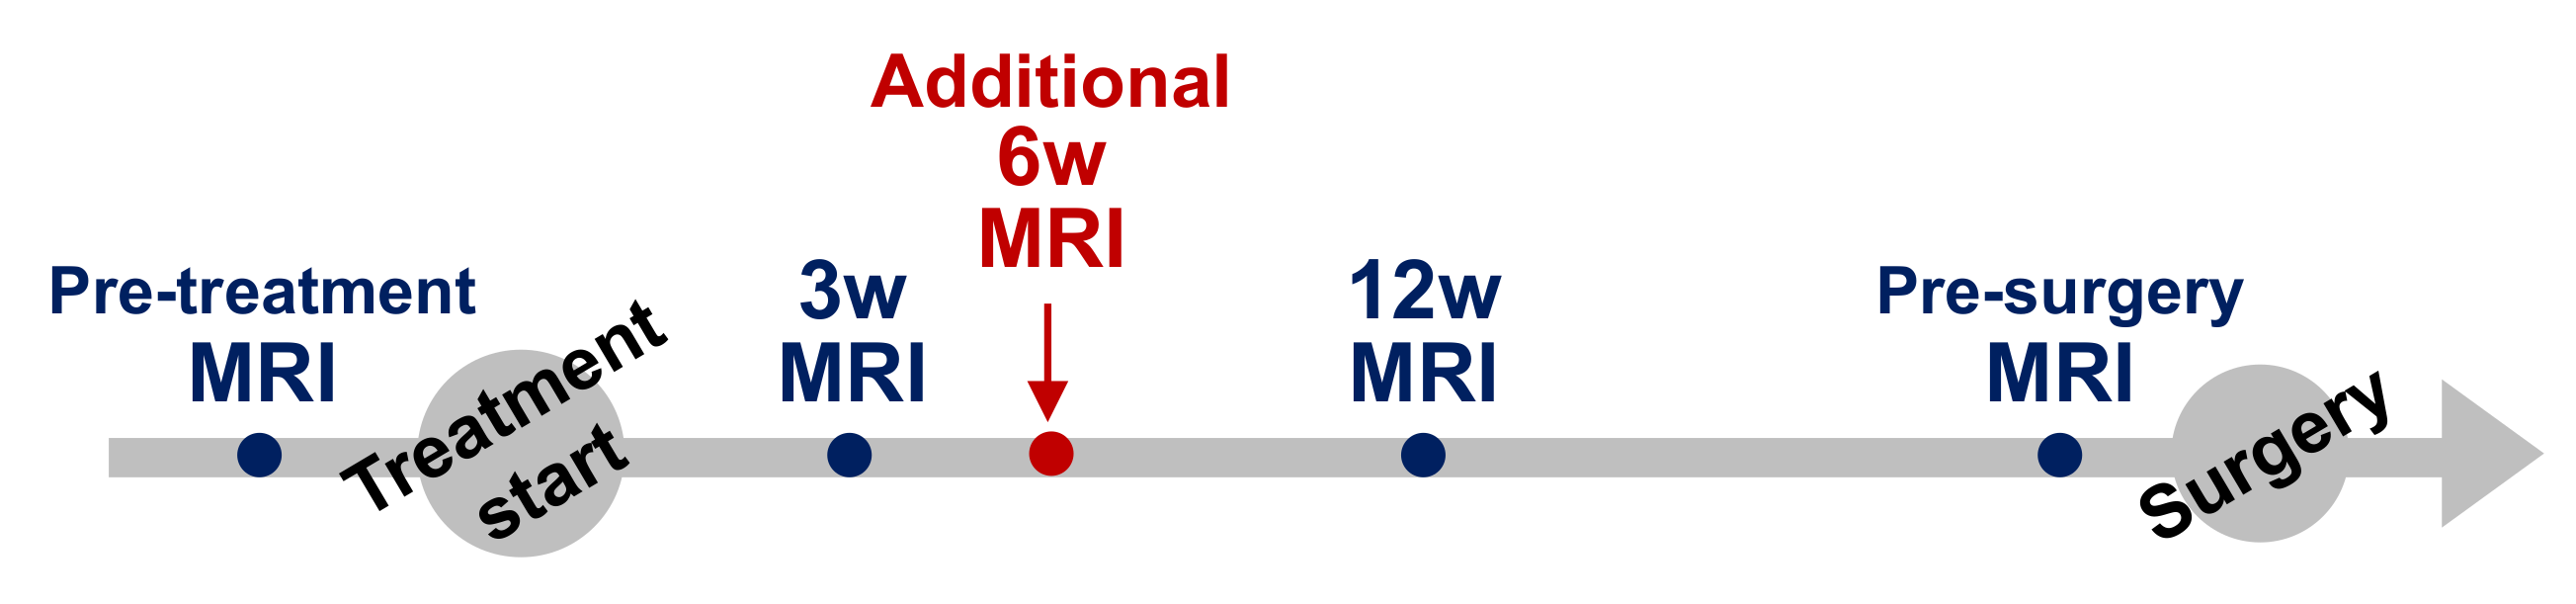
Dynamic contrast-enhanced (DCE) breast MRI is a highly sensitive imaging modality that can be used to evaluate response to neoadjuvant treatment. In the I-SPY 2 TRIAL, patients receive neoadjuvant chemo- or targeted therapy and have MRI at least four times including at pre-treatment, 3 weeks, 12 weeks, and pre-surgery (Figure 1). Functional tumor volume (FTV), a measure of tumor burden derived from breast DCE MRI1-3, has been used in treatment arm randomization and to monitor tumor response during neoadjuvant treatment in I-SPY 2.Using a cohort of I-SPY 2 patients with optional 6-week MRI data obtained at the discretion of the treating physician between December 2017 and March 2021, we conducted a preliminary analysis to test the performance of 3-week and 6-week MRI to identify sub-optimal responders4. Based on the preliminary result, a requirement for additional 6-week MRI for patients with inferior response at 3-week MRI (<30% FTV reduction) was formally added to I-SPY 2 in October 2021.
In this study, we aimed to evaluate the performance of a combined 3-week and 6-week MRI algorithm to identify sub-optimal responders in a subsequent cohort of I-SPY 2 patients.
Methods
We included 159 patients who were enrolled in I-SPY2 between October 2021 and June 2022, for whom pathological outcomes defined by residual cancer burden (RCB)5 were available as of July 2023.Standardized DCE MRI protocol in I-SPY 2 is as follows: acquisition duration 90–110 s; early phase timing 120–150 s post-contrast injection; FOV 260–360 mm; in-plane resolution ≤1.4 mm; slice thickness ≤2.5 mm. Using in-house software developed in IDL (NV5 Geospatial Solutions, Inc., Broomfield, CO), FTV was calculated by summing all voxels with early percent enhancement (PE, ~150 s post-contrast injection) above 70% and signal enhancement ratio above zero within a manually delineated 3-dimensional bounding box as described in the literature3.
RCB is a continuous measure of response, reflecting the degree of residual tumor and highly predictive of event free and distant free survival5. RCB 0 (pCR) and RCB I (minimal residual disease) reflect excellent responders, whereas RCB II and III reflect sub-optimal responders in I-SPY 2.
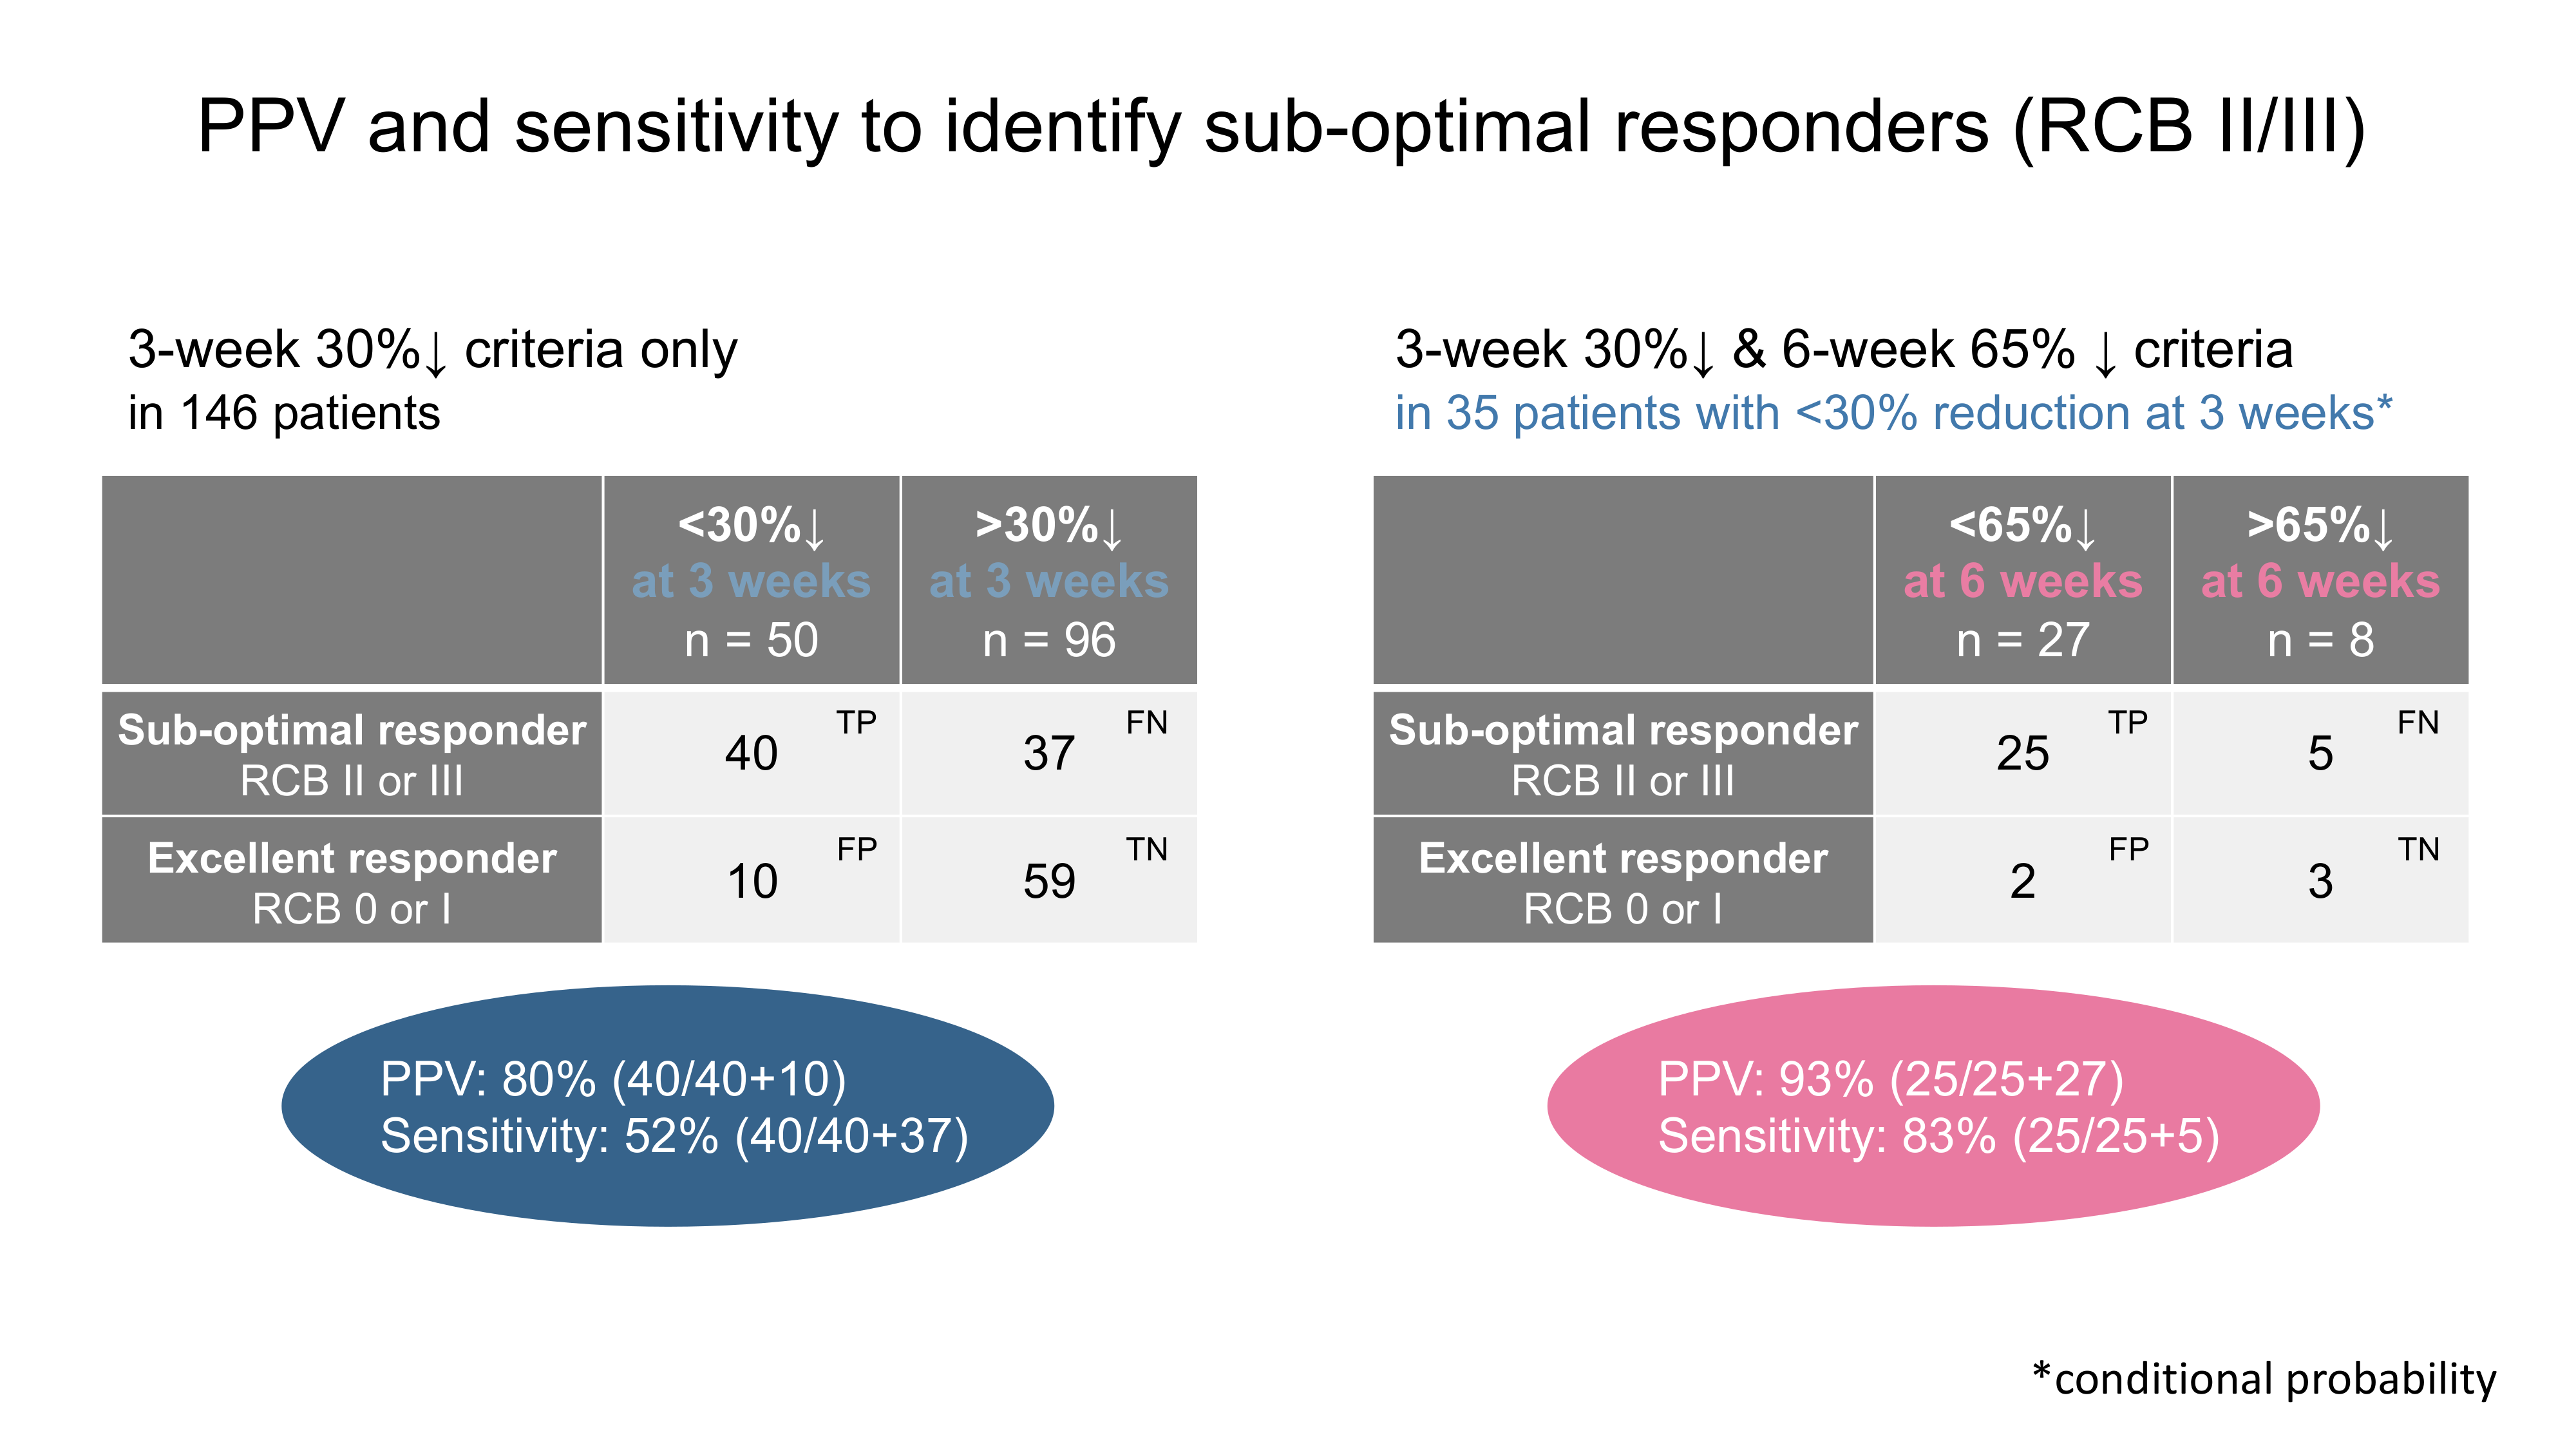
The performance of identifying sub-optimal responders using an MRI algorithm was assessed by positive predictive value (PPV) and sensitivity. For the combined 3-week and 6-week MRI algorithm, patients with <30% FTV reduction at 3-week MRI & <65% FTV reduction at 6-week MRI were evaluated as “test positive” and < 30% FTV reduction at 3-week MRI & > 65% FTV reduction at 6-week MRI as “test negative.
Results
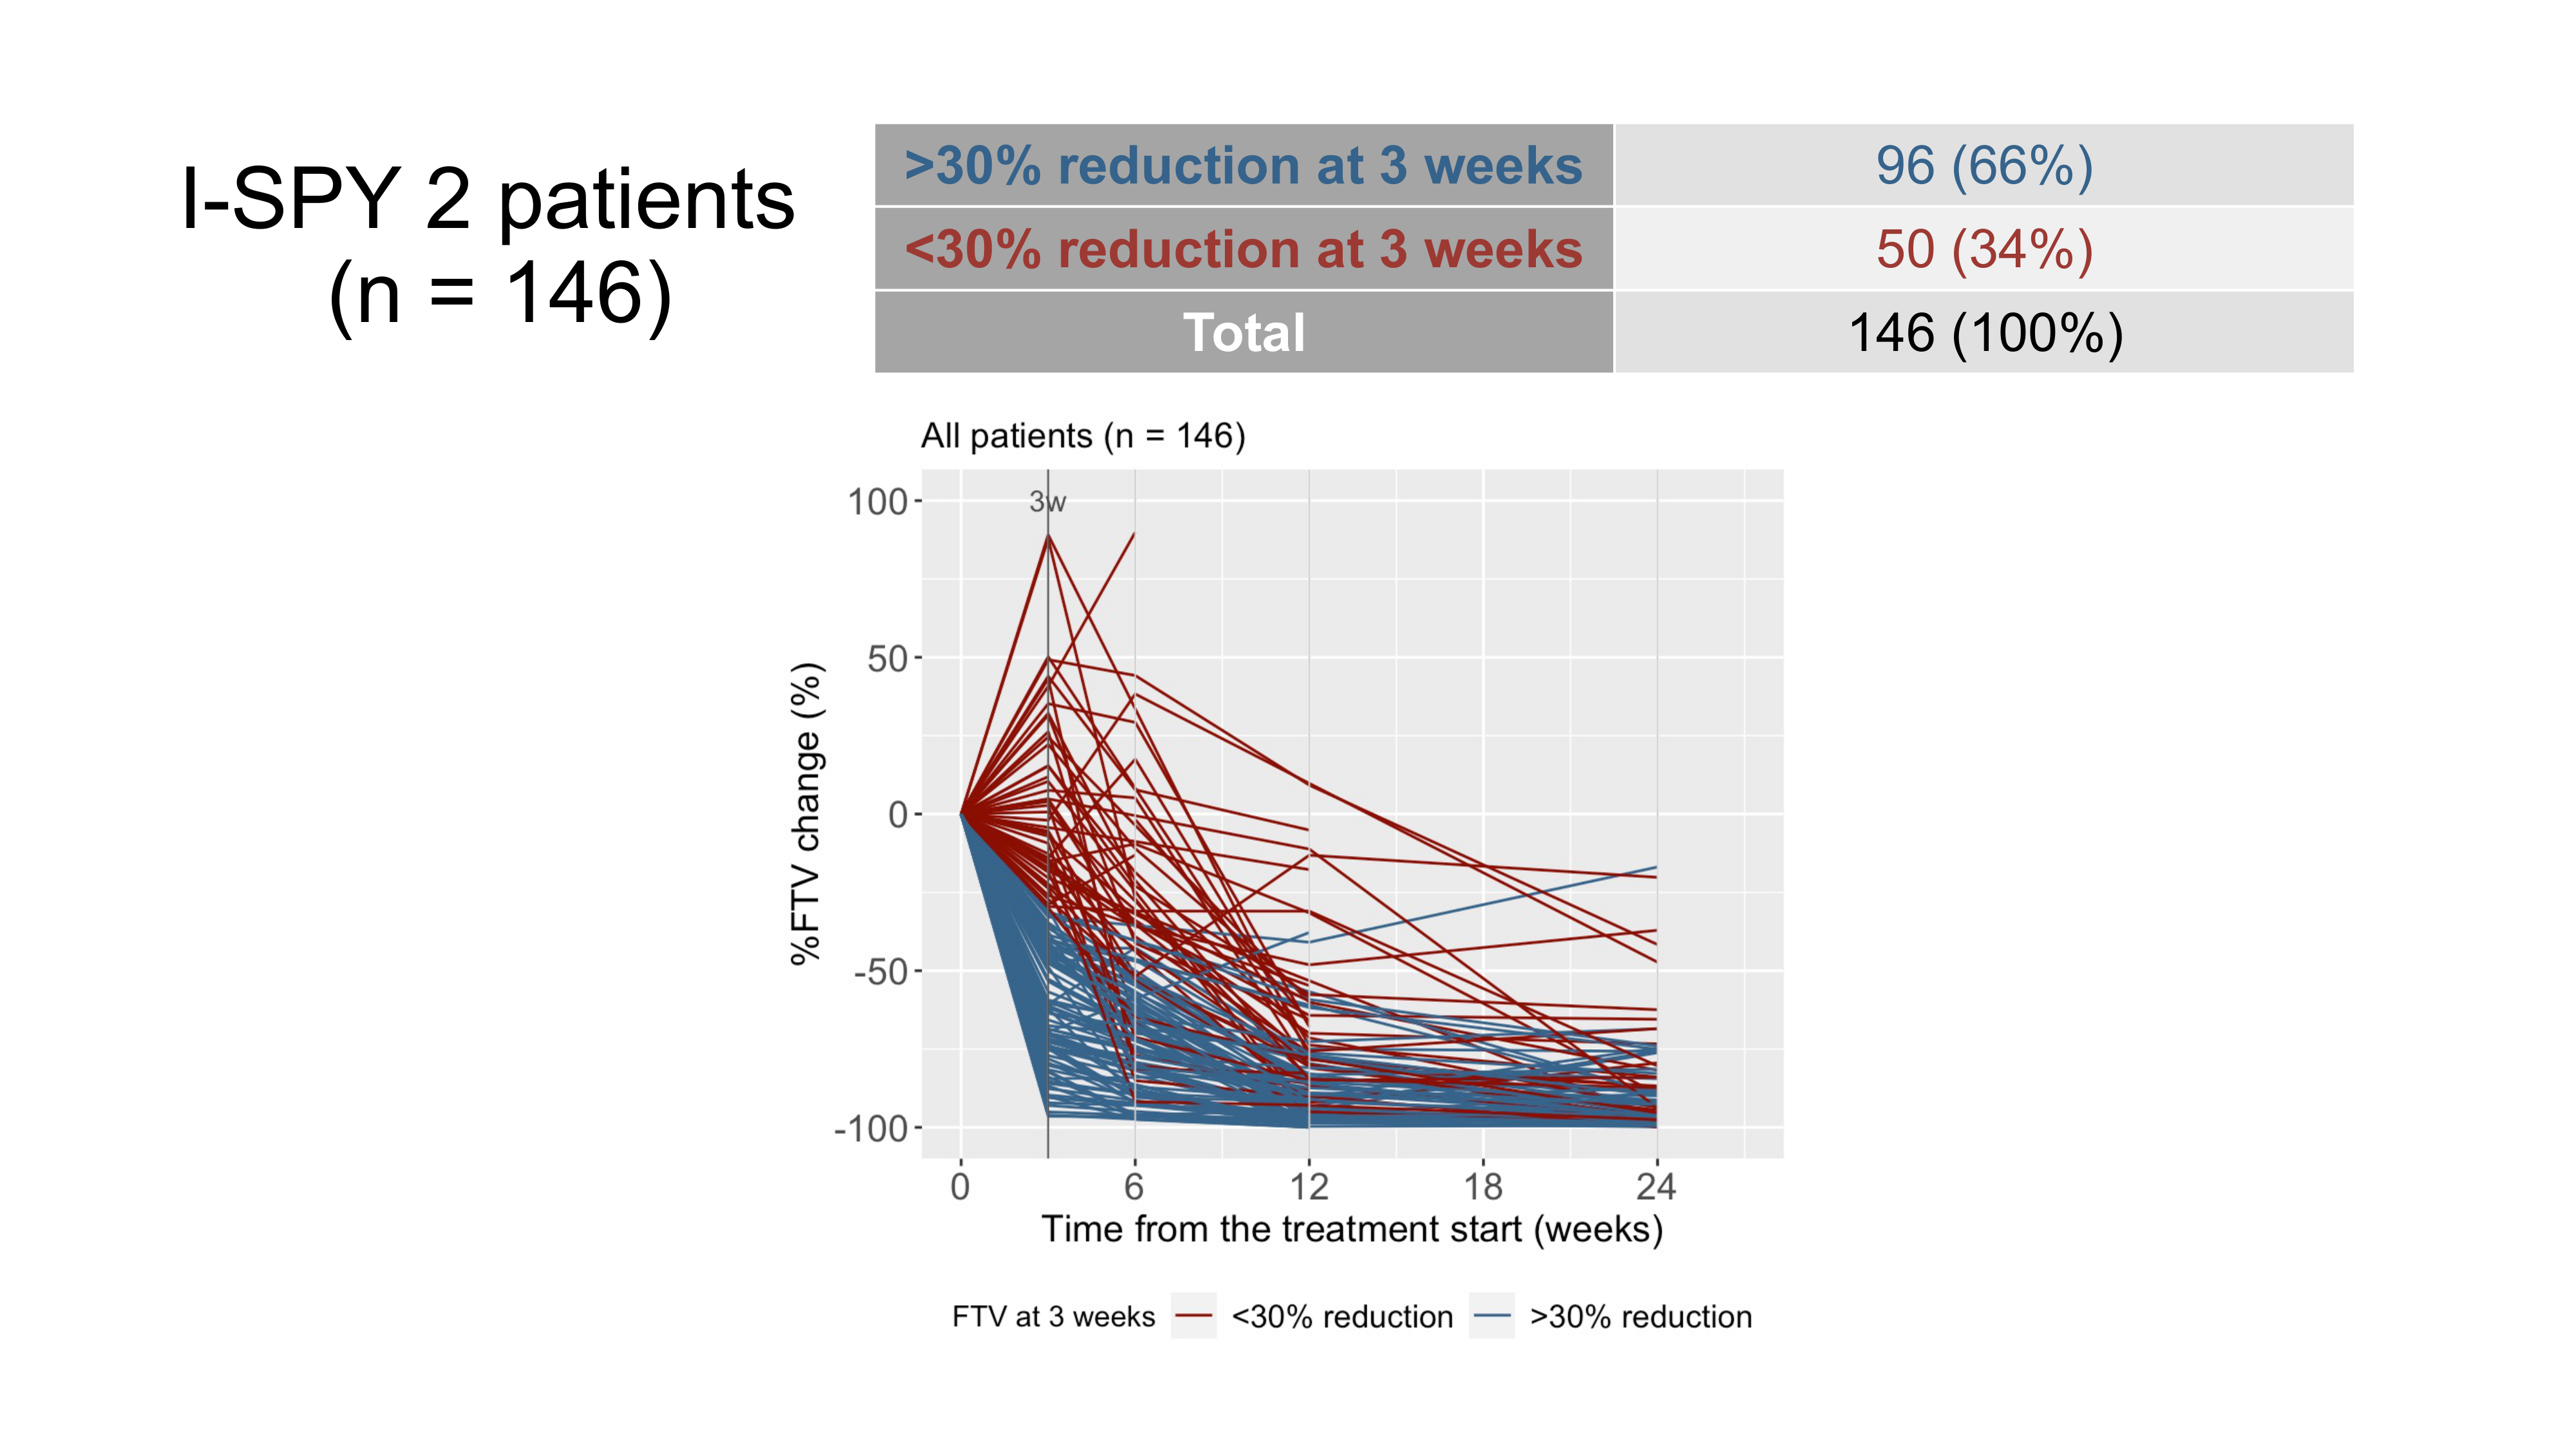
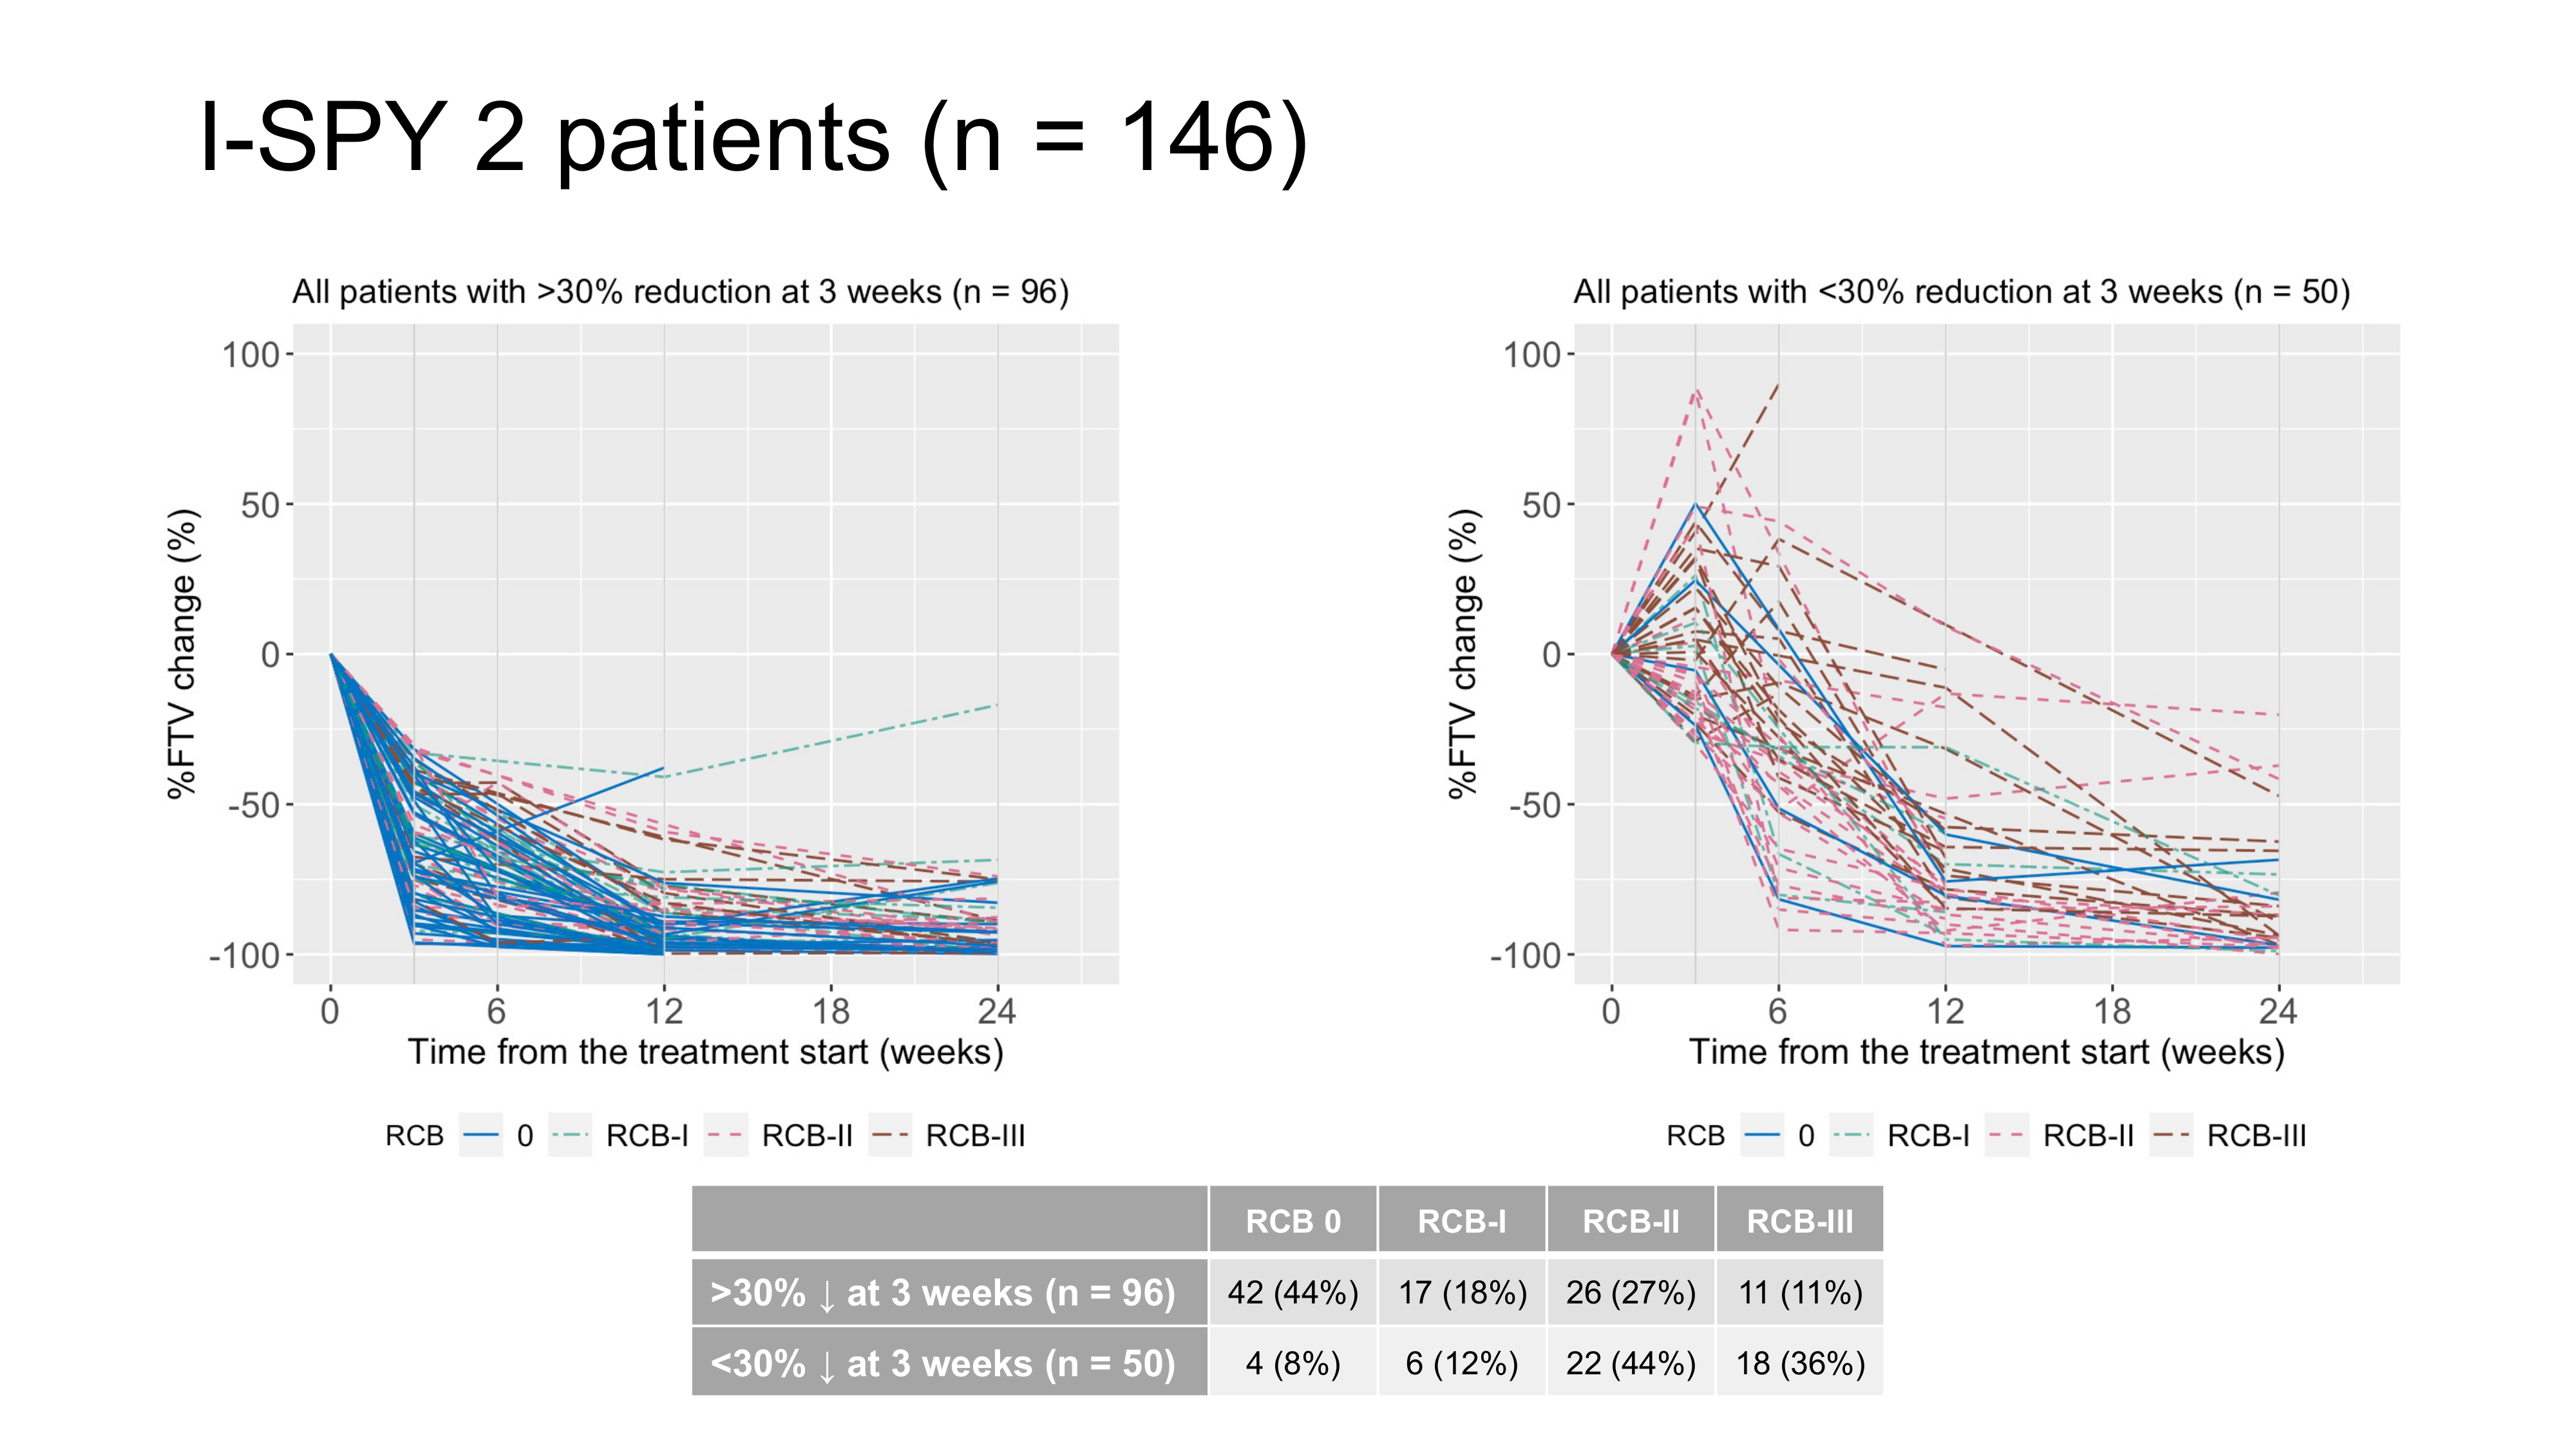
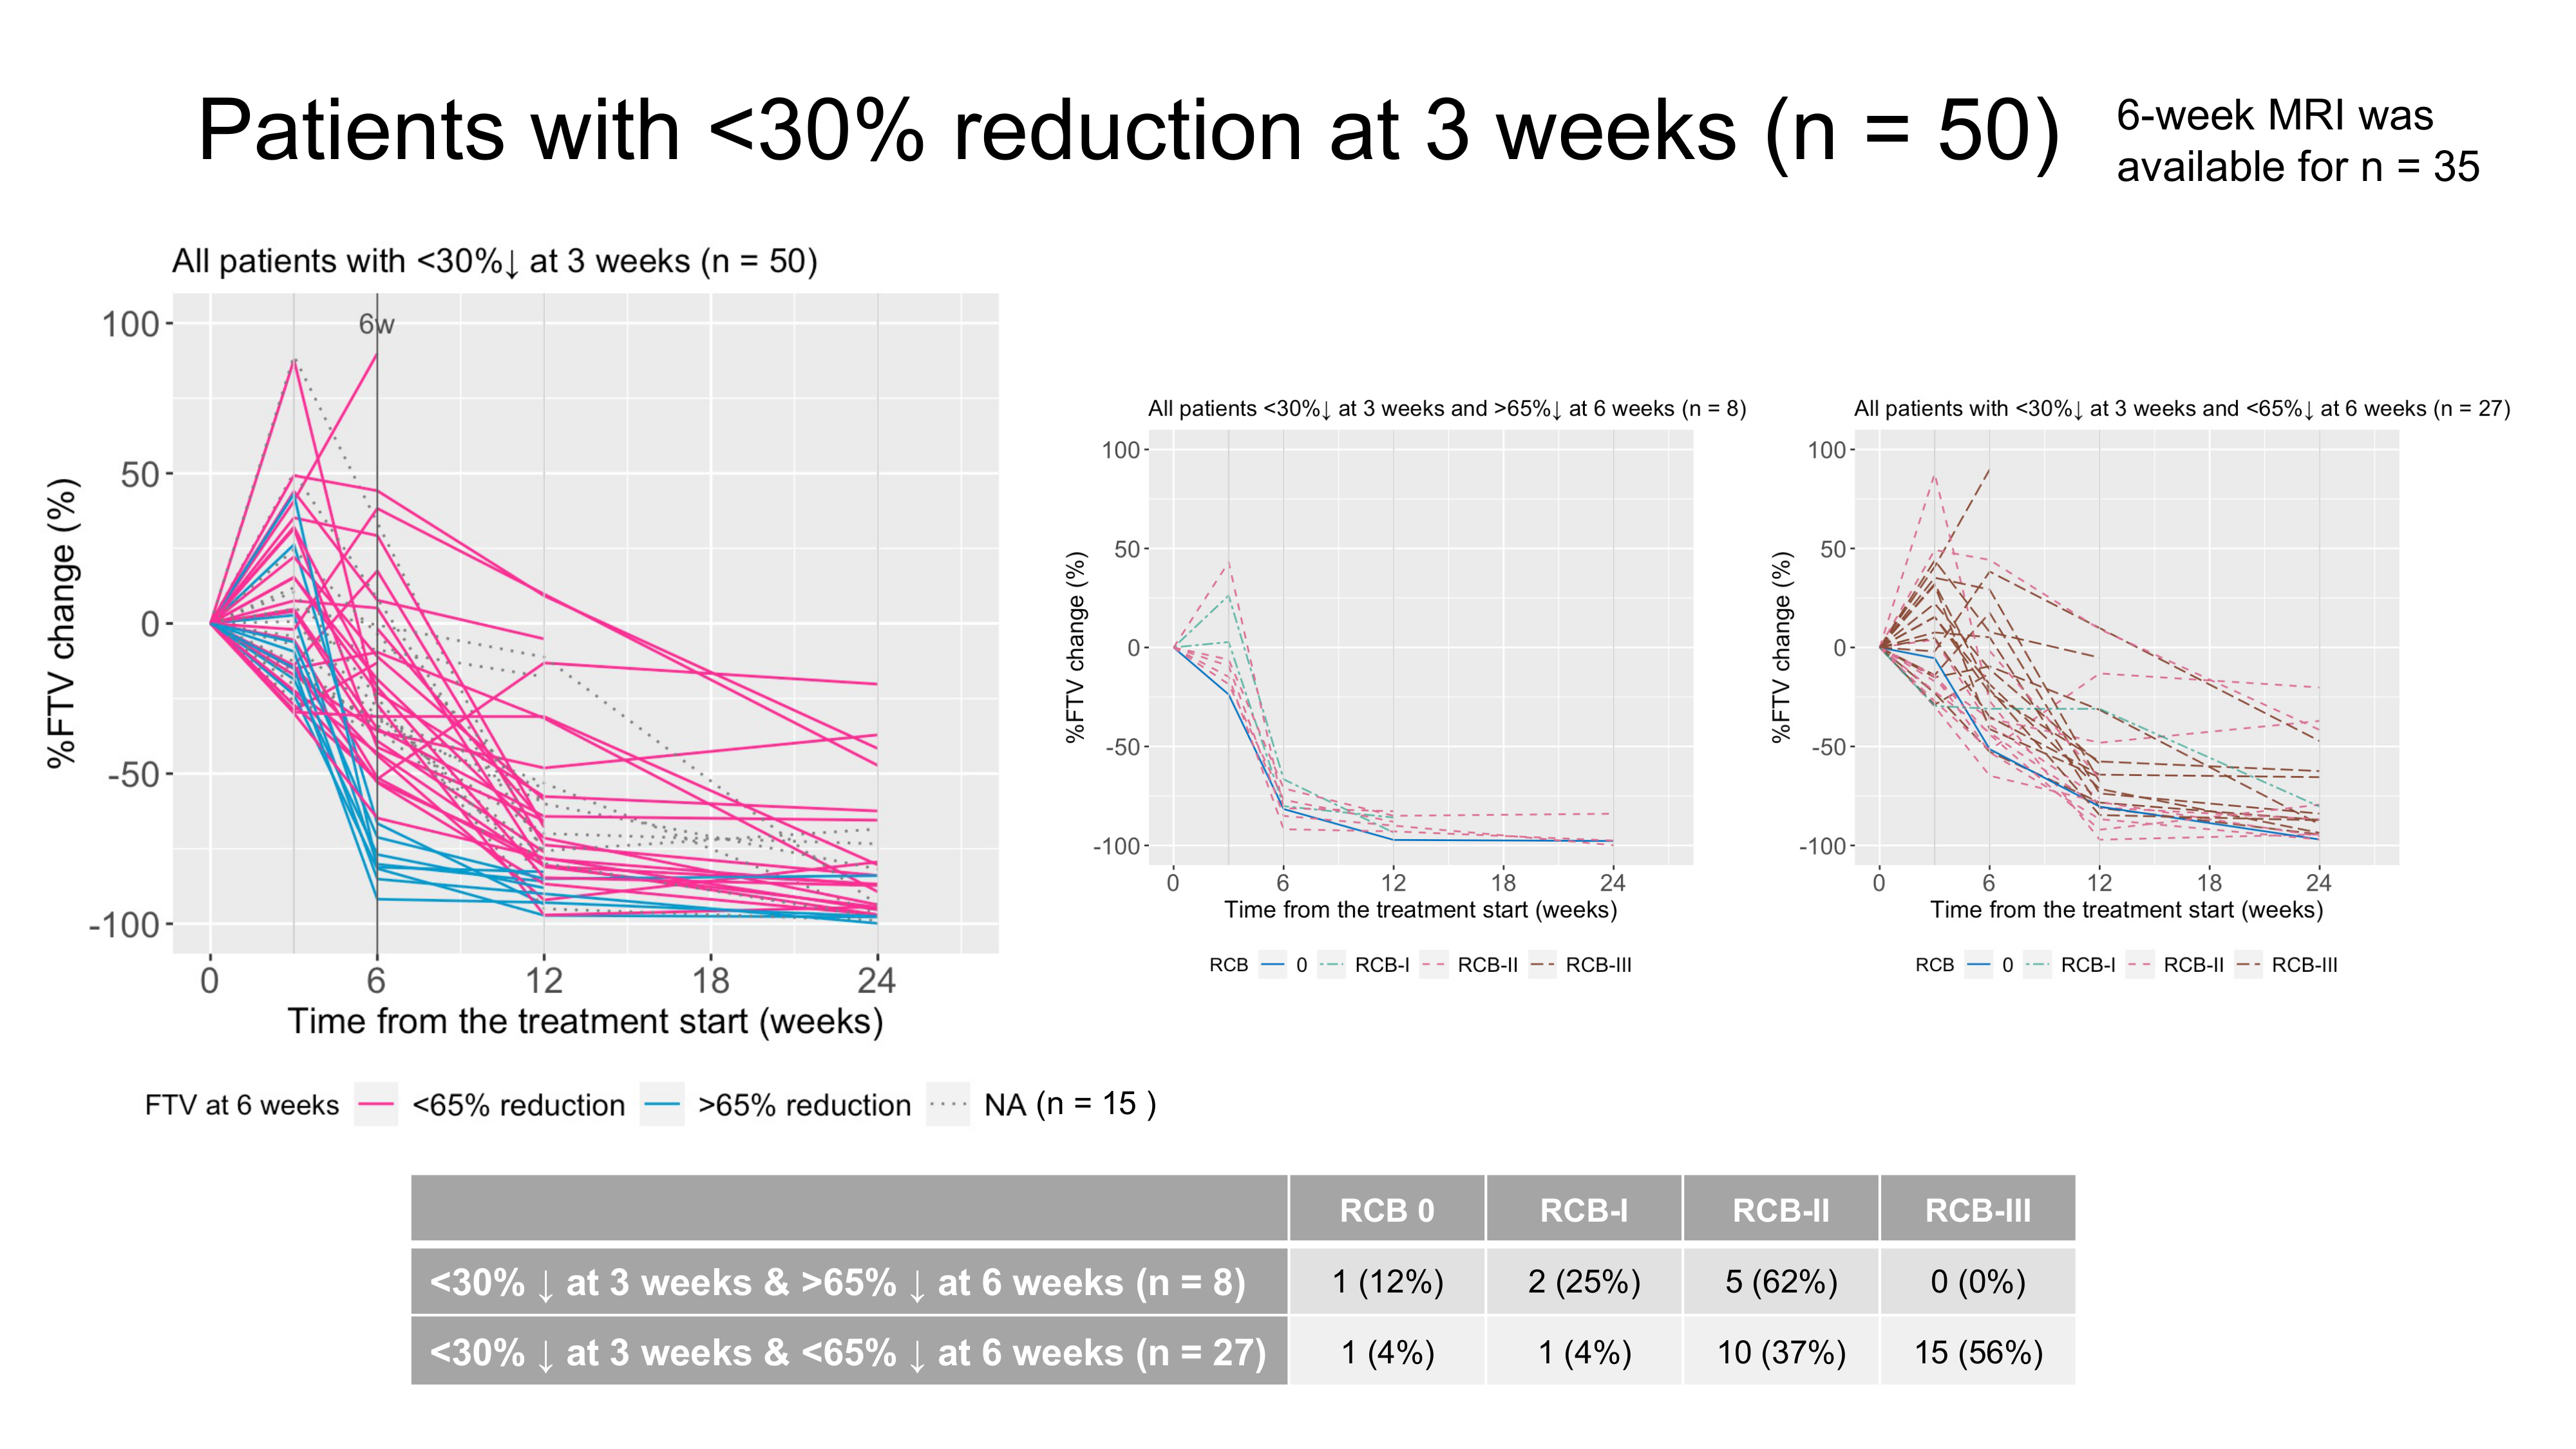
Of the 159 patients, 146 patients who had analyzable FTVs both at pre-treatment MRI and 3-week MRI were included. In the 146 patients, 3-week FTV reduction was <30% for 50 patients (RCBII/III, n = 40; RCB0/I, n = 10) and >30% for 96 patients (RCBII/III, n = 37; RCB0/I, n = 59) (Figures 2 and 3). The 3-week only criteria showed PPV of 80% and sensitivity of 52%. Of the 50 patients, 6-week MRI was available for 35 patients. The 35 patients with 3-week FTV reduction of <30% were dichotomized to either “test positive” group or “test negative” group based on the 6-week FTV reduction. Figure 4 shows the RCB results for both groups: there were 27 patients with <30% reduction at 3 weeks & < 65% reduction at 6-weeks (RCBII/III, n = 25; RCB0/I, n = 2) and 8 patients with <30% reduction at 3 weeks & >65% reduction at 6-weeks (RCBII/III, n = 5; RCB0/I, n = 3). As shown in Figure 5, the combined FTV criteria detected sub-optimal responders with PPV of 93% and sensitivity of 83%.Discussion & Conclusion
In this analysis, we evaluated the cohort of patients enrolled in I-SPY 2 after the requirement for 6-week MRI based on response at 3-week MRI was officially added. The combined “<30 % FTV reduction at 3-week AND <65 % FTV reduction at 6-week” algorithm showed high PPV and high sensitivity in early detection of sub-optimal responders in this cohort, in line with the preliminary study.Early treatment re-direction seeks to determine the best possible care for each patient by tailoring treatment during the early timepoints of neoadjuvant therapy6. Patients with sub-optimal early responses are offered the chance to be reassigned to potentially more effective agents. Since June 2022, the ongoing I-SPY 2 TRIAL has been actively engaged in the prospective assessment and validation of a response-based treatment re-direction strategy using the combined 3-week and 6-week MRI algorithm assessed in this study. We will continuously strive to create a more precise algorithm to further optimize the effectiveness of the strategy.
Acknowledgements
- This research was supported by NIH grants P01 CA210961, R01 CA132870, U01 CA225427.
- We would like to thank all patients who participated in the I-SPY 2 TRIAL, working group chairs, investigators, and study coordinators from all participating sites for their contributions.
References
- Hylton NM, Blume JD, Bernreuter WK, et al. Locally advanced breast cancer: MR imaging for prediction of response to neoadjuvant chemotherapy--results from ACRIN 6657/I-SPY TRIAL. Radiology 2012; 263: 663–72.
- Hylton NM, Gatsonis CA, Rosen MA, et al. Neoadjuvant Chemotherapy for Breast Cancer: Functional Tumor Volume by MR Imaging Predicts Recurrence-free Survival-Results from the ACRIN 6657/CALGB 150007 I-SPY 1 TRIAL. Radiology 2016; 279: 44–55.
- Hylton NM. Vascularity assessment of breast lesions with gadolinium-enhanced MR imaging. Magn Reson Imaging Clin N Am 1999; 7: 411–20, x.
- Onishi N, Gibbs J, Li W, et al. Abstract: Early treatment re-direction based on functional tumor volume at 3 and 6-week MRI for breast cancer patients undergoing neoadjuvant chemotherapy. In: The 30th Joint Annual Meeting ISMRM-ESMRMB & ISMRT Annual Meeting, London, UK, May 7-12, 2022.
- Symmans WF, Peintinger F, Hatzis C, et al. Measurement of residual breast cancer burden to predict survival after neoadjuvant chemotherapy. J Clin Oncol 2007; 25: 4414–22.
- Esserman LJ. Personalization of treatment is the way forward in care and trials. Clin Cancer Res 2020; published online April 7. DOI:10.1158/1078-0432.CCR-20-0604.
Figures