0409
In vivo CEST-MRI Parameters correlate to Transcriptome and Metabolic Features in Breast Lesions1Radiology, UT Southwestern Medical Center, Dallas, TX, United States, 2Peter O'Donnell Jr. School of Public Health, UT Southwestern Medical Center, Dallas, TX, United States, 3Pathology, UT Southwestern Medical Center, Dallas, TX, United States, 4Philips Healthcare, Gainesville, FL, United States, 5Philips Research, Hamburg, Germany
Synopsis
Keywords: Breast, Breast, CEST, Biomarkers, Cancer, Tissue Characterization
Motivation: CEST-MRI could provide biochemical and molecular information on breast lesions before detection of physiological and anatomical changes.
Goal(s): Our goal is to identify suitable in vivo CEST-MRI biomarker candidates.
Approach: 12 patients with 6 benign and 8 malignant lesions (pathology confirmed) who had concurrent CEST-MRI, transcriptome, and metabolomic data were included.
Results: Expression of several genes and metabolites correlated with MTRasym values (P<0.05) at 1, 2, and 3.5 ppm. At 1 and 2 ppm, DNA damage, cell cycle, stress response, and small molecule metabolic processes were prominently represented. Specific metabolites (e.g., Citrate/Isocitrate, glucuronate) showed significant correlations at 1, 2, and 3.5 ppm.
Impact: In vivo CEST-MRI parameters are reflective of transcriptome and metabolomic features in breast lesions. This provides molecular information, potentially before the detection of physiological and anatomical changes, and could facilitate accurate prediction of response to therapy allowing earlier interventions.
Introduction
Breast cancer is the most common cancer and the second leading cause of cancer death in women. There is a critical need for non-invasive imaging techniques for accurate prediction of therapy response and cancer recurrence. Existing MRI methods such as DCE provides morphological and vascular information while DWI provides cellular density.1 CEST-MRI could provide complementary biochemical and molecular information on breast lesions before physiological and anatomical changes are detectable. The purpose of this study was to identify in vivo CEST biomarker candidates that are reflective of transcriptome and metabolic features of breast lesions.Methods
This prospective IRB-approved study enrolled 44 patients with suspected BI-RADS 4-5 lesions and referred to biopsy (2019-2022). After written informed consent, all patients underwent research MRI prior to biopsy, performed as standard of care. Additional biopsy samples were collected from a subset of patients (n=12) and snap frozen for transcriptome and metabolic analyses. CEST-MRI: 3T MRI (Ingenia, Philips Healthcare), 16-channel breast coil, 2D multi-slice, multi-shot T1-TFE, 3-point multi-echo Dixon [TR/TE1/ΔTE = 5.2/1.58/1.0 ms]. CEST parameters: B1rms=1.17 μT, 40 hyperbolic secant pulses, 50 ms each, total saturation length 2 sec, enabled by alternated parallel transmission,2 33 point Z-spectrum [±6 ppm relative to water]. Imaging parameters: centric ordering, voxel size=2x2x5 mm, 3 slices, FA=10o. Custom Matlab routines including B0 correction and Z-spectra were used for pixel-wise CEST analysis and MTRasym maps obtained by the asymmetry curve integration in 3 frequency ranges: (i) 1±0.2 ppm (hydroxyl groups), (ii) 2±0.2 ppm (amines or guanidinium), (iii) 3.5±0.2 ppm (amides). Regions-of-interest (ROIs) were drawn by a breast fellowship‐trained radiologist (>5 years of experience). Transcriptome analysis: High quality total RNA (RIN>7) was isolated using an established protocol3 and subjected to Illumina RNA sequencing platform. Gene read counts were log-scaled and quantile normalized to generate expression levels. Targeted Metabolomic analysis: Soluble metabolites were extracted and analyzed with liquid chromatograph/triple quadrupole mass spectrometer using established protocol.4 Total ion count (TIC) normalization was performed where all metabolites in a sample were divided by the total number of ions observed in that sample. Statistics: Ranked Spearman correlations (ρ) were performed between MTRasym values and normalized gene expression or normalized metabolite levels, using R with P<0.05 as statistically significant. Gene set enrichment analyses (GSEA) were performed on ranked genes or metabolites based on ρ values with false discovery rate (FDR)<0.05 as statistically significant.Results
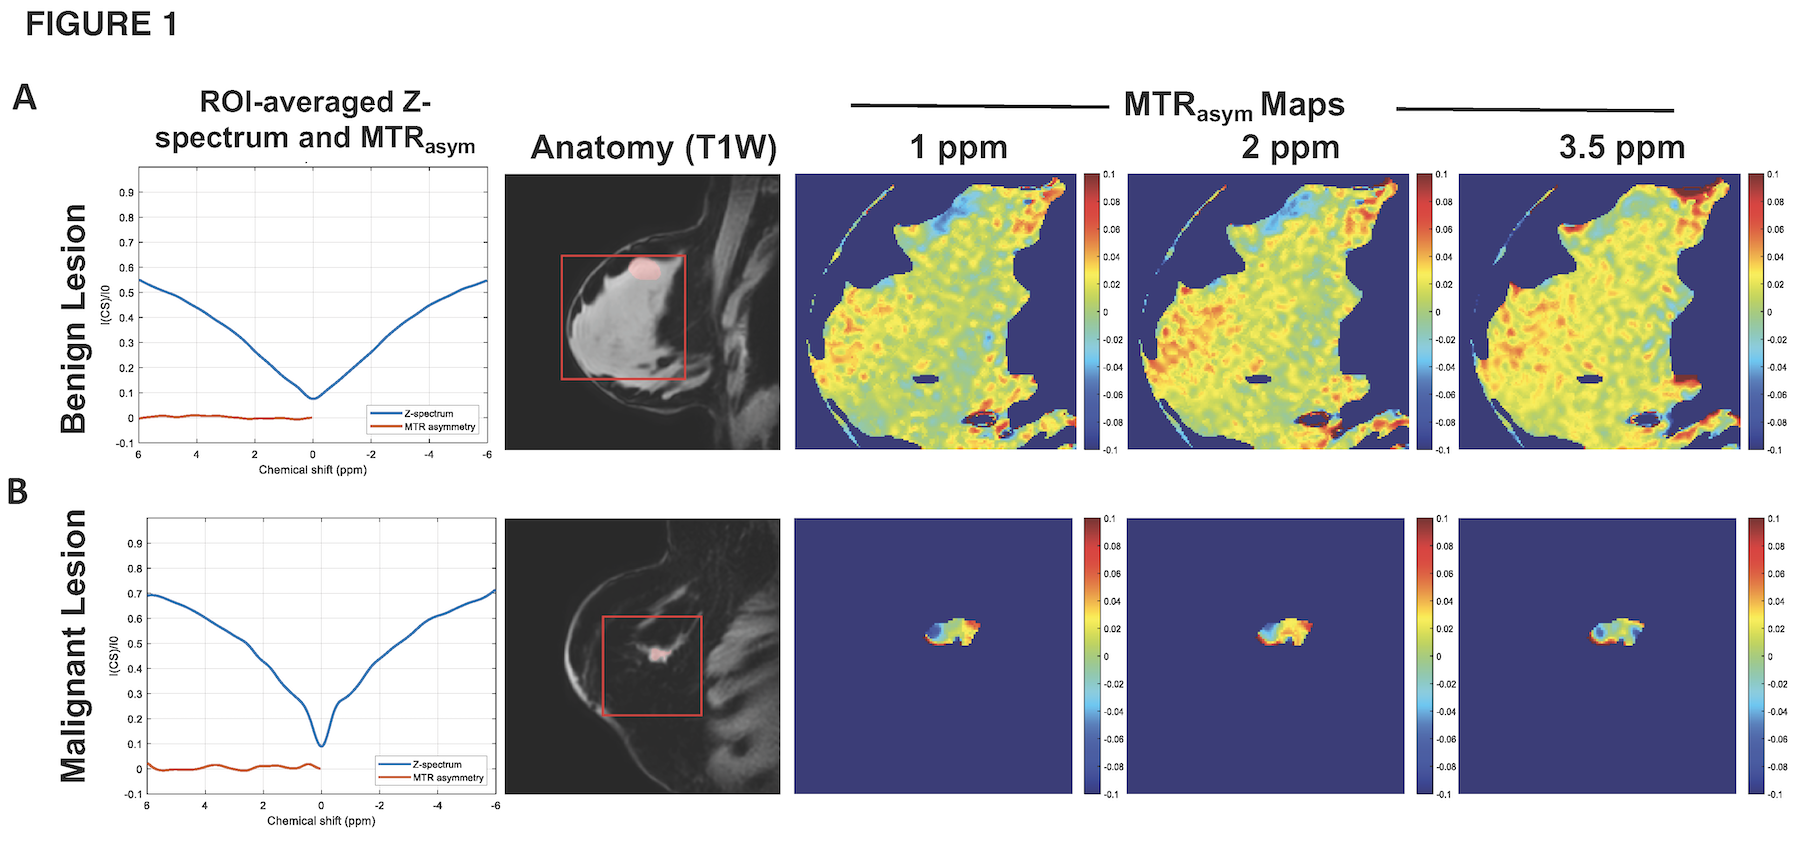
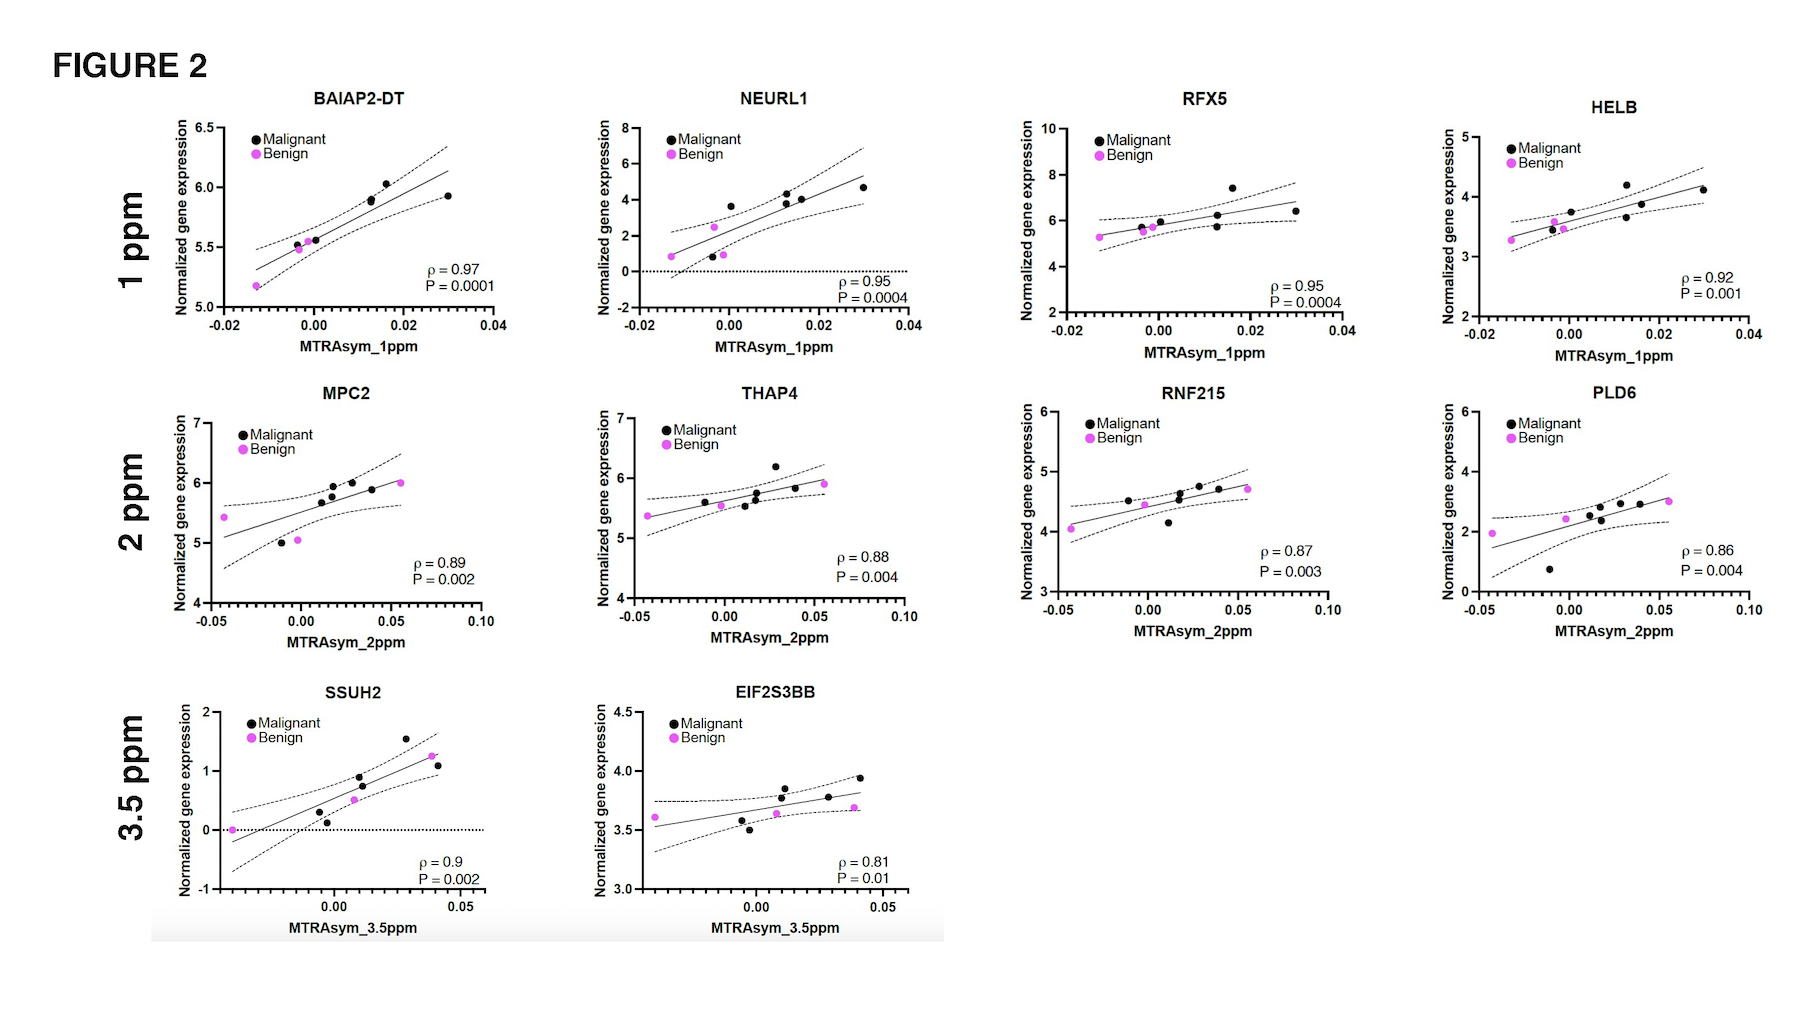
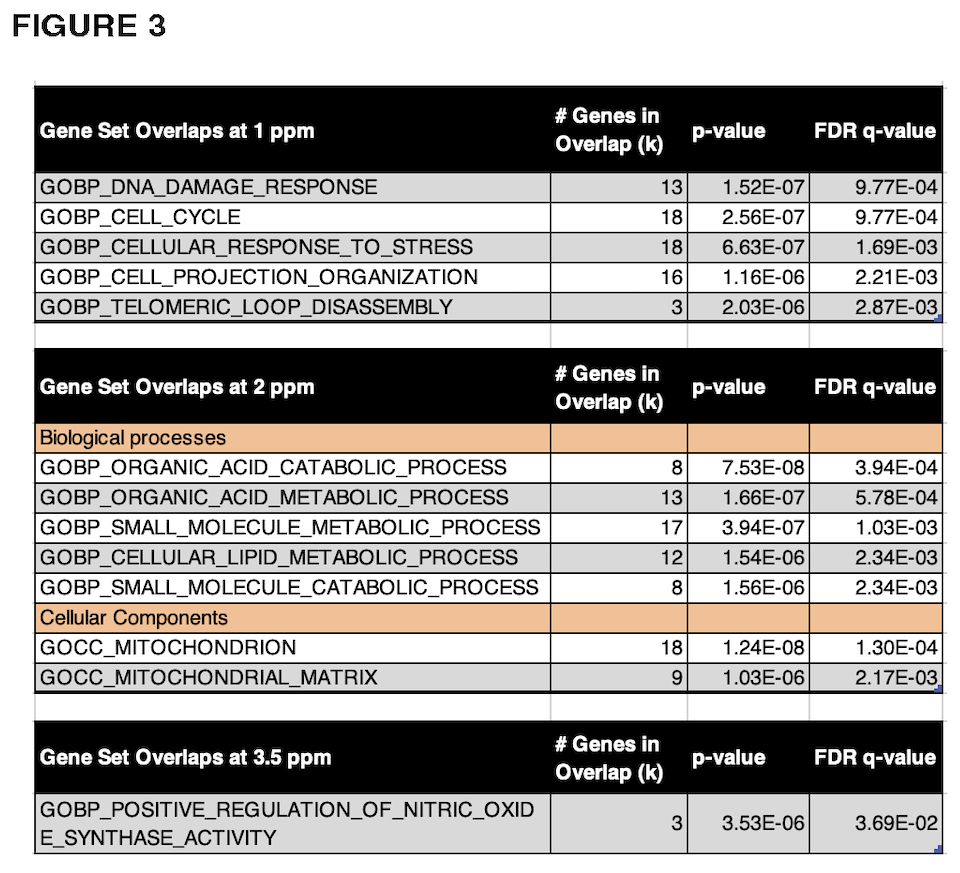
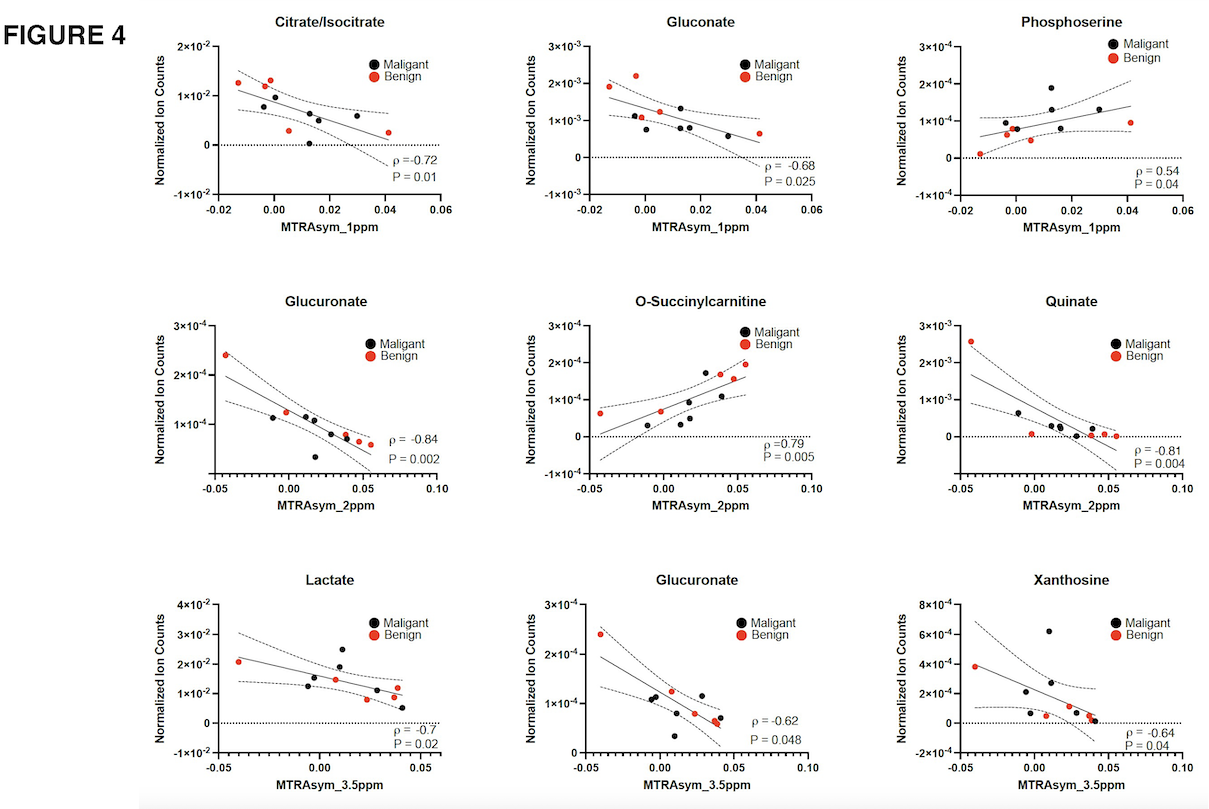
Twelve patients (6 benign and 8 malignant lesions, histology confirmed) had concurrent CEST-MRI, transcriptome, and metabolic data. Fig. 1 demonstrates CEST results from two representative patients (benign and malignant [Invasive Mammary Carcinoma, Nottingham grade 2]). Our initial analysis indicates increased MTRasym values in patients with aggressive malignancy compared to benign pathology aligning with previously reported studies.5,6 Gene expression data identified >60000 transcripts including protein coding, miRNA, and IncRNA. Spearman ranked correlation (ρ>|0.67|, P<0.05) showed 1037 genes (1 ppm), 491 genes (2 ppm), and 84 genes (3.5 ppm) positively correlated; and 690 genes (1 ppm), 182 genes (2 ppm), and 53 genes (3.5 ppm) negatively correlated with MTRasym values (Fig 2). GSEA identified overlapping biological processes of the positively correlated genes with all MTRasym maps (Figure 3). Positively correlated genes at 1 ppm showed prominent overlap with DNA damage, cell cycle, and cellular stress response processes (False Discovery Rate (FDR)<0.005), and at 2 ppm showed overlap with small molecule and lipid metabolic process, and mitochondrial cellular component (FDR<0.005). Of note, positively correlated genes at 3.5 ppm showed weak overlap with nitric oxide synthase activity (FDR<0.05). Metabolomic analysis detected 234 metabolites, out of which 3,2,1 metabolite(s) positively correlated, and 3,6,6 metabolites negatively correlated with MTRasym values at 1, 2, and 3.5 ppm respectively (P<0.05). We observed significant correlations with specific metabolites such as Kreb’s cycle intermediate (Citrate/Isocitrate), glucose derivative (glucuronate), derivative of purine metabolite (xanthosine), and O-Succinylcarnitine, a metabolite involved in fatty acid degradation process (all P<0.05, ρ>|0.54|) (Figure 4).Discussion
Several biological processes were prominently represented in transcriptome correlative data at 1 and 2 ppm ranges, and specific metabolites significantly correlated across all ppm ranges. Ongoing improvements to CEST-MRI acquisition and processing may influence these results, nevertheless, these data support a potential role for CEST-MRI parameters to reflect changes at the molecular level in breast lesions, and warrants further validation of the biomarker candidates.Conclusion
These preliminary findings indicate that in vivo CEST-MRI parameters are reflective of transcriptome and metabolic features in human breast lesions. This study is a step towards providing molecular information spatially and non-invasively on the whole tumor level and could facilitate accurate prediction of response to therapy using MRI7 allowing earlier interventions.Acknowledgements
Funding support: Cancer Prevention and Research Institute of Texas (CPRIT) grant RP180031 (E.V), NIH R01CA252281 (E.V) and UTSW Charles Pak Breast Cancer-Bone Initiative grant (D.U). We would like to thank all patients for their participation in this study and the CRO team for their assistance with IRB and patient recruitment, and MR technologists, Abey Thomas, RT(MR), and Courtney Dawson, RT(MR), for their help in human imaging.References
1. Mann RM, Cho N, Moy L. Breast MRI: State of the Art. Radiology 2019;292:520-36.
2. Keupp J, Baltes C, Harvey PR, van den Brink J. Parallel RF Transmission based MRI Technique for Highly Sensitive Detection of Amide Proton Transfer in the Human Brain at 3T. Proceedings of the 19th Annual Meeting of ISMRM; 2011; Montréal, Canada. p. 710.
3. Pena-Llopis S, Brugarolas J. Simultaneous isolation of high-quality DNA, RNA, miRNA and proteins from tissues for genomic applications. Nat Protoc 2013;8:2240-55. PMC4211643.
4. Hensley CT, Faubert B, Yuan Q, Lev-Cohain N, et. al. Metabolic Heterogeneity in Human Lung Tumors. Cell 2016;164:681-94. PMC4752889.
5. Zhang S, Seiler S, Wang X, Madhuranthakam AJ, et. al. CEST-Dixon for human breast lesion characterization at 3 T: A preliminary study. Magn Reson Med 2018;80:895-903. PMC5980671.
6. Loi L, Zimmermann F, Goerke S, Korzowski A, et. al. Relaxation-compensated CEST (chemical exchange saturation transfer) imaging in breast cancer diagnostics at 7T. Eur J Radiol 2020;129:109068.
7. Krikken E, Khlebnikov V, Zaiss M, Jibodh RA, et. al. Amide chemical exchange saturation transfer at 7 T: a possible biomarker for detecting early response to neoadjuvant chemotherapy in breast cancer patients. Breast Cancer Res 2018;20:51. PMC6001024.
Figures