0406
Initial evaluation of breast MRI protocols for cancer treatment monitoring at low field 0.55 T1Radiology and Biomedical Imaging, University of California, San Francisco, San Francisco, CA, United States, 2Radiology, Stanford University, Stanford, CA, United States, 3Siemens Medical Solutions, USA, Inc., Malvern, PA, United States, 4Siemens Healthineers AG, Erlangen, Germany
Synopsis
Keywords: Breast, Low-Field MRI, Breast
Motivation: With increasing availability and technical advances of low field 0.55T MRI systems, it is important to understand their value for breast applications.
Goal(s): To present preliminary data of breast MRI at 0.55T with a newly available dedicated 7-channel prone breast coil.
Approach: Breast MRI at 0.55T and 3T with NIST-calibrated breast phantom and two healthy female volunteers using protocols that are clinically relevant for breast cancer treatment monitoring.
Results: Preliminary 0.55T breast MRI data has been successfully generated with acceptable image quality and will initiate future studies with breast cancer patients to advance breast MRI with low field systems.
Impact: This first acquisition of breast phantom and healthy volunteer data using sequences relevant in breast cancer treatment monitoring (T1-weighted, T2-weighted, diffusion-weighted) will initiate further, more detailed studies to explore the value of low field MRI for examining the breast.
Introduction
MRI of the breast presents a key diagnostic tool to monitor treatment response. 3D T2-weighted MRI provides anatomical data of the breast, and is of diagnostic relevance to assess fat necrosis, water content in tissue, and cysts. 3D dynamic contrast-enhanced multi-phase T1-weighted imaging generates crucial data to calculate functional tumor volume (FTV), an established predictive marker for treatment response assessment1. Lastly, apparent diffusion coefficients (ADC) from diffusion-weighted imaging (DWI), can differentiate neoadjuvant chemotherapy responders from non-responders early in treatment2,3. These breast MRI studies have been performed on either 1.5 T or 3 T systems. But, low-field MRI systems are becoming widely available, and offer simplified infrastructure at drastically decreased costs and with increased patient comfort owing to a wider bore. Our objective is to assess the value of breast MRI at 0.55T, specifically to set it up for studies in treatment response prediction.Methods
Data was acquired at a 0.55T scanner (MAGNETOM Free.Max, Siemens Healthineers) with a newly available 7-channel breast coil (Siemens Healthineers), as well as at a 3T scanner (MAGNETOM Vida, Siemens Healthineers) with an established 16-channel breast coil (Sentinelle). We utilized a NIST-calibrated breast phantom (131, CaliberMRI)4,5 which comprises two subunits with multiple compartments mimicking breast tissue according to T1 relaxation and diffusivity, as well as fat-mimic. Additionally, two healthy female volunteers (36yo, 40yo) were examined.At 0.55T the following sequences were performed (product or work-in-progress): (i) Axial T1-weighted VIBE Dixon. Pixel resolution (mm2): 1.25x1.25, slice thickness (mm): 2, number of slices: 74, matrix: 320x320, FOV (mm2): 400x400, flip angle (degree): 20, bandwidth: 447 Hz/pixel, TR/TE (ms/ms): 8.8/2, ETL: 2, acceleration: deep learning (DL)-CAIPI-5, scan time: 104 seconds. Dixon in-phase, fat-only, water-only images were derived. (ii) Axial 3D T2-weighted SPACE using chemically selective fat saturation pulse. Pixel resolution (mm2): 1.05x1.05, slice thickness (mm): 1, number of slices: 160, matrix: 384x384, FOV (mm2): 400x400, flip angle (degree): 135, bandwidth: 434 Hz/pixel, TR/TE (ms/ms): 1500/372, ETL: 120, acceleration: deep learning (DL)-CAIPI-4-FLAIR, scan time: 4 minutes. (iii) Axial 2D DWI single-shot echo-planar-imaging. Pixel resolution (mm2): 3x3, slice thickness (mm): 4, number of slices: 34, matrix: 134x136, FOV (mm2): 405x399, flip angle (degree): 90, bandwidth: 1244 Hz/pixel, TR/TE (ms/ms): 9000/84, b-values (averages) (sec/mm2): 0 (2), 800 (7) sec/mm2, scan time: 5 minutes.
At 3T we performed: (i) Axial T1-weighted conventional gradient echo with and without SPAIR active fat suppression. Pixel resolution (mm2): 0.9x0.9 mm, slice thickness (mm): 2, number of slices: 90, matrix: 448x403, FOV (mm2): 399x399, flip angle (degree): 10, bandwidth: 385 Hz/pixel, TR/TE (ms/ms): 4.3/1.57, ETL: 1, scan time: 97 seconds. (ii) Axial 2D DWI using RESOLVE. Pixel resolution (mm2): 2.2x2.2, slice thickness (mm): 2.2, number of slices: 70, matrix: 164x164, FOV (mm2): 360x360, flip angle (degree): 100, bandwidth: 953 Hz/pixel, TR/TE (ms/ms): 7600/57, b-values (averages) (sec/mm2): 0 (2), 800 (2), acceleration: parallel imaging (R=2), and simultaneous-multi-slice (R=2), scan time: 5:04 minutes.
Results
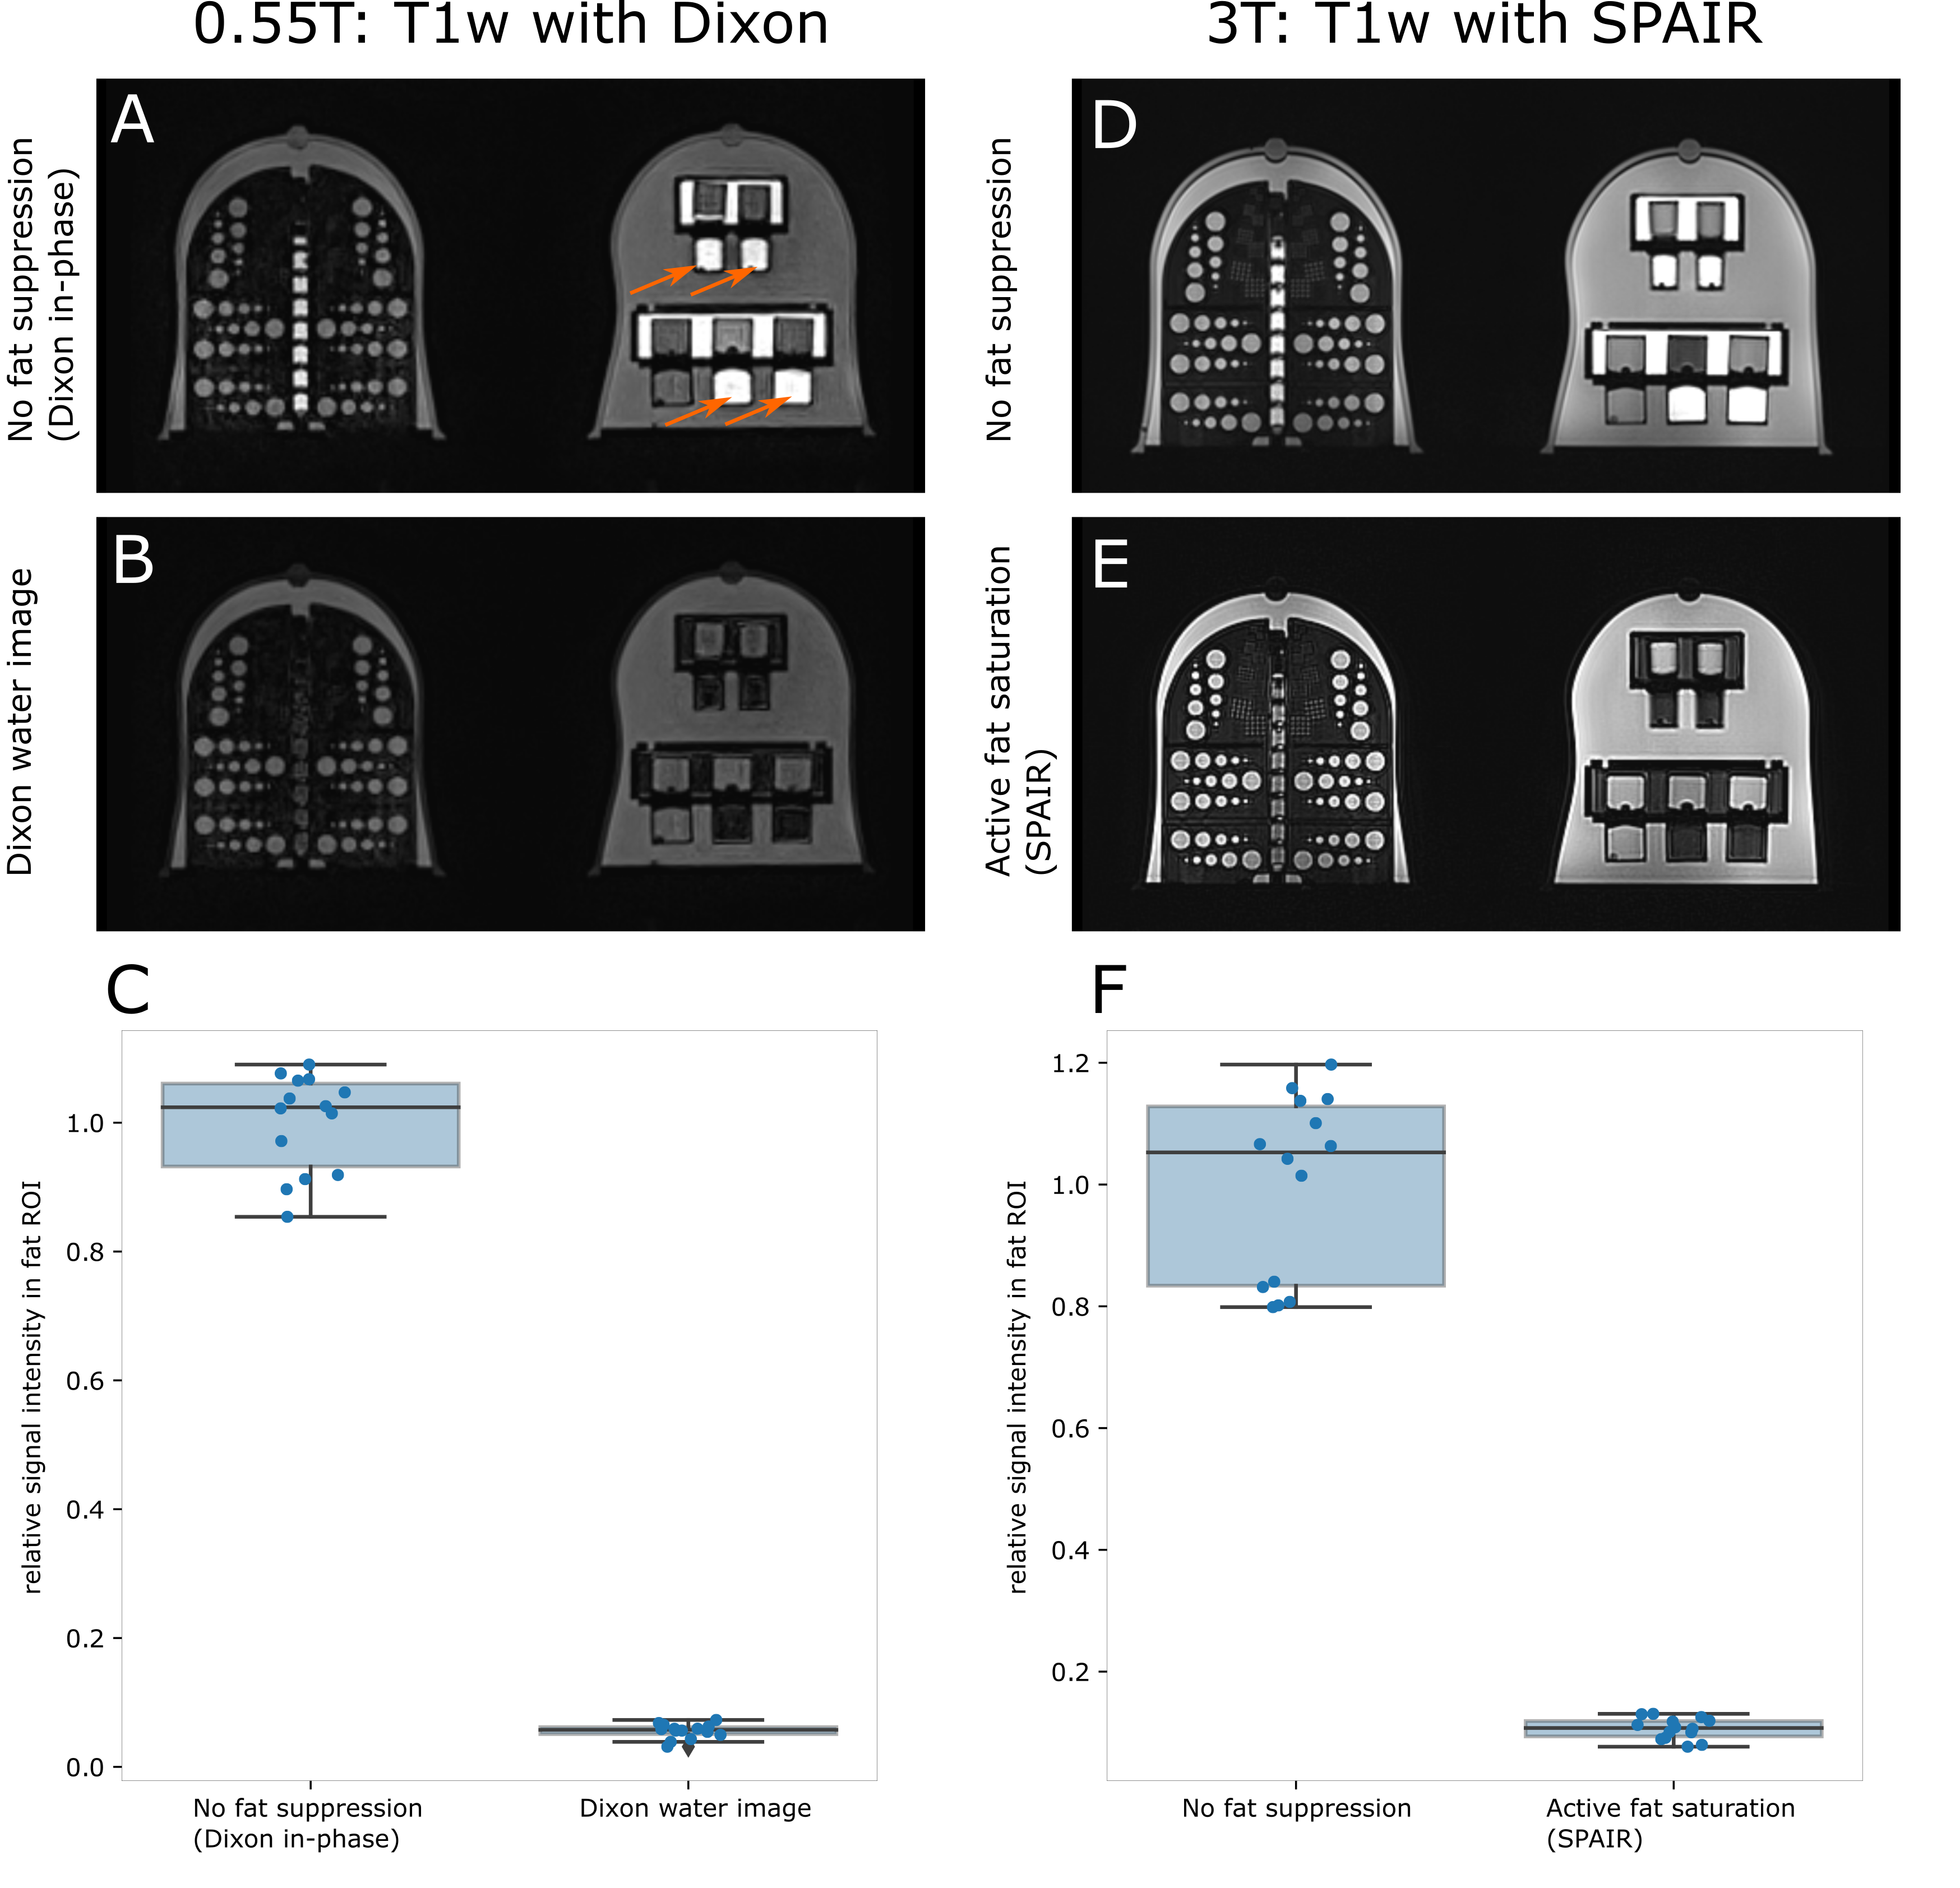
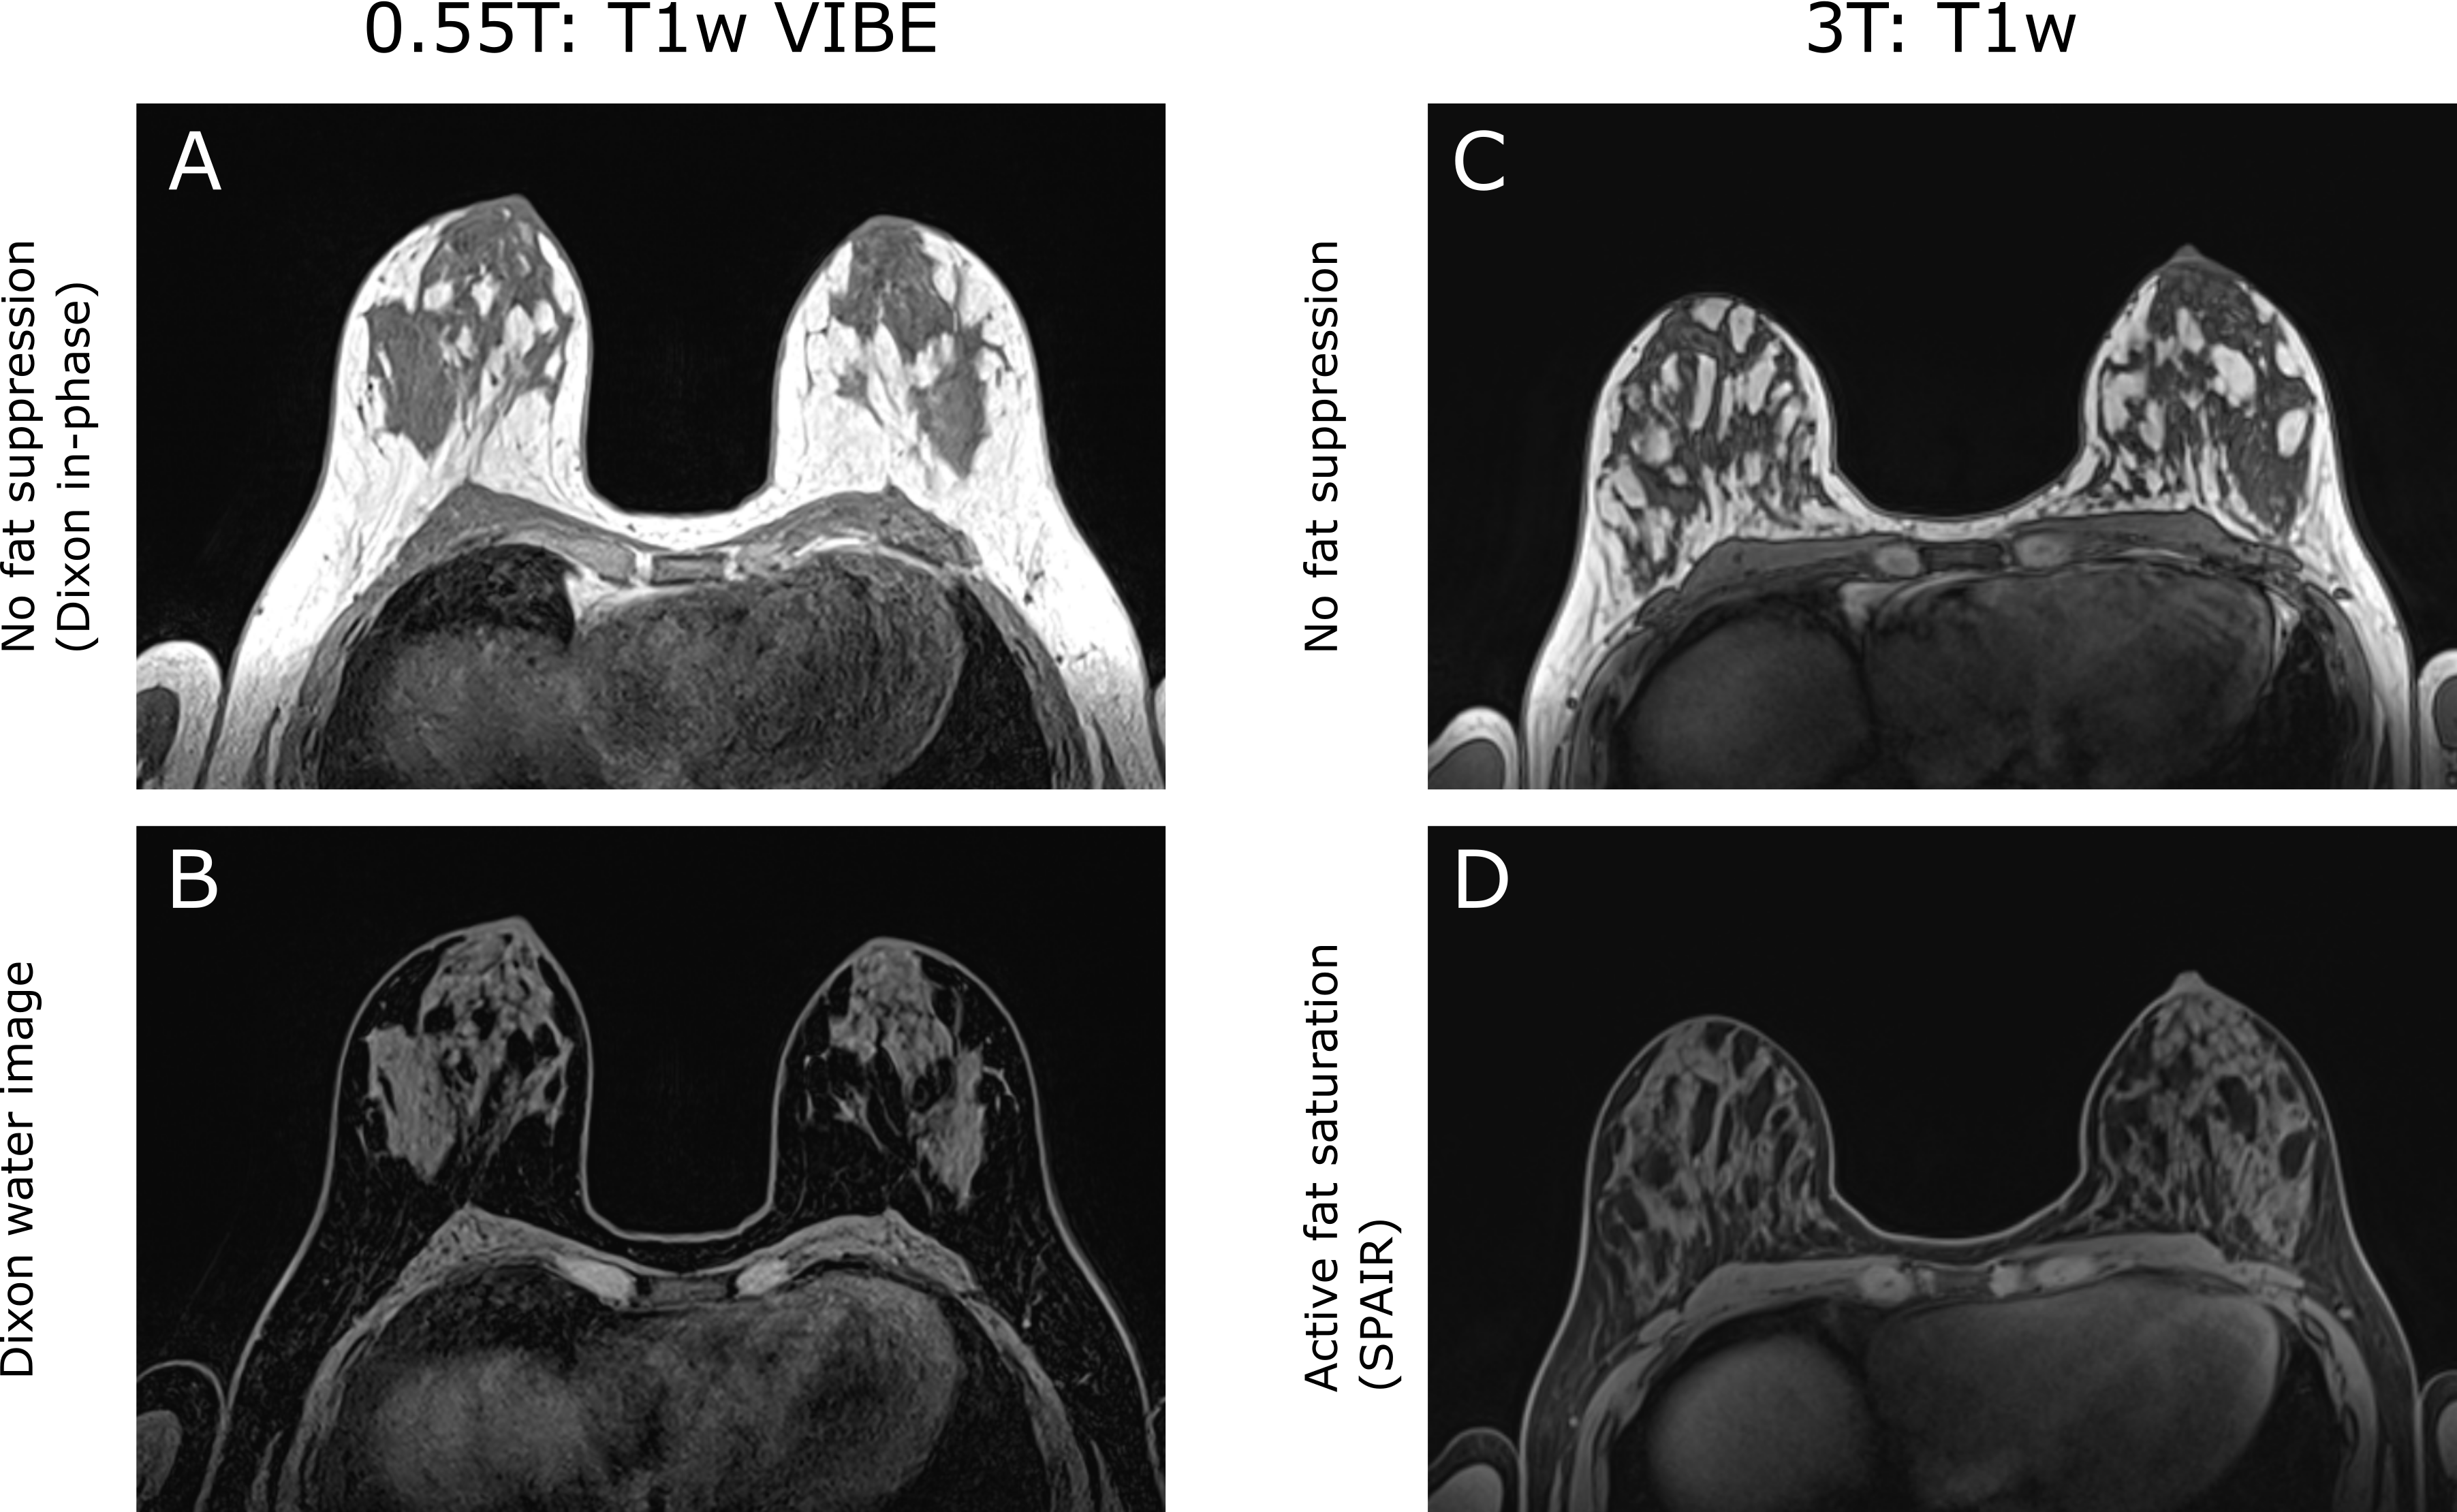
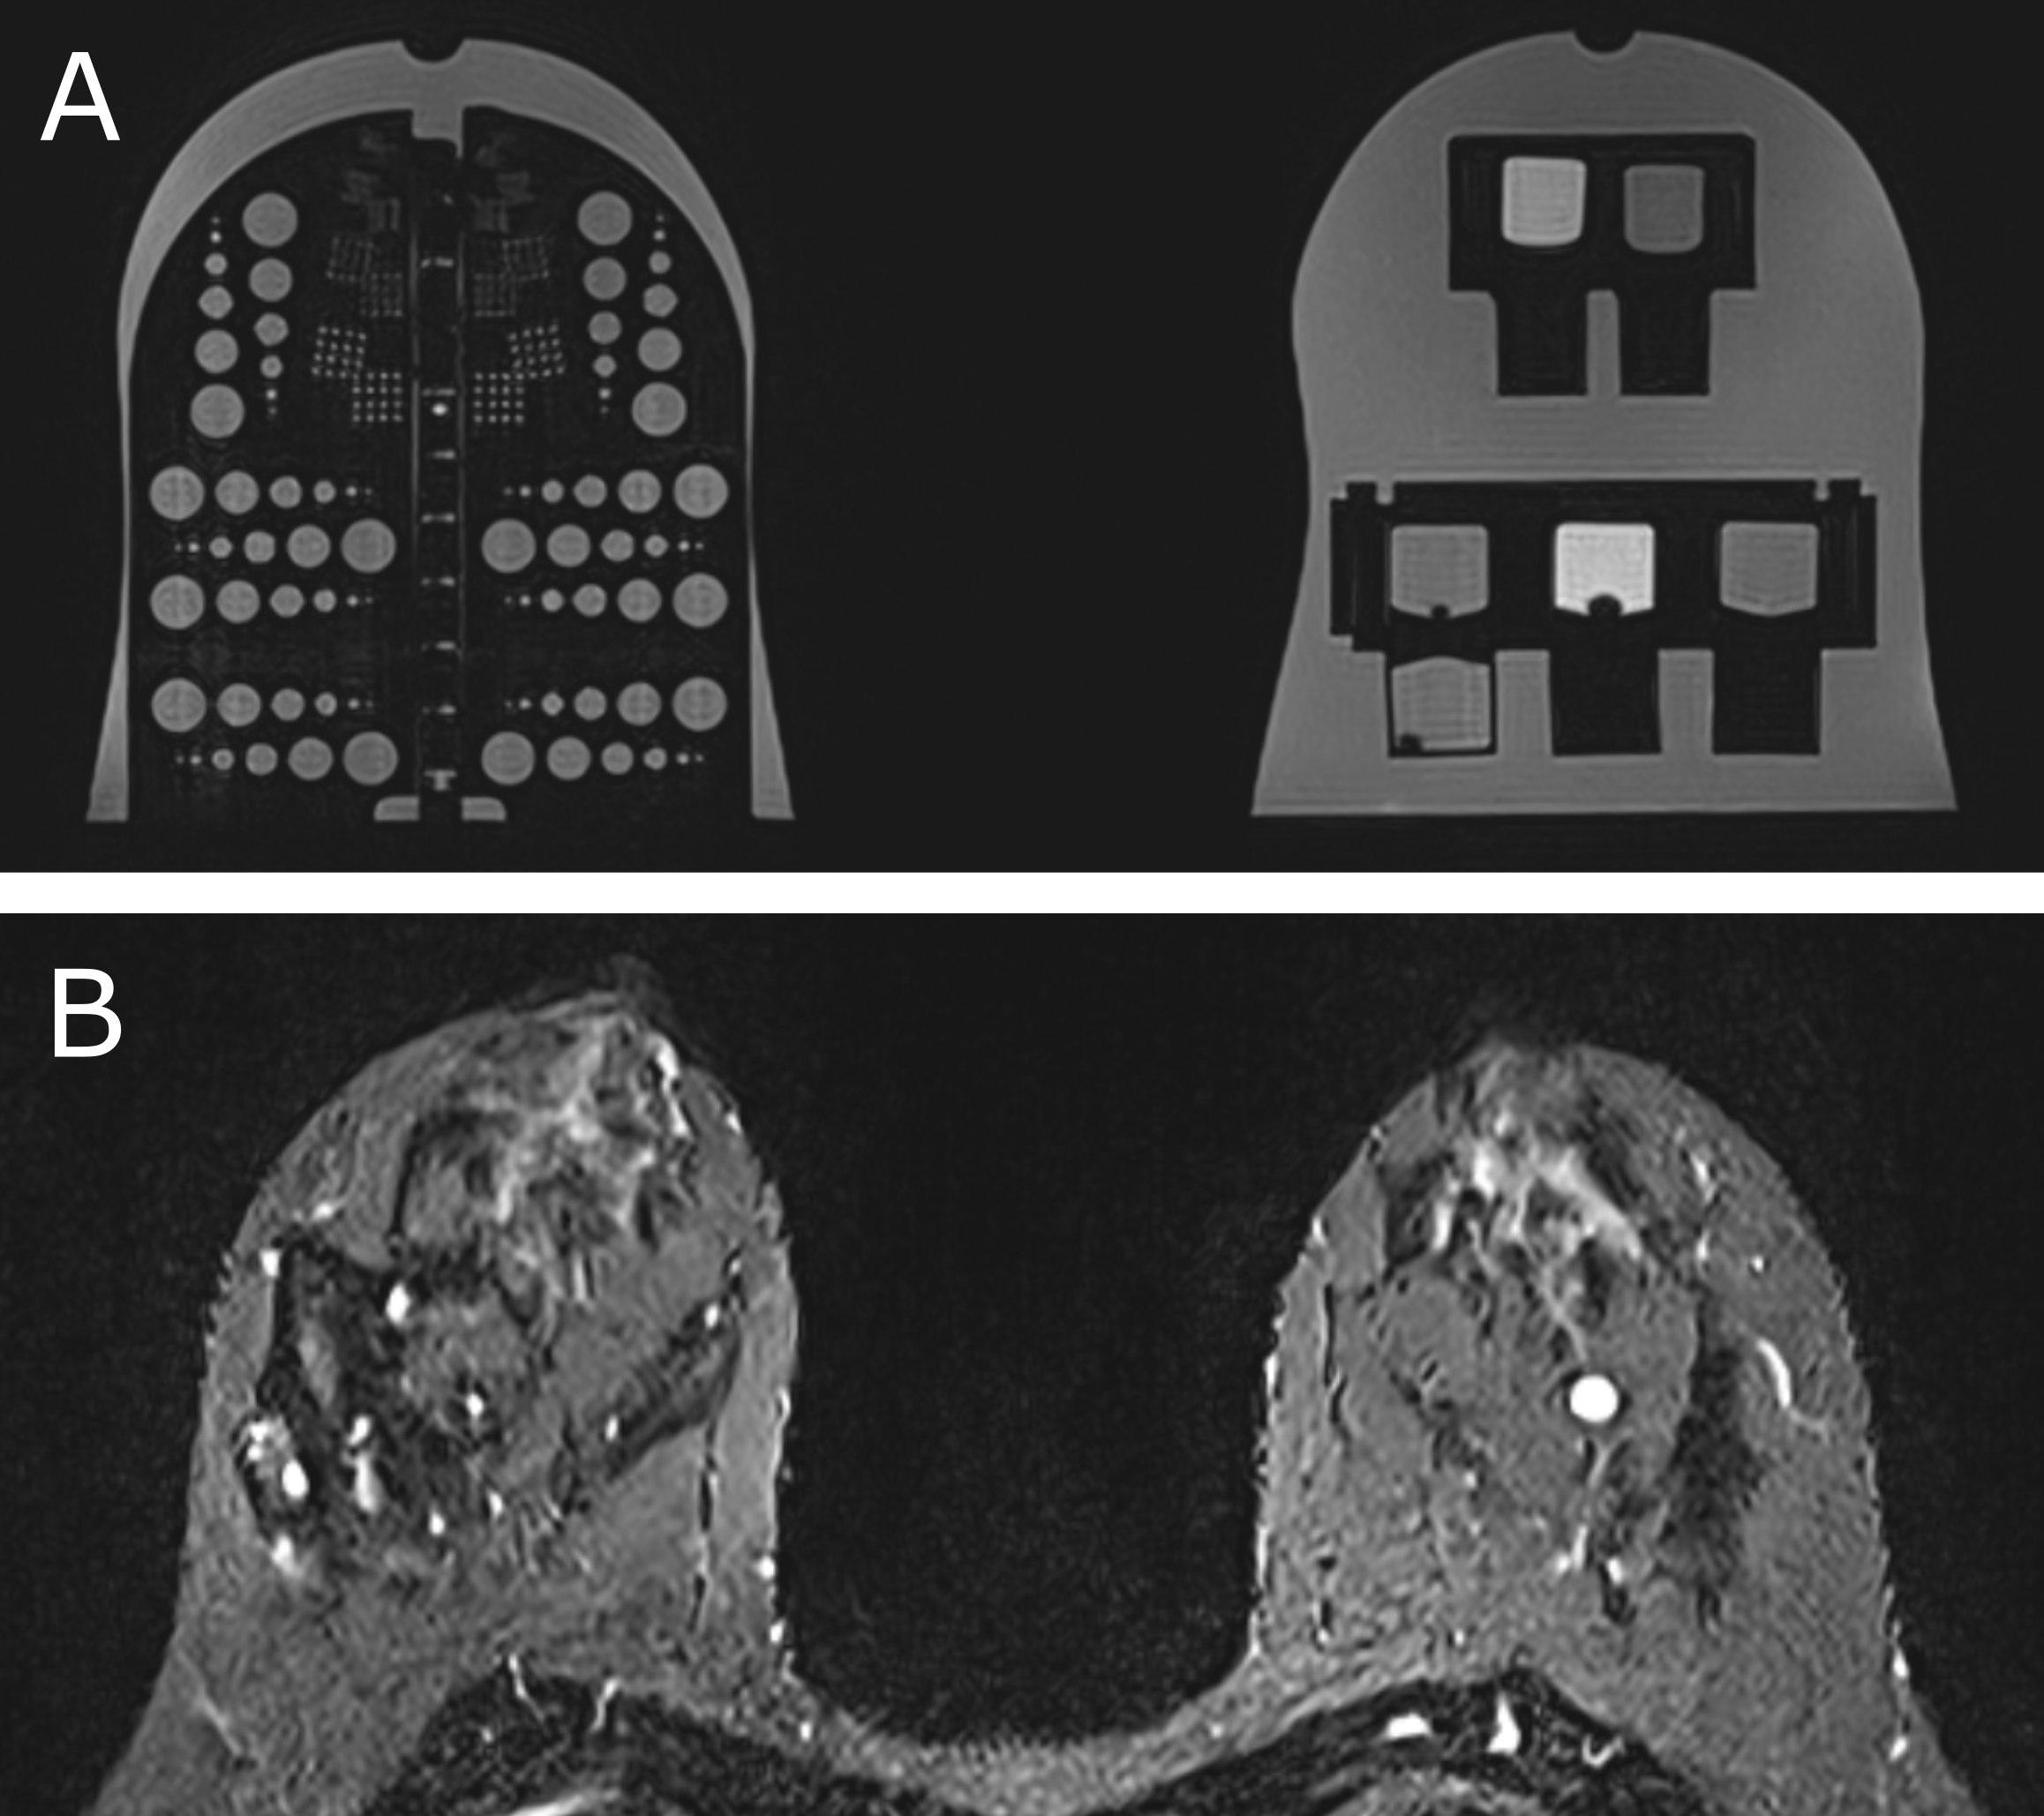
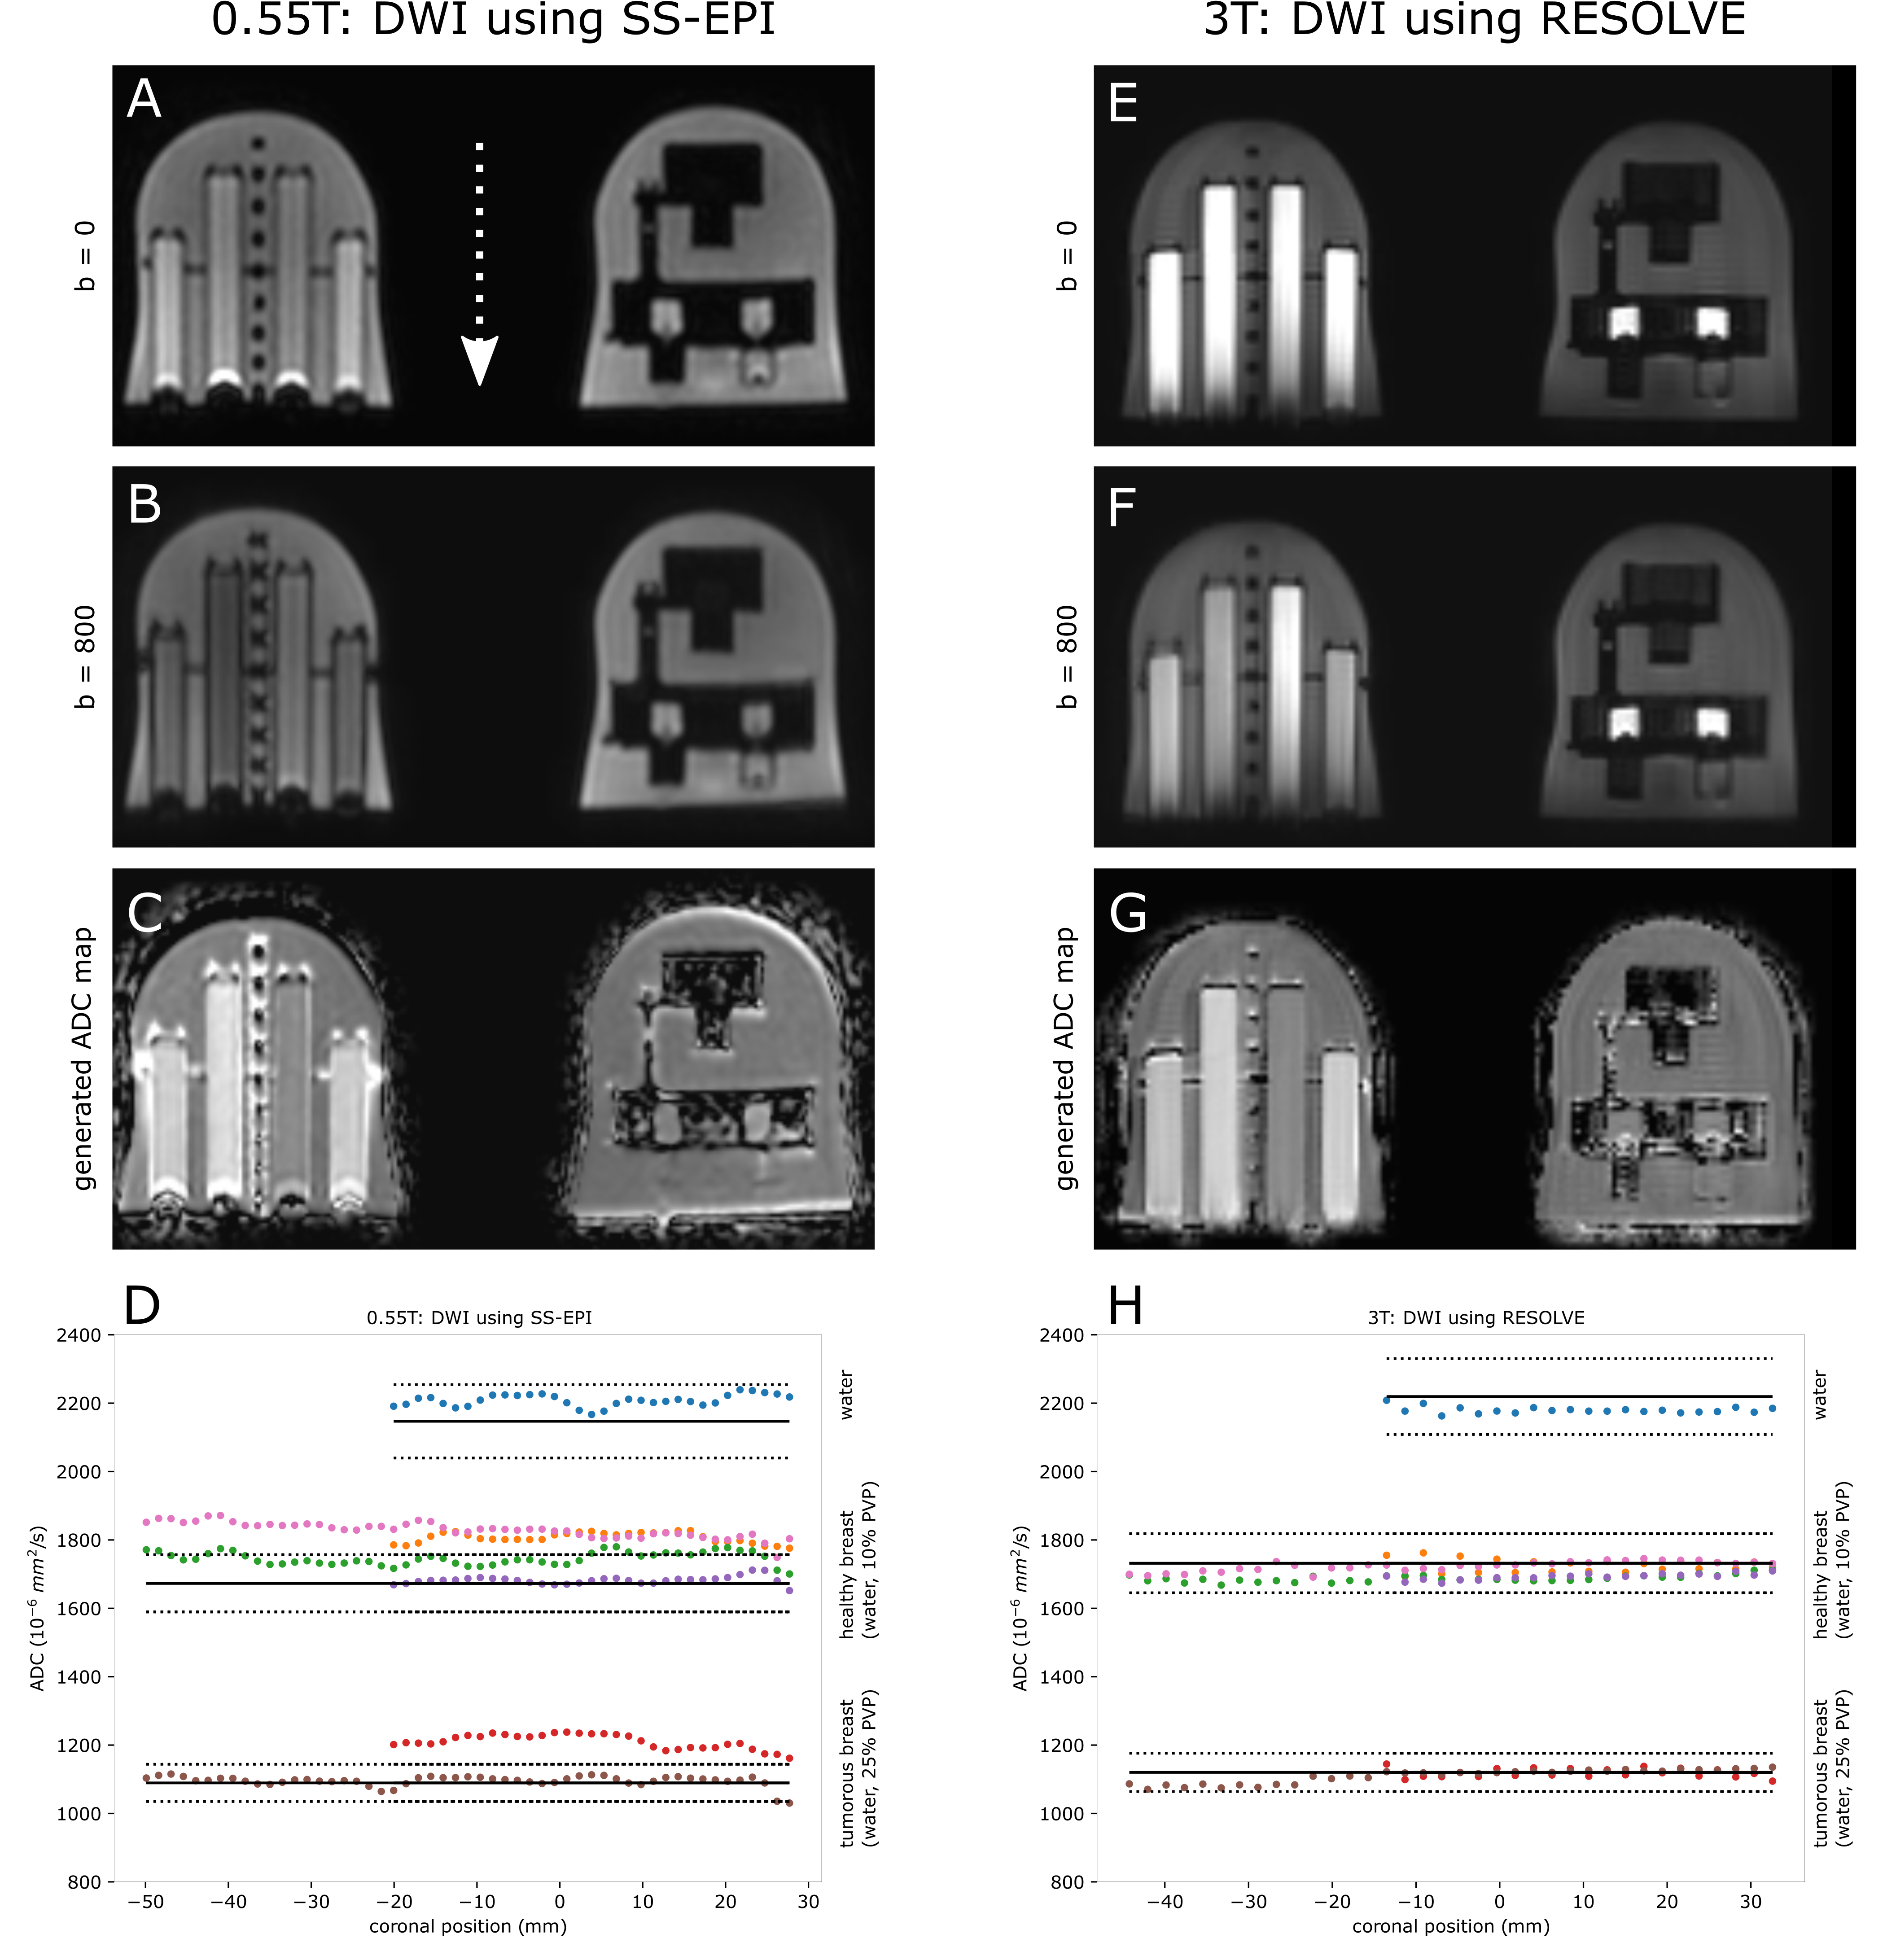
For all evaluated sequences at 0.55T, we achieved clinically acceptable scan times, with only minor sacrifices in voxel size (except for DWI). T1-weighted imaging (Fig. 1) with Dixon fat-water separation showed homogeneous fat suppression, measuring 91.4% ± 1.4 % (mean ± SD) in the breast phantom fat-mimic regions of interest, comparable to what was achieved with SPAIR active fat suppression at 3T (89.4 % ± 1 %) (Figs. 1C, 1F). At 0.55T, artifacts at fat-water boundaries in the frequency encoding direction are present in the breast phantom analysis (Fig. 1B). Healthy volunteer 0.55T T1-weighted images depict fibroglandular tissue contrast with sufficient fat suppression, comparable to the corresponding 3T T1-weighted data (Fig. 2). 0.55T T2-weighted data (Fig. 3) show excellent image quality with acquisition times under 4 minutes. DWI 0.55T required decreased image resolution compared to 3T to achieve acceptable signal-to-noise and scan time under 5 minutes (Fig. 4). ADC values in seven vials presenting three distinct diffusivity levels (Fig. 4 D, H) showed an ADC bias of 7.75% ± 4.27 % at 0.55T, compared to 1.41 % ± 0.87 % at 3T.Discussion
This study reports an initial successful example of breast MRI using a low field 0.55T scanner, as well as a newly available dedicated breast coil for prone patient positioning. Owing to the availability of DL-supported reconstruction, scan times for T1-weighted and T2-weighted protocols are within range of clinical acceptance and without sacrificing image quality. The extension of this work warrants further quantitative assessment of image quality (e.g. artifacts at fat-water boundaries in T1-weighted, distortion and ADC inhomogeneity in DWI). Upon further assessment, we will evaluate these protocols in breast cancer patients undergoing neoadjuvant therapies.Acknowledgements
This work was funded by: National Institutes of Health Grants: U01CA225427, 1R44CA235820, R01CA190299, Siemens project grant (CLMA125836), and UCSF Radiology departmental seed grant for pilot projects.References
- Hylton et al., Neoadjuvant chemotherapy for breast cancer: Functional tumor volume by MR imaging predicts recurrence free survival-results from the ACRIN 6657/CALGB 150007 I-SPY 1 TRIAL. Radiology 279(1): 44-55 (2016)
- Partridge et al., Diffusion-weighted MRI findings predict pathologic response in neoadjuvant treatment of breast cancer: The ACRIN 6698 multicenter trial. Radiology 289(3): 618-27 (2018)
- Li et al., Additive value of diffusion-weighted MRI in the I-SPY 2 TRIAL. J Magn Reson Imaging 50(6): 1742-53 (2019)
- Keenan et al., Design of a breast phantom for quantitative MRI. J Magn Reson Imaging 44(3): 610-19 (2016)
- Keenan et al., MRI-visible liquid crystal thermometer. Magn Reson Med 84(3): 1552-63 (2020)
Figures