0405
Application of accelerated quantitative magnetic resonance imaging in predicting drug resistance in pituitary prolactinomas1Radiology, Huashan Hospital, Fudan University, Shanghai, China, 2Endocrinology, Huashan Hospital, Fudan University, Shanghai, China, 3MR Research Collaboration, Siemens Healthineers Ltd., Shanghai, China, 4Application Developments, Siemens Shenzhen Magnetic Resonance Ltd., 518057 Shenzhen, China, Shanghai, China, 5Shanghai Municipal Center for Disease Control and Prevention, Shanghai, China, 6LTS5, Ecole Polytechnique Fédérale de Lausanne (EPFL), Lausanne, Switzerland, 7Department of Radiology, Lausanne University Hospital and University of Lausanne, Lausanne, Switzerland, 8Advanced Clinical Imaging Technology, Siemens Healthineers International AG, Lausanne, Switzerland, 9ShanghaiTech University, Shanghai, China
Synopsis
Keywords: Tumors (Post-Treatment), Endocrine, Pituitary prolactinoma
Motivation: Predicting and managing dopamine agonists (DA) resistance of prolactinomas remain a challenge. There is no reliable quantitative imaging marker.
Goal(s): The goal is to use accelerated quantitative T2 mapping(GRAPPATNI) for early diagnosis of drug resistance in pituitary prolactinomas to guide treatment.
Approach: This is a cross-sectional study. It will analyze the differences in T2 values between drug-resistant and sensitive groups and explore their diagnostic value in predicting drug sensitivity.
Results: Quantitative T2 values have better sensitivity than T2 signal intensity (SI) in predicting drug resistance in pituitary prolactinoma.
Impact: This is the first study to apply GRAPPATINI in prolactinoma. We found that T2 values of tumors were lower in drug-resistant prolactinoma than sensitive patients. T2 values might be a promising predictive imaging tool.
Introduction
Prolactinoma is the most common functional pituitary adenoma, accounting for 50% of all pituitary adenomas. Dopamine agonists (DA) are the recommended first-choice treatment leading to prolactin (PRL) normalization and tumor size reduction [1]. However, about 30% of patients showed resistance to DA therapy, especially to bromocriptine. Mechanisms of DA resistance remain unclear [2]. Therefore, non-invasive imaging to determine drug sensitivity could reduce treatment costs and guide strategies. Currently, there's a lack of objective imaging biomarkers to predict drug sensitivity. Retrospective studies suggest a correlation between signal intensity (SI) of T2WI and DA resistance [3-4]. Other studies have also found that the SI of T2WI can reflect the biological characteristics and drug response of diverse types of pituitary adenomas [5,6]. However, these are qualitative measures and conclusions vary. T2 mapping indirectly measures how restricted water molecular move in tissues, reflecting tumor hardness and composition. However, it requires ample echo data, consuming scanning time. Recent technology, GRAPPATINI, generates qualitative and quantitative data in one acquisition, improving collection efficiency and ensuring image quality [7]. Its application in pituitary adenomas is yet to be reported.Method
Patients with prolactinomas were recruited and categorized into two groups: DA-resistant and DA-sensitive. This categorization was based on their biochemical and tumor volume response to DA. The inclusion criteria included elevated PRL levels, pituitary MRI, and an adequate DA trial. Patients underwent 3T MRI (MAGNETOM Prisma, Siemens Healthcare, Erlangen, Germany) with a 64-channel Rx head coil, which includes GRAPPATINI T2 mapping and T2WI. T2 maps and the synthetic T2W images were inline generated after data acquisition. The T2 mapping parameters were TR/TE = 3110/13.5, 27, 40.5, 54, 67.5, 81, 94.5,108, 121.5, 135 ms; FOV = 166×164mm2; scan matrix = 294×182; voxel size = 0.3×0.3×2.0 mm3; 20 slices; parallel imaging factor = 2 with an additional under-sampling factor of 5, resulting in a 10-fold total acceleration; acquisition time = 1 min 48 sec. The circular area of interest (ROI) was placed inside the pituitary adenoma, and another in the gray matter (GM), for establishing the ratio as T2 SI_tumor/T2 SI_GM. Statistical analysis was performed including t-tests or ANOVA for group comparisons and correlation analyses. The diagnostic performance of T2 and SI ratio was determined by receiver operating characteristic (ROC) analysis. The correlation between T2 and PRL values was assessed with a Spearman test. A p<0.05 was considered statistically significant.Results
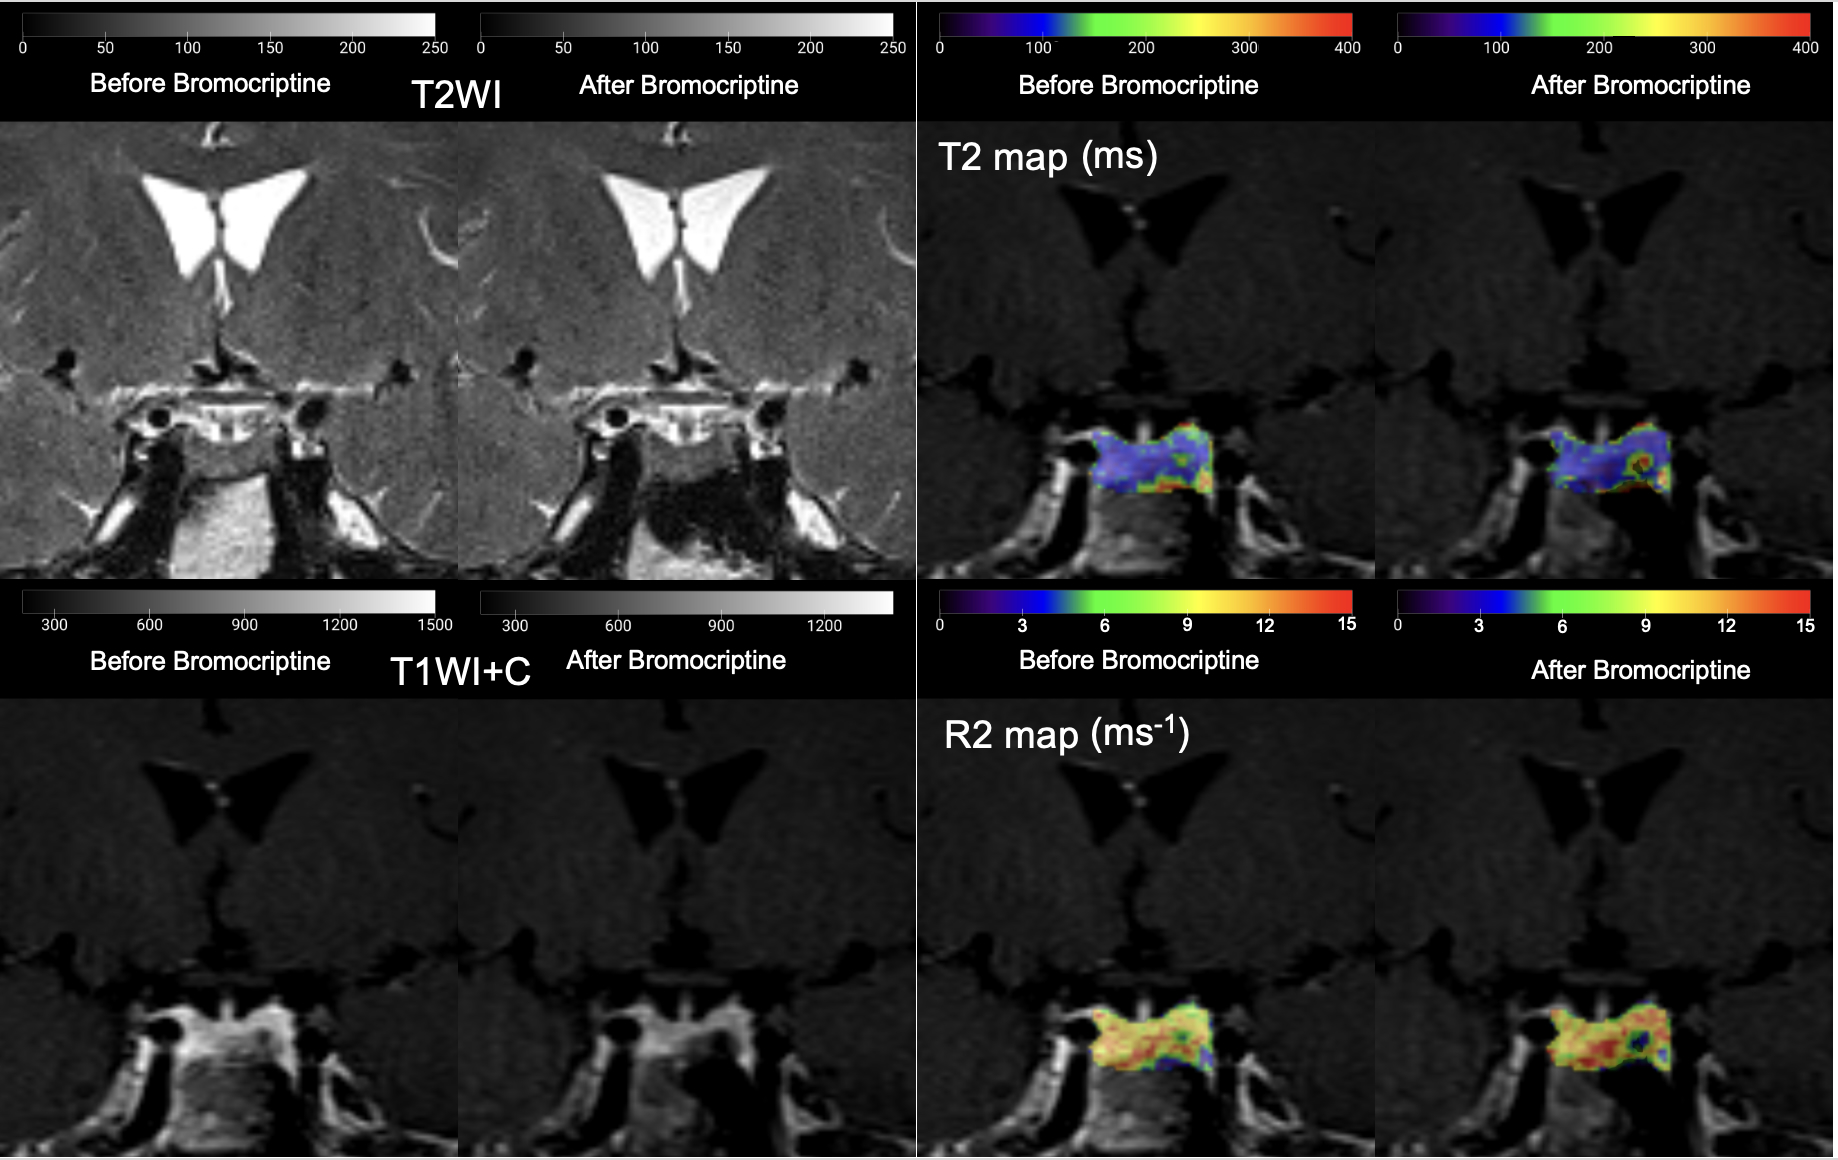
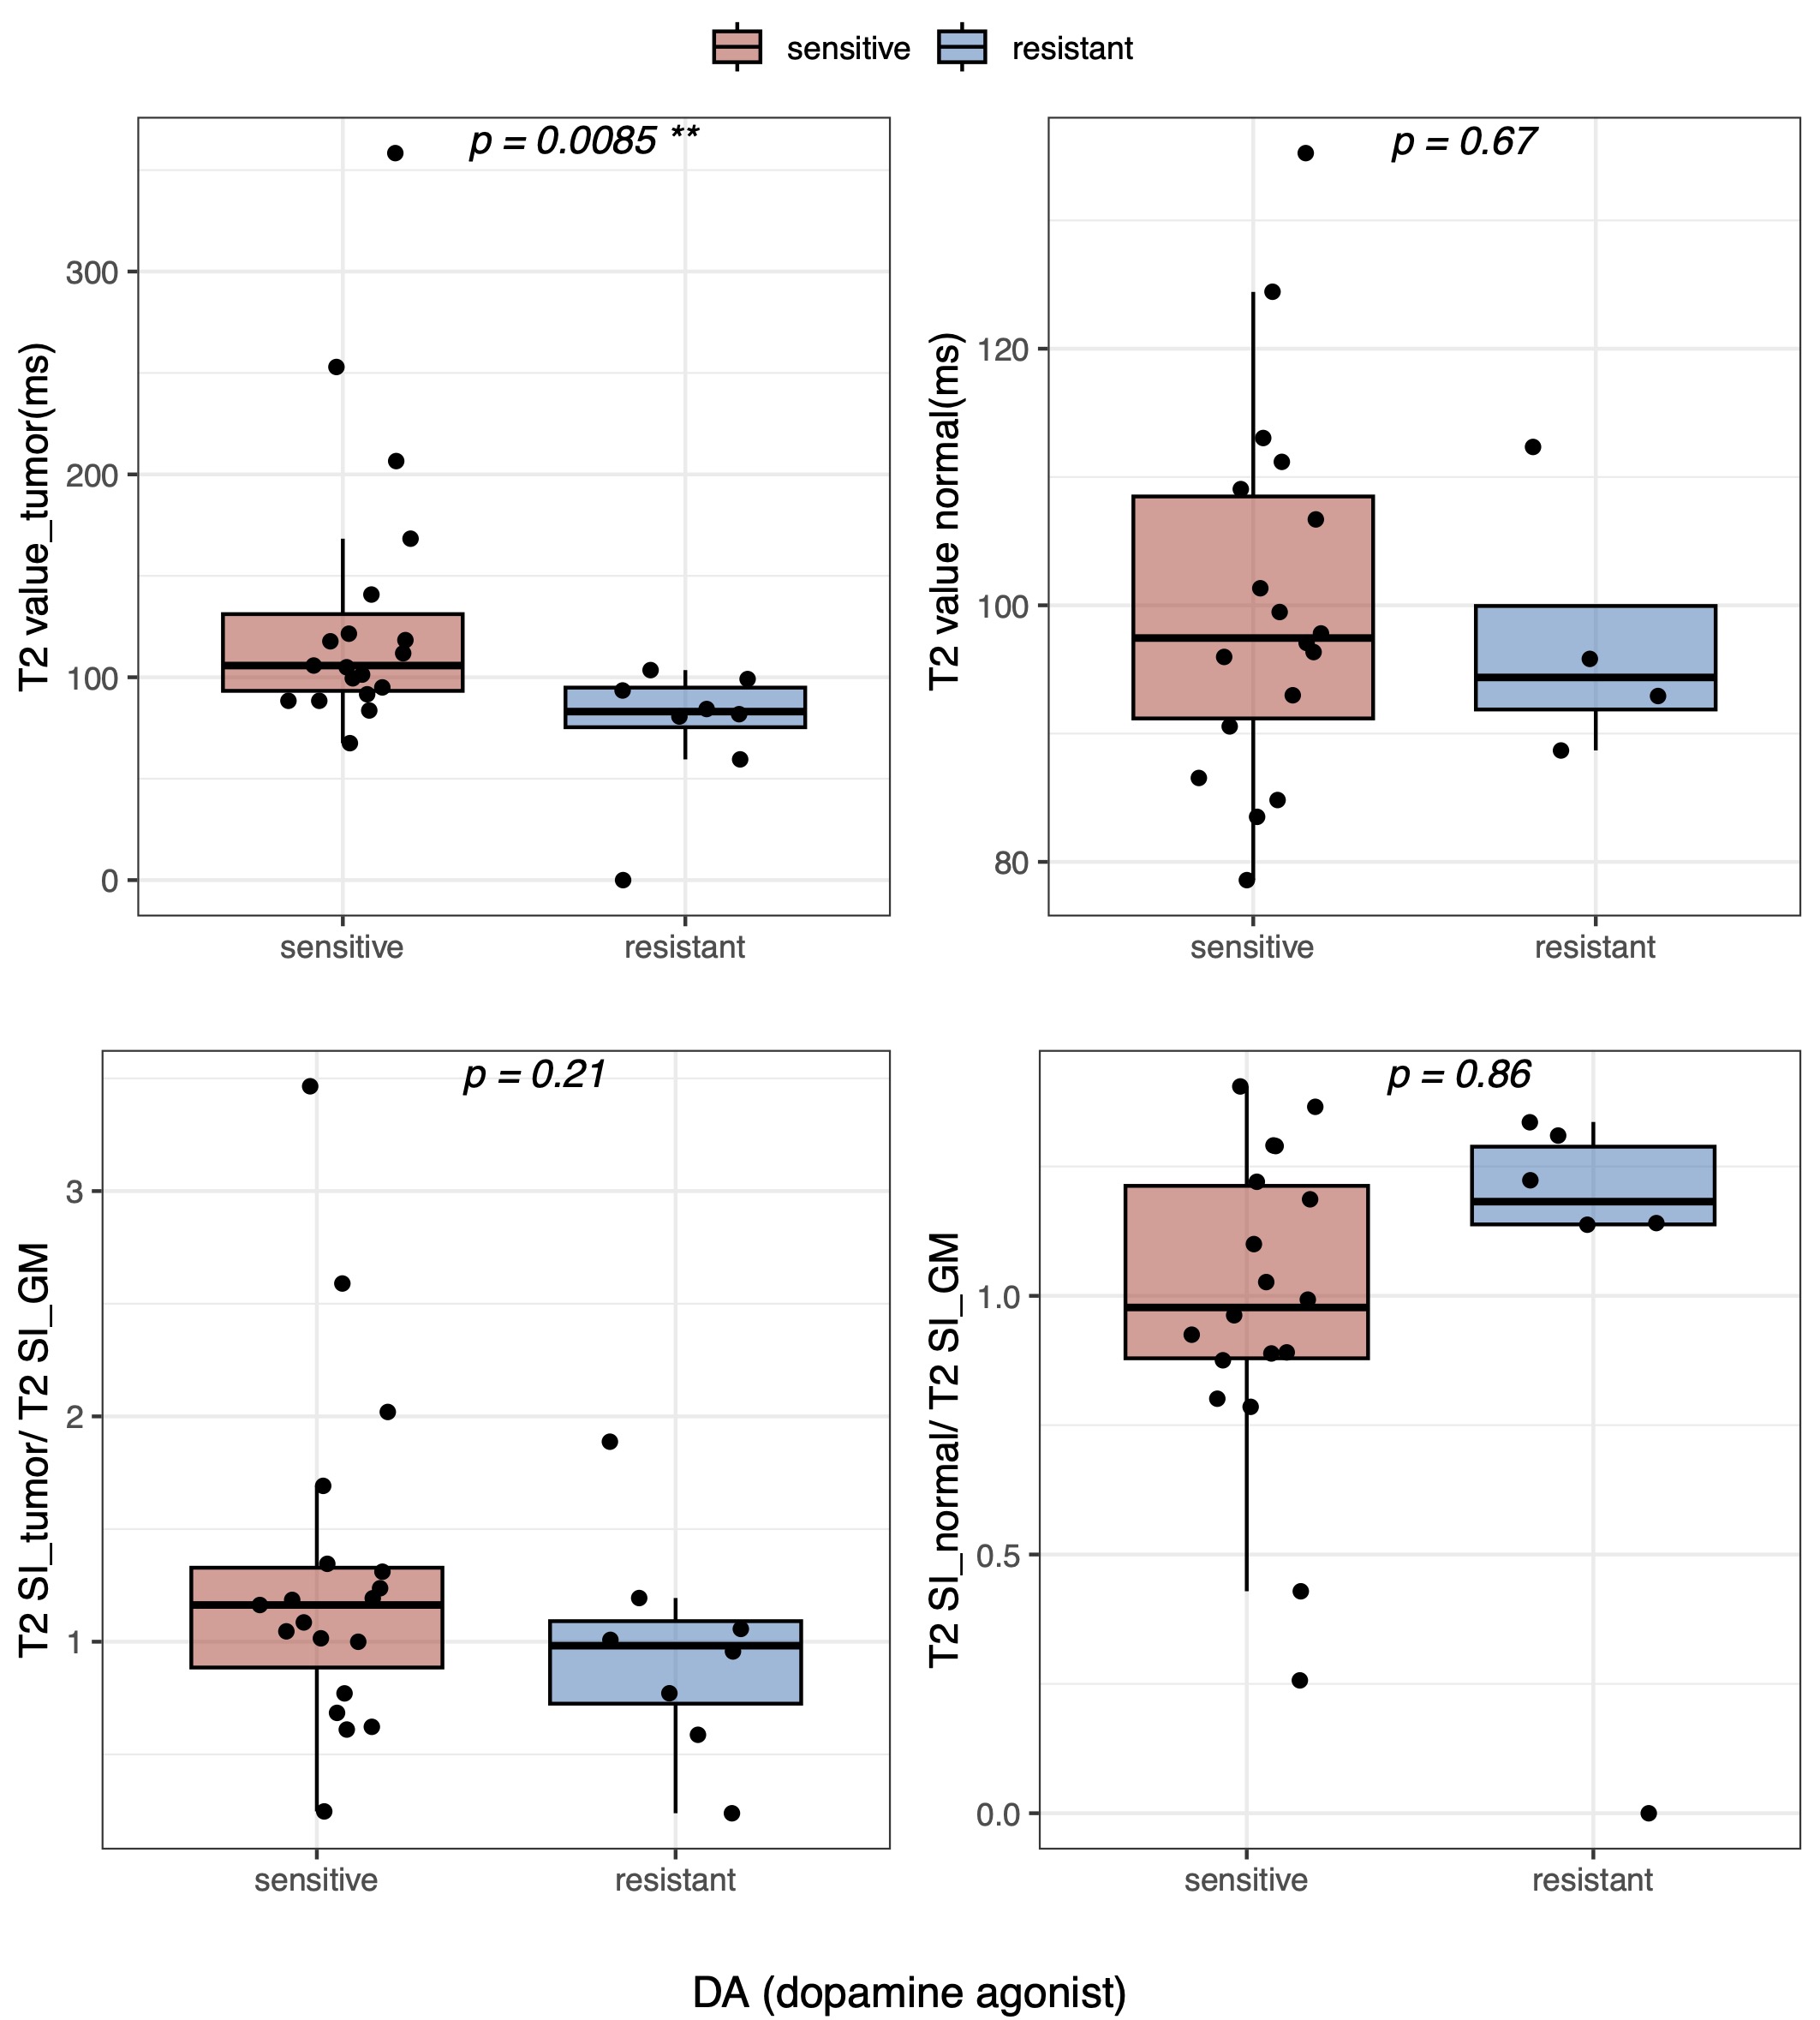
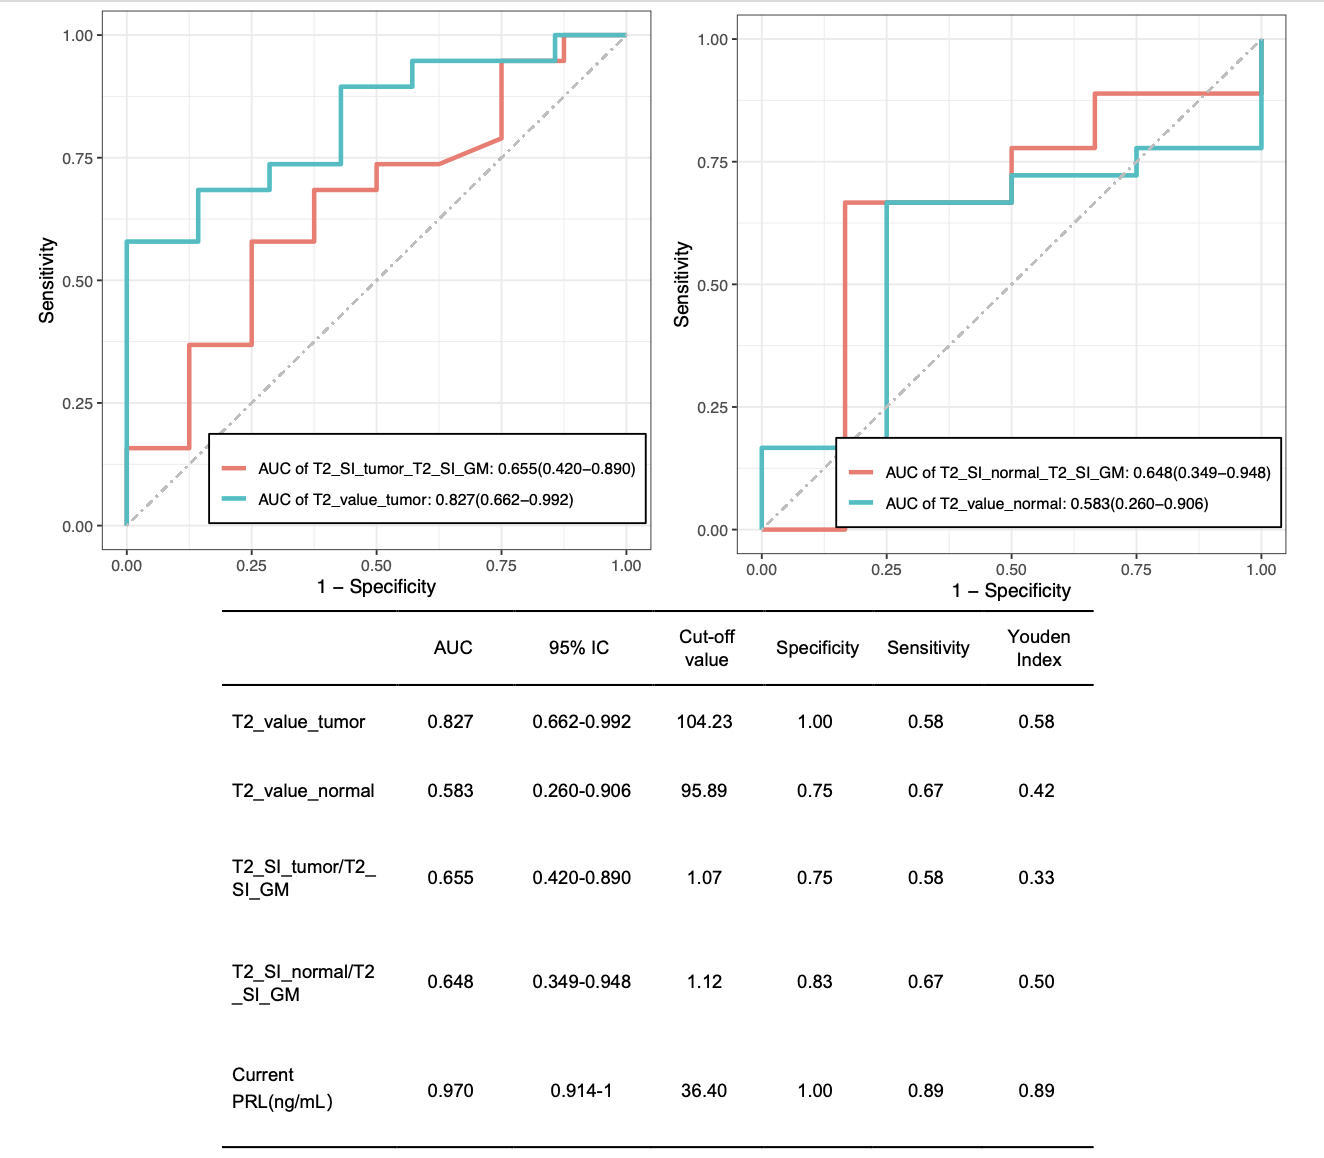
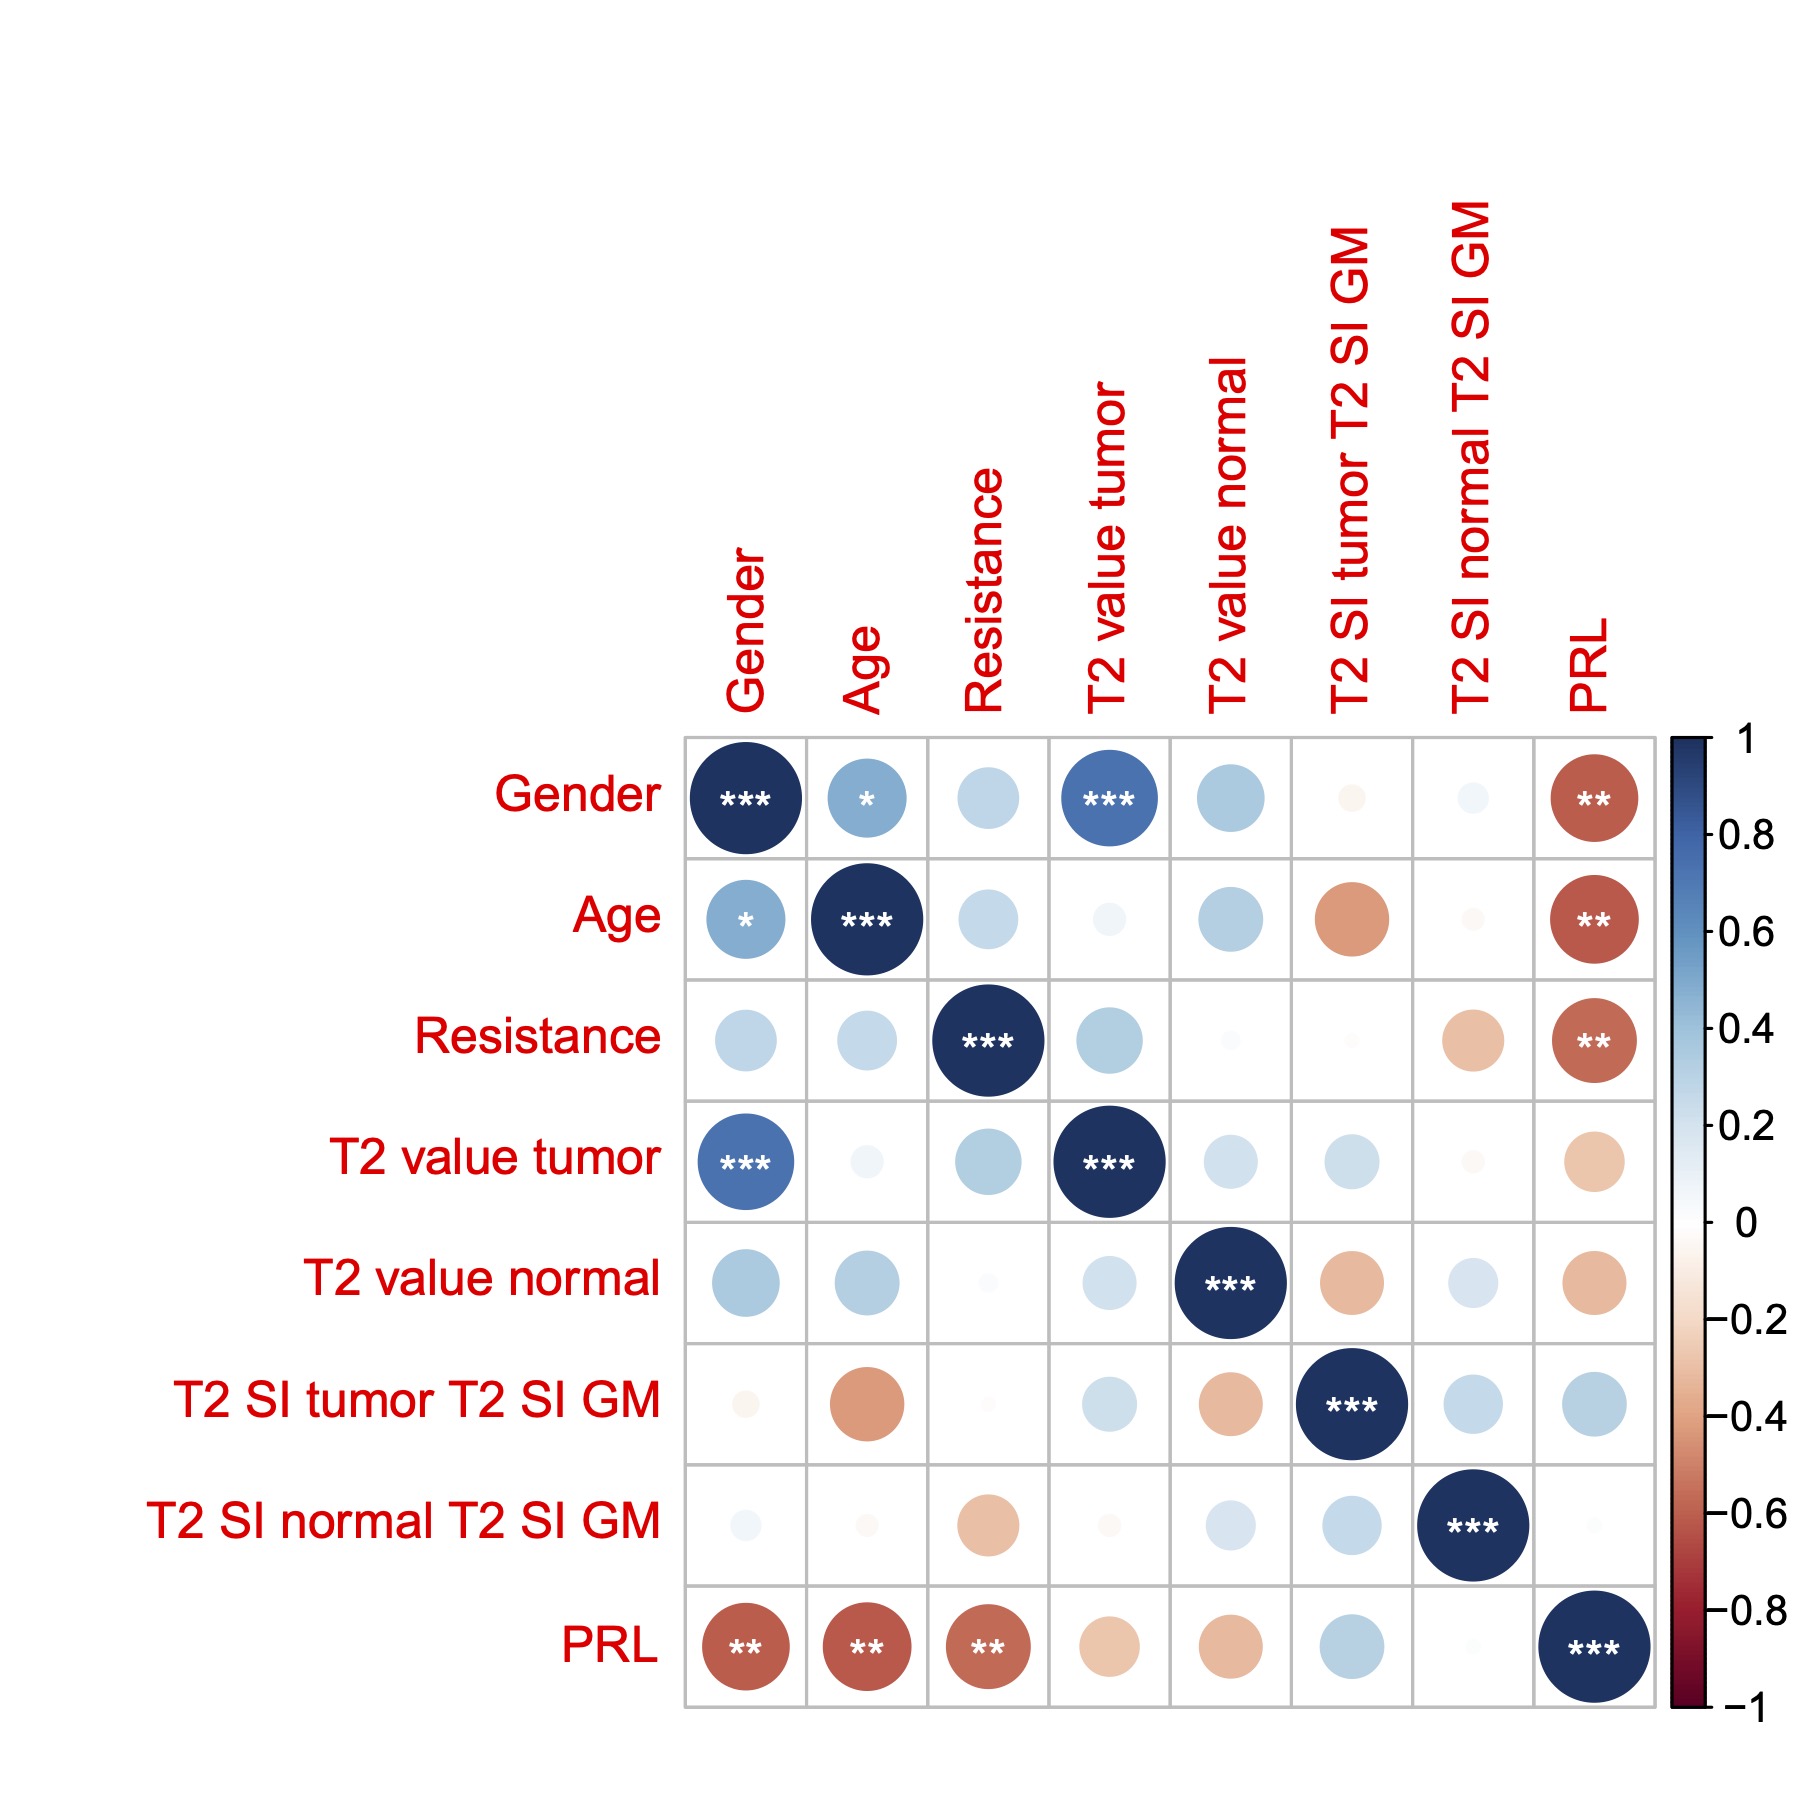
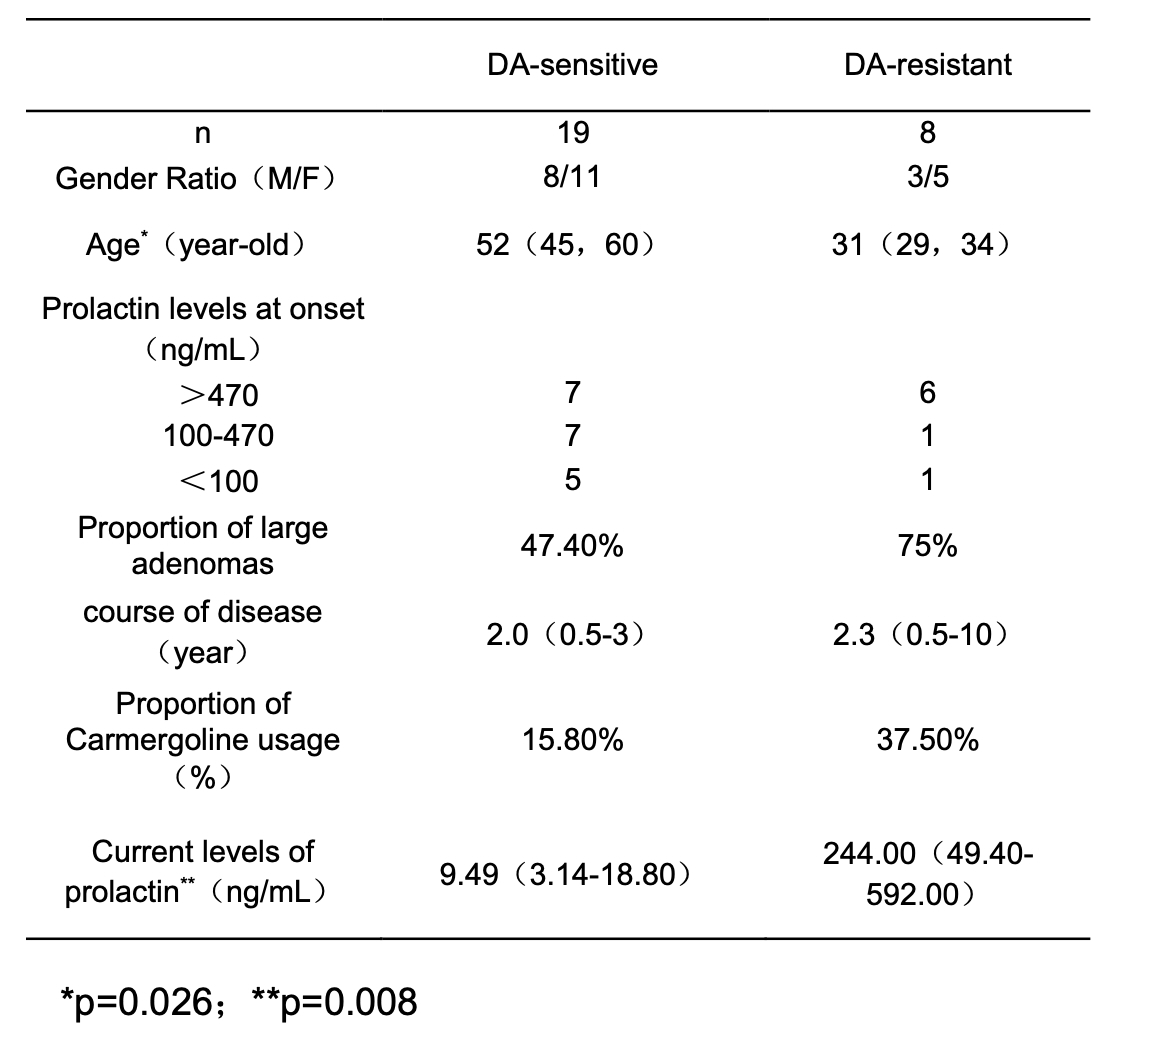
The clinical data of the patient is shown in Table 1. The imaging quality was good enough to directly obtain quantitative T2 values, which preliminarily confirmed the feasibility of the procedure (Fig. 1). Furthermore, it was found that the T2 value of the DA-resistant group of pituitary prolactinomas was significantly lower than that of the DA-sensitive group ( 86.77 ± 15.9 vs 120.22 ± 46.50, p=0.009), while the T2 SI_tumor/T2 SI_GM did not differ between the two groups (0.96 ± 0.48 vs 1.28 ± 0.75, p=0.21); There was no difference in the T2 value and T2 SI normal/T2 SI_GM between the DA-resistant and sensitive groups (Fig. 2). The areas under the ROC curve (AUC) for the T2 values and T2 SI ratio for distinguishing the sensitivity of the prolactinomas were 0.827 and 0.655, respectively (Fig. 3). The T2 value of the tumor is positively correlated with gender (rho=0.734, p = 0.002). The PRL level is negatively correlated with gender, age, and DA-resistance (rho=-0.601, p = 0.004; rho=-0.616, p = 0.003; rho=-0.562, p = 0.008) (Fig.4).Discussion
T2-weighted MRI can qualitatively reflect prolactinoma hardness but lacks quantification and objectivity. Accelerated GRAPPATINI T2 mapping provides precise quantitative data reflecting tissue composition and hardness, without extending scan time. This study found that dopamine agonist (DA) resistant prolactinomas had significantly lower T2 values versus DA-sensitive tumors. T2 mapping better predicted DA resistance than T2 signal intensity ratios. Tumor T2 values also predicted population trends in potential DA sensitivity among females. Decreased prolactin (PRL) in older female patients suggests they may experience a suboptimal reaction to DA therapy relative to other patients. Those with higher PRL tended to be DA-sensitive. In summary, quantitative T2 mapping shows promise in distinguishing DA-resistant prolactinomas, predicting individualized treatment response, and potentially enabling personalized therapy selection.Conclusion
This pioneering study applied accelerated GRAPPATINI T2 mapping between DA-resistant and sensitive prolactinomas. We aim to evaluate T2 mapping's potential as an early non-invasive imaging biomarker to predict medication response in prolactinoma patients prior to long-term treatment.Acknowledgements
The MRI sequence (WIP 899C, Siemens) for this study was supported by Siemens Healthcare AG.References
[1] Petersenn Stephan,Fleseriu Maria, Casanueva Felipe F et al. Diagnosis and management of prolactin-secreting pituitary adenomas: a Pituitary Society International Consensus Statement. [J] . Nat Rev Endocrinol, 2023, undefined: undefined.
[2] MAITER D. Management of Dopamine Agonist-Resistant Prolactinoma [J]. Neuroendocrinology, 2019, 109(1): 42-50.
[3] Varlamov Elena V, Hinojosa-Amaya José Miguel, Fleseriu Maria, Magnetic resonance imaging in the management of prolactinomas; a review of the evidence. [J] . Pituitary, 2020, 23: 16-26.
[4] Burlacu M C, Maiter D, Duprez T et al. T2-weighted magnetic resonance imaging characterization of prolactinomas and association with their response to dopamine agonists. [J]. Endocrine, 2019, 63: 323-331.
[5] Kocak Burak, Durmaz Emine Sebnem,Kadioglu Pinar et al. Predicting response to somatostatin analogues in acromegaly: machine learning-based high-dimensional quantitative texture analysis on T2-weighted MRI. [J].Eur Radiol, 2019, 29: 2731-2739.
[6] Cuocolo Renato,Ugga Lorenzo,Solari Domenico et al. Prediction of pituitary adenoma surgical consistency: radiomic data mining and machine learning on T2-weighted MRI. [J]. Neuroradiology, 2020, 62: 1649-1656.
[7] Hilbert Tom, Sumpf Tilman J, Weiland Elisabeth et al. Accelerated T mapping combining parallel MRI and model-based reconstruction: GRAPPATINI. [J]. J Magn Reson Imaging, 2018, 48: 359-368.
Figures