0404
Monitoring intranasal treatment to brain tumor using multiple CEST contrasts1Biomedical Engineering, City University of Hong Kong, Hong Kong, China, 2Hong Kong Centre for Cerebro-Cardiovascular Health Engineering (COCHE), Hong Kong, China, 3Russell H. Morgan Department of Radiology and Radiological Science, The Johns Hopkins University School of Medicine, Baltimore, MD, United States, 4City University of Hong Kong Shenzhen Research Institute, Shenzhen, China, 5Tung Biomedical Sciences Centre, City University of Hong Kong, Hong Kong, China
Synopsis
Keywords: Tumors (Post-Treatment), CEST & MT, Glioblastoma, Intranasal, Theranostic
Motivation: Theranostic application of intranasal drug delivery to glioblastoma using multiple CEST contrast.
Goal(s): Our goal is to monitor the drug delivery to brain tumor and evaluate the treatment effect simultaneously.
Approach: We investigated the imaging of liposome-based drug delivery to the brain tumor via intranasal administration,in which the amount of liposome and the tumor response can be detected by CEST MRI at 3T.
Results: CEST contrast at 3.5ppm of tumor region and the tumor size comparison between treatment and control group could indicate the therapeutic effect.CEST contrast at 4.3and-3.5ppm from pre-injection to post-injection in-vivo,could indicate the liposome drug delivery efficacy and drug distribution.
Impact: CEST MRI guided intranasal drug delivery could provide valuable information for assessing efficacy of drug delivery and treatment outcome. This can potentially translate to clinics as a non-invasive theranostic approach for glioblastoma treatment.
Introduction
Monitoring the amount of drug delivered and the tumor response to the treatment are the key to a successful brain cancer therapy. Intranasal drug delivery has shown promises as an effective mean to deliver drugs from the nose to the brain, while bypasses the BBB1,2. We previously demonstrated that both intraliposomal drug and liposomes can be imaged using distinctive Chemical Exchange Saturation Transfer (CEST) contrasts3. CEST could be used to monitor liposome-based nanomedicine, its biodistributions and potentially the drug distribution by rNOE (phospholipid bilayer of liposome) and APT (intraliposomal drug with amide proton)4, 5. Meanwhile, the tumor progression and therapeutic effect of nanomedicine can be monitored by APT6. Herein, we further investigated the theranostics application of our intranasal delivery system on a glioblastoma mouse model. We showed the therapeutic efficacy of intranasl drug delivery to brain tumor, and the tumor responses can be monitored using APT and rNOE.Methods
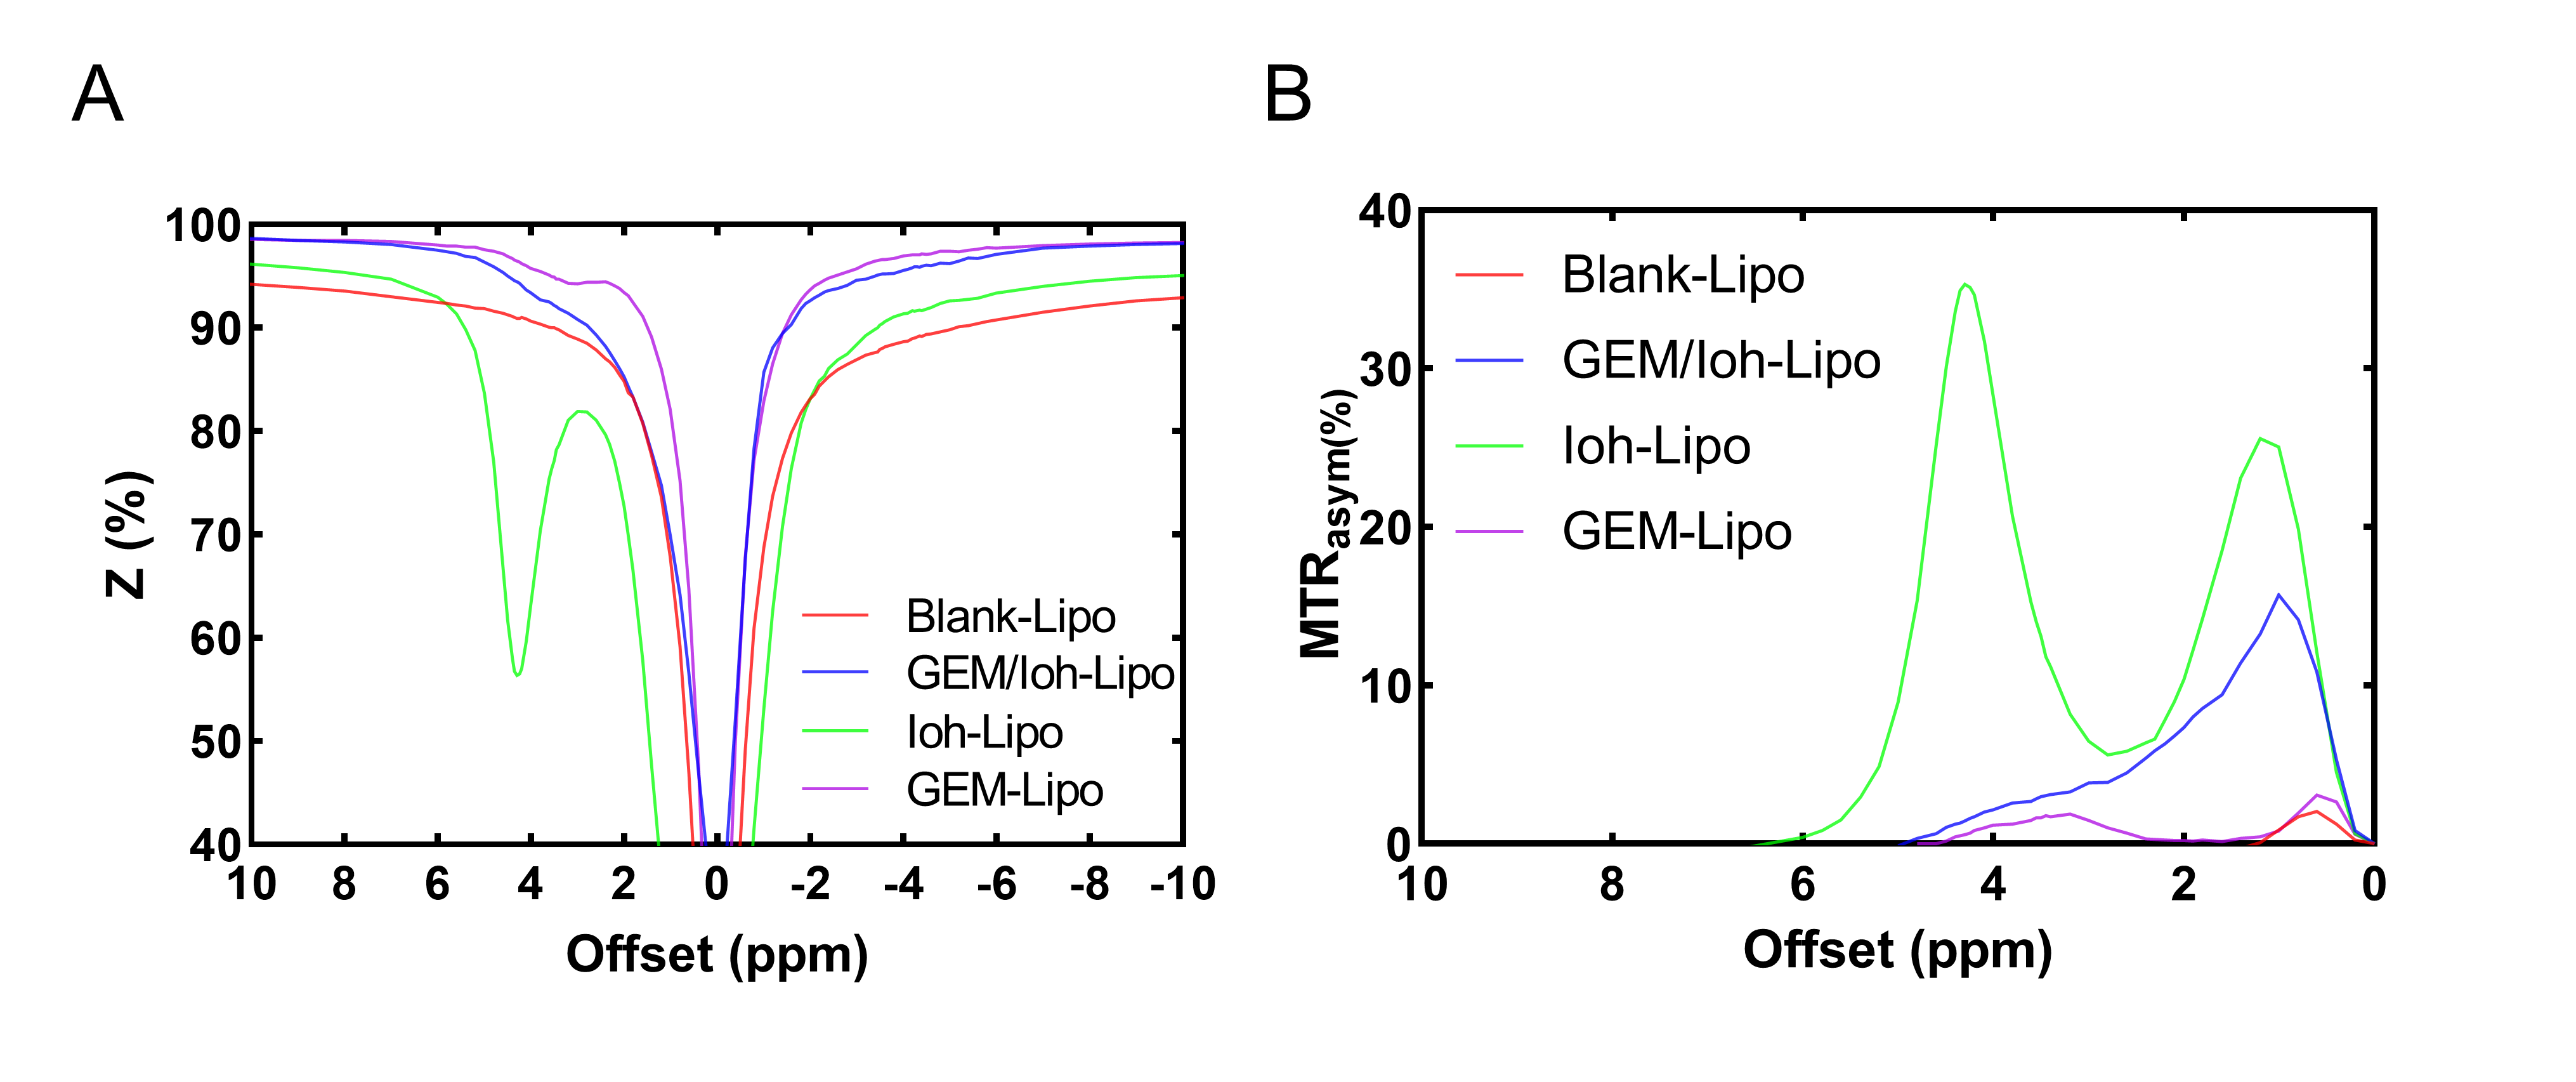
GEM-Lipo, Ioh-Lipo and blank lipo were prepared according to our previous study3. The liposome CEST contrast is shown in Fig.1, blank-Lipo, GEM/Ioh-Lipo, Ioh-Lipo, GEM-Lipo showed CEST contrast of 0.9%, 3.0%, 31.7% and 1.1% at 4.3 ppm at 1.0 μT in-vitro. The particle size and polydispersity index were size=132.4 nm, PDI=0.18 for blank-Lipo; size=189.6nm, PDI=0.22 for Ioh-Lipo and size=144.9 nm, PDI=0.19 for GEM-Lipo, respectively. Xenograft mouse model of GBM was used, where 0.5 million human GBM tumor cells U87 are implanted into NOD/SCID mice at the following coordinates from bregma: anteroposterior= +1.5 mm, lateral ± 1.5 mm, dorsoventral -1 mm. Mice were randomly separated into two groups for intranasal administration7 of treatment liposome (GEM/Ioh-Lipo) and control liposome (blank/Ioh-Lipo). 30ul of liposome was administered intranasally by pipette into each nostril of GBM mouse model on alternative day for 2 weeks. In-vivo MRI images for intranasal administration experiments at the tumor region in frontal lobe of GBM mouse model were acquired on horizontal bore 3T Bruker BioSpec system, the acquisition parameters were listed as follow: slice thickness=1 mm, field of view(FOV) =16x16 mm, image size = 64x64, RARE factor = 18, repetition time/echo time(TR/TE) = 5000/5 ms, B1 was varied as: 1.0, 2.0µT, tsat = 3 s,-20 to + 20 ppm, 0.2 ppm steps with an extra acquisition point on ±4.1, 4.3, 3.5 ppm.3Results and Discussion
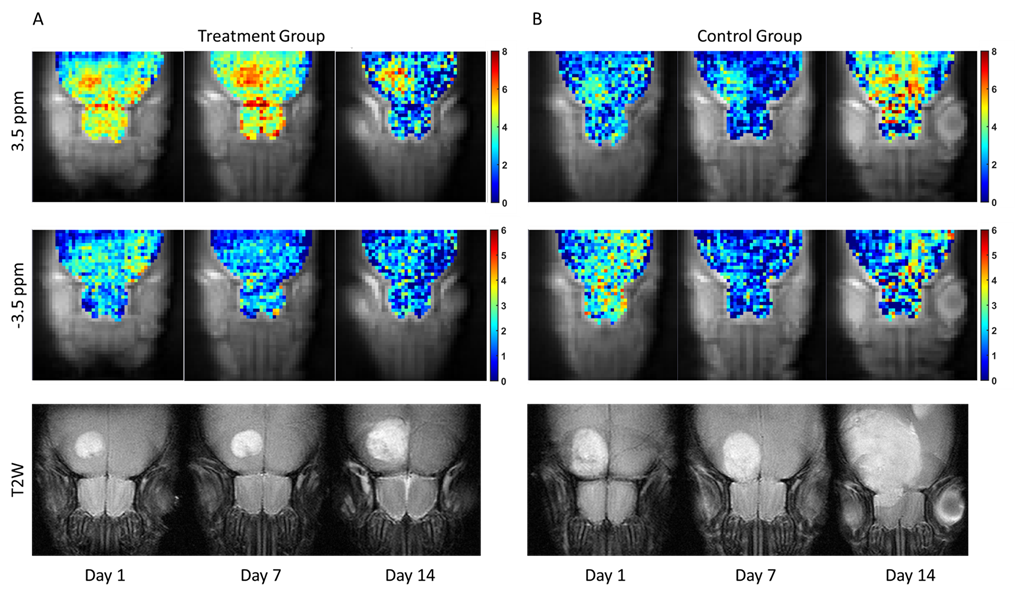
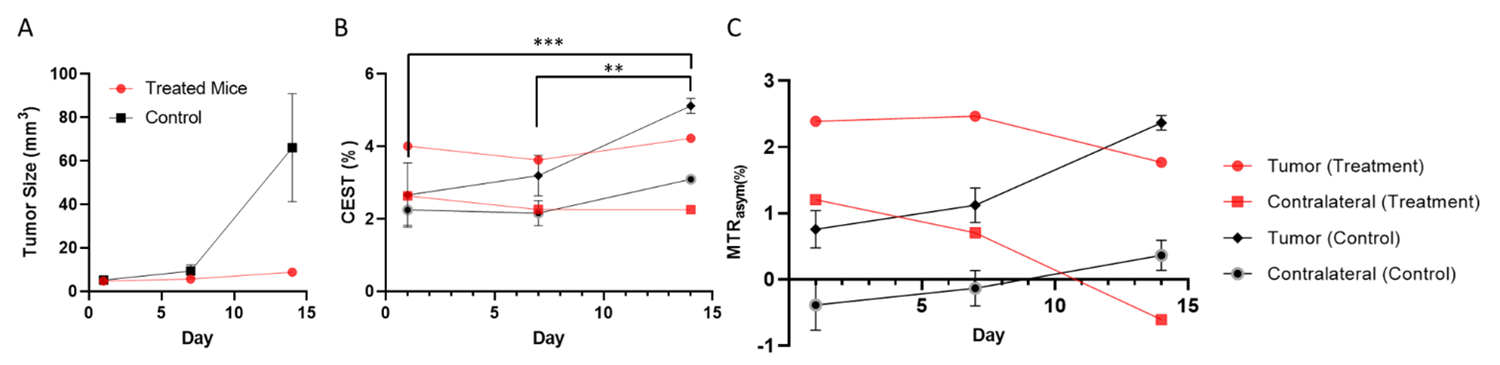
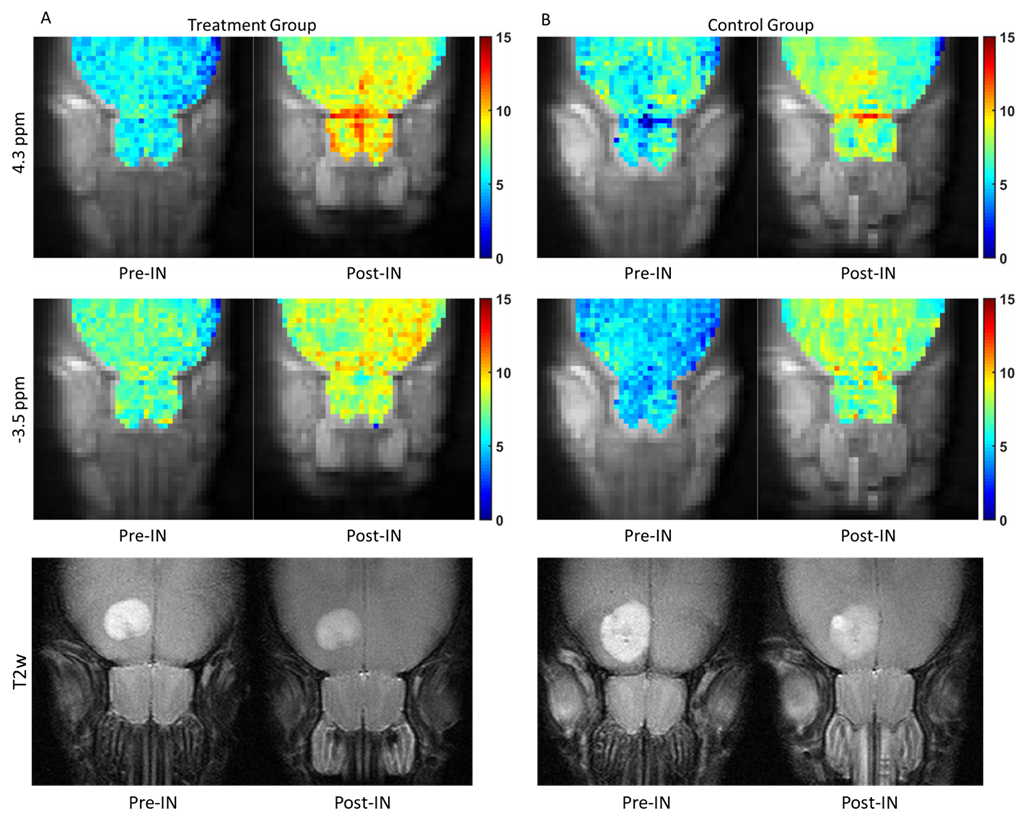
The tumor size was distinctively larger in control group than that in treatment group (Fig. 2&3). In the treatment group, the tumor size only increased from 4.8mm3 to 8.9mm3 from Day 1 to Day 14. The tumor size increased from 5.7mm3 to 83.7mm3 from Day 1 to Day 14 in control group. This demonstrated the efficacy of the intranasal treatment. Moreover, the CEST contrast at 3.5 ppm (APTw) remained at 4.0±0.3% for two weeks in the treatment group, while the APTw of control group significantly increased by 2.5±0.8% (P=0.0006) over two weeks. This also indicates the tumor suppression effect of the treatment liposome in the treatment group.We demonstrated -3.5 ppm could indicate the amount of liposomes reaches the brain3. By assessing the pre-injection and post-injection CEST contrast at -3.5 ppm (Fig.4), we estimated the dose reaching the brain in both treatment and control groups was comparable at about 92.8±6.1% from the olfactory bulb. In addition, CEST at 4.3 ppm belonged to the Iohexol loaded liposomes that could indicate the amount of intraliposomal drug delivered, which was at about 75.5±6.7% from the olfactory bulb. Notably, we can observe the CEST contrast at -3.5 ppm is higher surrounding the tumor region indicate the liposome accumulation around the tumor. This indicated there was a good number of liposomes reached the tumor after intranasal delivery.
Conclusion
Here, we developed a CEST MRI-guided glioblastoma treatment using intranasal liposomes, which successfully suppressed the tumor growth over two weeks. By monitoring CEST contrast at 3.5 ppm at the tumor region, the treatment effect and tumor progression can be examined. Meanwhile, the liposomal drug delivery could be monitored both at -3.5 ppm for liposomes and at 4.3 ppm for intraliposomal drug. By monitoring this unique CEST contrasts, tracking and monitoring of treatment-Lipo distribution inside the brain and drug delivery efficacy from nose-to-brain can be achieved. de the brain and drug delivery efficacy from nose-to-brain can be achieved.Acknowledgements
This work was supported by Research Grants Council (11102218, 11200422, RFS2223-1S02, C1134-20G), City University of Hong Kong (7005433, 7005626, 9609307, 9610560 and 9610616), National Natural Science Foundation of China (81871409), Tung Biomedical Sciences Centre and Hong Kong Centre for Cerebro-cardiovascular Health Engineering.References
1. Crowe TP, Greenlee MHW, Kanthasamy AG, Hsu WH. Mechanism of intranasal drug delivery directly to the brain. Life sciences 195, 44-52 (2018).
2. Lochhead JJ, Thorne RG. Intranasal delivery of biologics to the central nervous system. Advanced drug delivery reviews 64, 614-628 (2012).
3. Law, L. H., Huang, J., Xiao, P., Liu, Y., Chen, Z., Lai, J. H. C., Han, X., Cheng, G. W. Y., Tse, K. H., & Chan, K. W. Y. (2023). Multiple CEST contrast imaging of nose-to-brain drug delivery using iohexol liposomes at 3T MRI. Journal of controlled release : official journal of the Controlled Release Society, 354, 208–220. https://doi.org/10.1016/j.jconrel.2023.01.011
4. Van Zijl PC, Yadav NN. Chemical exchange saturation transfer (CEST): what is in a name and what isn't? Magnetic resonance in medicine 65, 927-948 (2011).
5. Zhang XY, et al. Accuracy in the quantification of chemical exchange saturation transfer (CEST) and relayed nuclear Overhauser enhancement (rNOE) saturation transfer effects. NMR in biomedicine 30, e3716 (2017).
6. Zhou J, Heo HY, Knutsson L, van Zijl PC, Jiang S. APT‐weighted MRI: techniques, current neuro applications, and challenging issues. Journal of Magnetic Resonance Imaging 50, 347-364 (2019).
7. Hanson, L. R., Fine, J. M., Svitak, A. L., & Faltesek, K. A. (2013). Intranasal administration of CNS therapeutics to awake mice. Journal of visualized experiments : JoVE, (74), 4440. https://doi.org/10.3791/4440
Figures