0403
Characterizing asymmetric deep medullary veins by 7.0T susceptibility-weighted MRI to predict glioma genotype and Ki-67 index1Chinese PLA General Hospital, Beijing, China, 2MR Research Collaboration Team, Siemens Healthineers, Beijing, China
Synopsis
Keywords: Tumors (Pre-Treatment), High-Field MRI, susceptibility-weighted MRI
Motivation: Knowing the genotype of gliomas is critical for prognostic assessment and treatment selection. 7.0T susceptibility-weighted imaging (SWI) allows visualizing the deep medullary veins and provides additional metabolic information.
Goal(s): We used the asymmetric deep medullary vein (ADMV) sign on 7.0T SWI to predict glioma isocitrate dehydrogenase mutation status and Ki-67 expression level.
Approach: We assessed the ADMV sign and conventional morphological and screening features (P<0.1) via multivariate logistic regression to evaluate the predicted performance.
Results: The ADMV sign on 7.0T images was independently associated with isocitrate dehydrogenase mutation status and Ki-67 index and improved the images’ diagnostic efficacy.
Impact: Discovery of the ADMV sign as an imaging biomarker and the advantages of 7.0T MRI may help markedly improve the diagnosis and management of gliomas and may have broader applications in medical imaging and biomarker development.
Introduction
Conventional 3.0T magnetic resonance imaging (MRI) enables differentially diagnosing most central nervous system tumors [1]. However, determining the genotype of gliomas, which is essential for prognosis and treatment planning, remains challenging [2, 3]. 7.0T susceptibility-weighted imaging (SWI) allows visualizing the deep medullary veins (DMVs), which may serve as a novel imaging marker [4]. In this study, we assessed the diagnostic value of the asymmetric deep medullary vein (ADMV) sign on 7.0T SWI for predicting glioma isocitrate dehydrogenase (IDH) mutation status and Ki-67 expression level.Methods
Participants with suspected gliomas were consecutively and prospectively recruited from January 2022 to May 2023. The inclusion criteria were a) aged >18 years; b) 7.0T SWI and 3.0T SWI, T1 fluid-attenuated inversion recovery (FLAIR), T2w, and T2-FLAIR performed before treatment; and c) pathologically confirmed glioma. The exclusion criteria were a) lesions approximately symmetrically distributed in both cerebral hemispheres; b) suffering from other brain diseases; and c) artifacts that reduced imaging quality.The study was approved by the local research ethics committee and registered at ClinicalTrials.gov. All patients provided signed informed consent. The study was performed on a 7.0T whole-body MRI scanner (MAGNETOM Terra, Siemens Healthcare, Erlangen, Germany) with an 8Tx/32Rx channel head coil and on a 3.0T whole-body MRI scanner (GE Discovery 750 MR, GE Healthcare, Milwaukee, WI, USA) with an 8-channel head coil. The 7.0T SWI sequence parameters were: repetition time 21 msec, echo time 14 msec, field of view 220×179 mm2, slice thickness 1.5 mm, number of slices 80, and measurement duration 7 minutes 29 seconds. The 3.0T SWI sequence parameters on the 3.0T SWI scanner were: repetition time 27 msec, echo time 25 msec, field of view 240×240 mm2, slice thickness 3 mm, number of slices 80, and measurement duration 2 minutes 45 seconds.
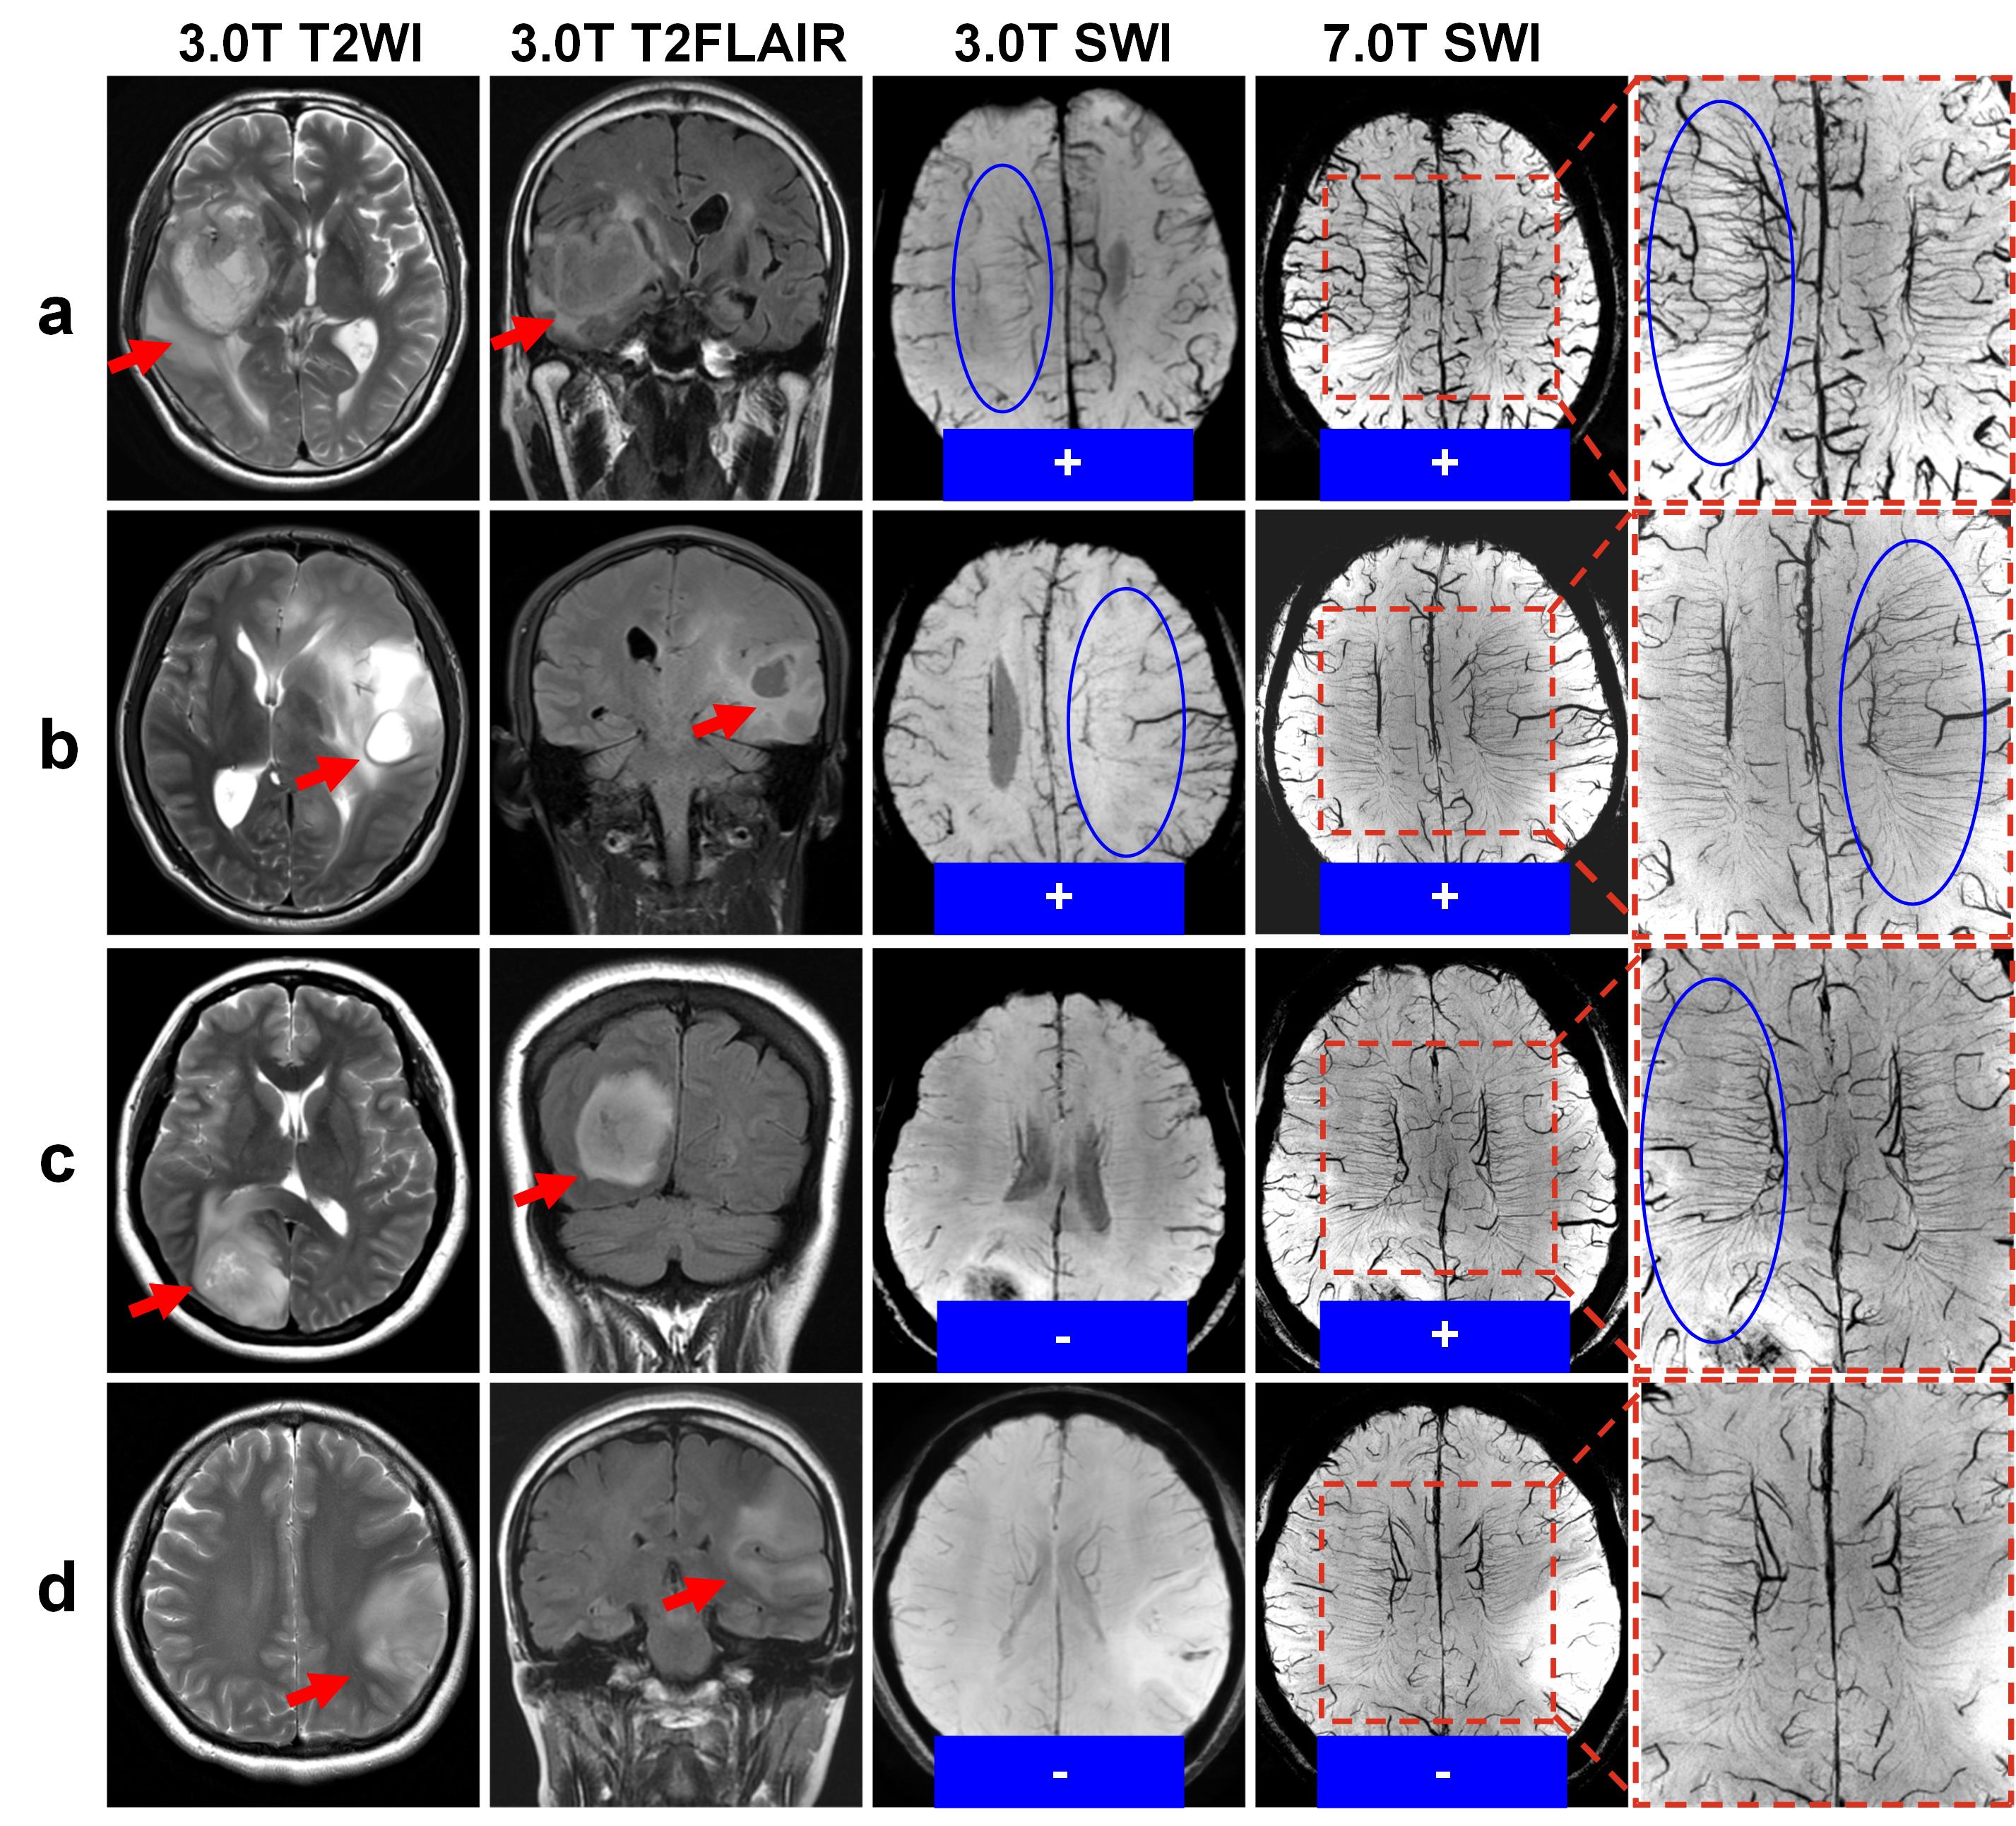
Two neuroradiologists blinded to the patients’ clinical and pathological data separately assessed conventional MRI and SWI. The ADMV sign was defined as DMVs in the affected hemisphere being greater in number, length, or diameter than those in the normal hemisphere. As per previous studies [5, 6], morphological features including the lesion side, tumor location, lesion distribution, edema, diameter, mass effect and cortex involvement were evaluated. Pearson’s chi-square test was used to screen morphological features with P<0.1 for inclusion in the multivariate binary logistic regression models predicting IDH genotype and Ki-67 expression levels. Receiver operating characteristic curves were constructed to assess the diagnostic performance. DeLong’s test was performed to compare the areas under the curve (AUC) between the models. Statistical analyses were performed using SPSS 26.0 (IBM Corp., Armonk, NY, USA). Statistical significance was set at P<0.05.
Results
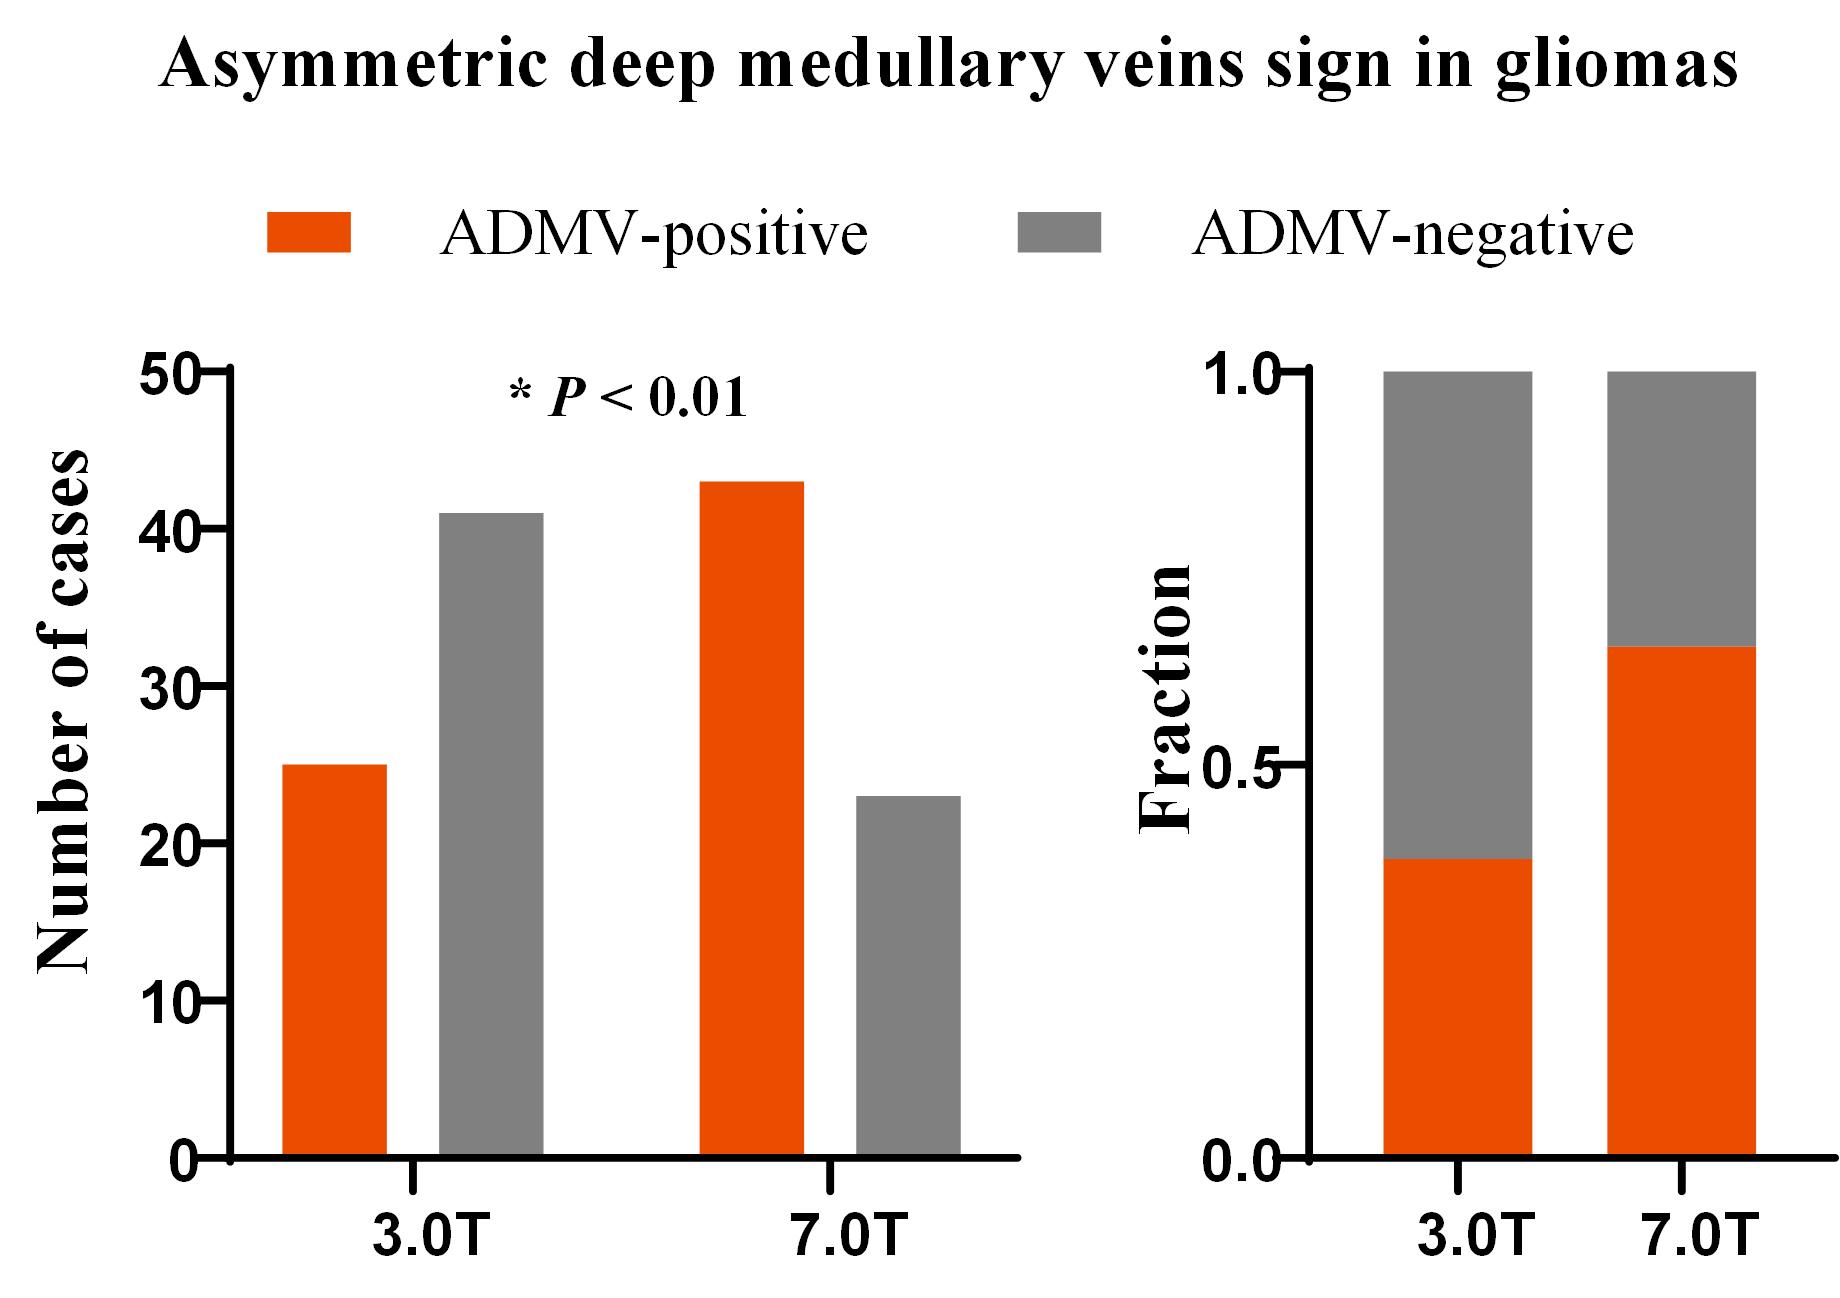
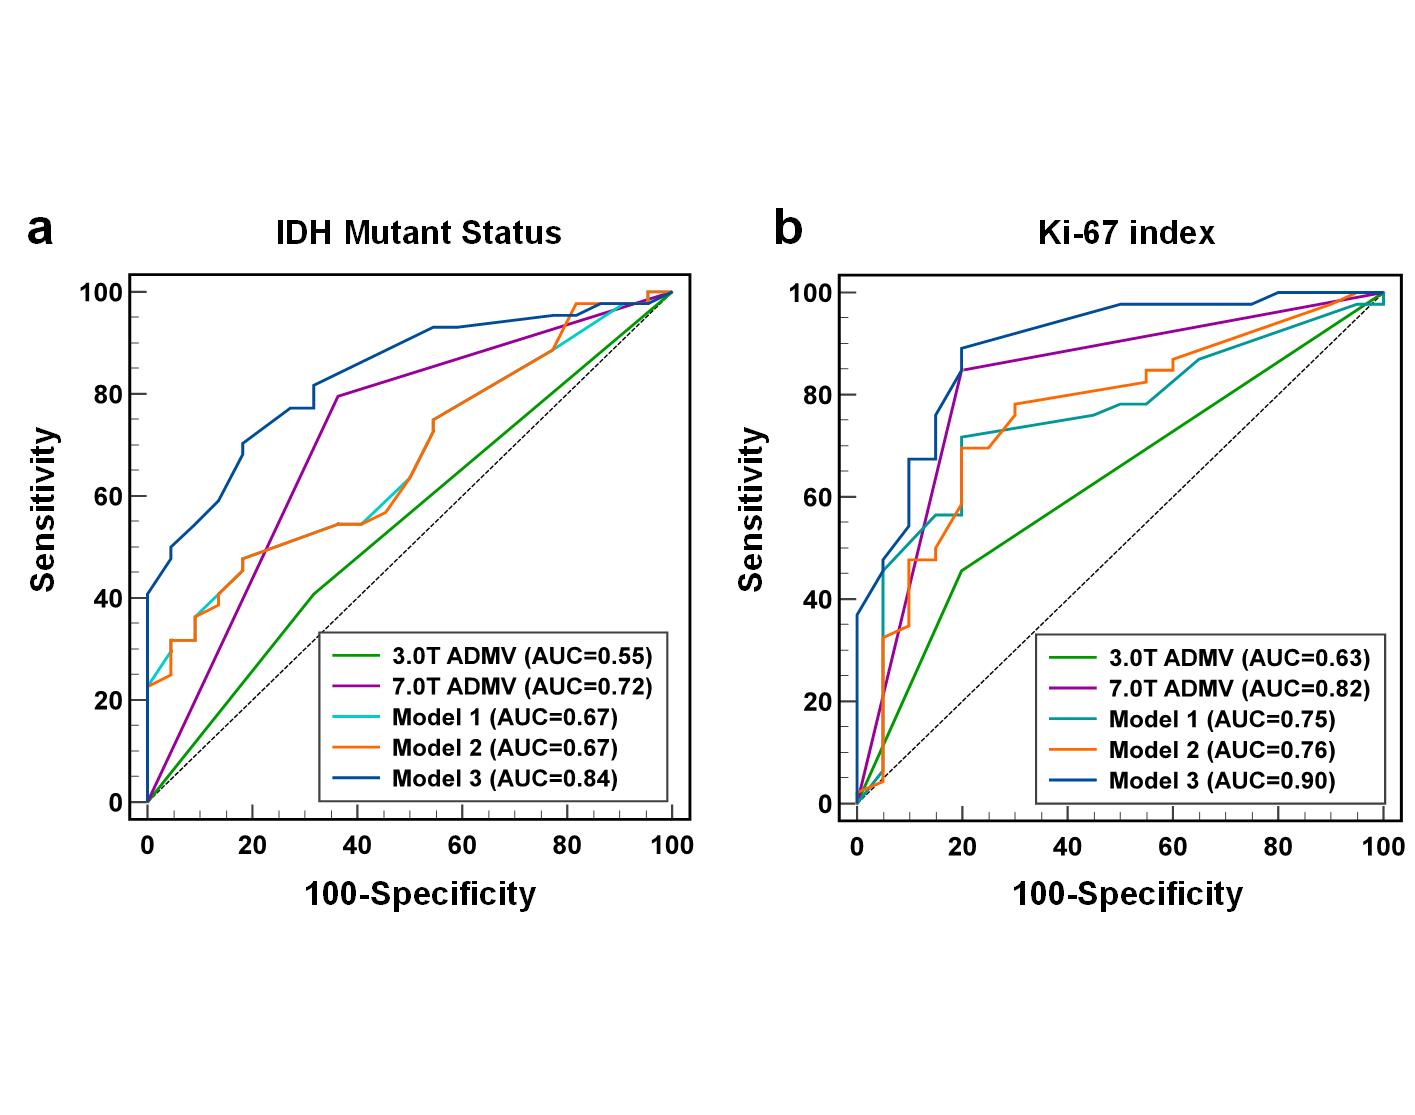
Sixty-six participants (mean age, 50 ± 12 years; 35 men and 31 women) were enrolled, of which, 43 (65.1%) and 25 (37.9%) showed the ADMV sign on 7.0T and 3.0T images, respectively (Figure.1). Figure.2 shows some typical cases.Univariate analyses showed that glioma location, lesion distribution, and the 7.0T ADMV sign were associated with IDH mutation status. In the multivariate logistic regression model, only the 7.0T ADMV sign was an independent predictor of IDH mutation status (adjusted odds ratio, 4.62; 95% confidence interval [CI]:1.3–16.3; P=0.017). The area under the receiver operating characteristic (AUROC) curve for the 7.0T ADMV sign was 0.72 (95% CI: 0.59–0.82; P<0.001), with 80% sensitivity, 64% specificity, and 74% accuracy. Adding the ADMV sign on 7.0T images to the conventional morphological model improved IDH mutation status predictability (AUC, 0.79; 95% CI: 0.67–0.88 vs. AUC, 0.73; 95% CI: 0.60–0.83; DeLong’s test, P=0.218). (Figure. 3)
Univariate analyses showed that glioma distribution, diameter, and the 7.0T ADMV sign were associated with high and low Ki-67 expression. In the multivariate logistic regression model, only the 7.0T ADMV sign was an independent predictor of high and low Ki-67 expression (adjusted odds ratio, 50.8; 95% CI:5.6–463.5; P<0.001). The 7.0T ADMV sign had an AUC of 0.82 (95% CI: 0.70–0.90; P<0.001) for distinguishing high and low Ki-67 expression, with 90% sensitivity, 73% specificity, and 83% accuracy. Adding the 7.0T ADMV sign to the conventional morphological model improved prediction of the Ki-67 index (AUC, 0.87; 95% CI: 0.77–0.94 vs. AUC, 0.72; 95% CI: 0.59–0.82; DeLong’s test, P=0.012). (Figure. 3)
Discussion and Conclusion
The ADMV sign is a valuable imaging biomarker for predicting IDH mutation status and Ki-67 index in glioma patients, enabling noninvasive estimation of molecular features before surgery. Moreover, 7.0T MRI showed significant advantages over conventional field strength for visualizing DMVs.Acknowledgements
This work was supported by the National Natural Science Foundation of China (No.81825012, No. 82151309 to X.L. and No. 82271952 to J.H.L).References
[1] You S H, Yun T J, Choi H J, et al. Differentiation between primary CNS lymphoma and glioblastoma: qualitative and quantitative analysis using arterial spin labeling MR imaging. European radiology 2018;28:3801-10.
[2] Hartmann C, Hentschel B, Wick W, et al. Patients with IDH1 wild type anaplastic astrocytomas exhibit worse prognosis than IDH1-mutated glioblastomas, and IDH1 mutation status accounts for the unfavorable prognostic effect of higher age: implications for classification of gliomas. Acta neuropathologica 2010;120:707-18.
[3] Pouget C, Hergalant S, Lardenois E, et al. Ki-67 and MCM6 labeling indices are correlated with overall survival in anaplastic oligodendroglioma, IDH1-mutant and 1p/19q-codeleted: a multicenter study from the French POLA network. Brain pathology (Zurich, Switzerland) 2020;30:465-78.[4] Zwanenburg J J, Versluis M J, Luijten P R, et al. Fast high resolution whole brain T2* weighted imaging using echo planar imaging at 7T. NeuroImage 2011;56:1902-7.
[5] Zhou H, Vallières M, Bai H X, et al. MRI features predict survival and molecular markers in diffuse lower-grade gliomas. Neuro-oncology 2017;19:862-70.
[6] Maynard J, Okuchi S, Wastling S, et al. World Health Organization Grade II/III Glioma Molecular Status: Prediction by MRI Morphologic Features and Apparent Diffusion Coefficient. Radiology 2020;296:111-21.
Figures