0401
Intensity normalization of ASL measured perfusion improves reproducibility and treatment evaluation in glioblastoma patients1Department of Radiology, UT Southwestern Medical Center, Dallas, TX, United States, 2Philips Healthcare, Shanghai, China, 3Advanced Imaging Research Center, UT Southwestern Medical Center, Dallas, TX, United States, 4Department of Neurology, UT Southwestern Medical Center, Dallas, TX, United States, 5Department of Hematology and Oncology, UT Southwestern Medical Center, Dallas, TX, United States
Synopsis
Keywords: Tumors (Post-Treatment), Translational Studies, Treatment response, Cancer, Glioblastoma (GBM), Reproducibility, Perfusion, Quantitative Imaging
Motivation: Chemoradiation in patients with glioblastoma (GBM) causes a 10-13% perfusion decrease in normal appearing tissue, confounding reproducibility of ASL measurements and longitudinal treatment evaluations. This confounds intra-patient and inter-patient comparisons, irrespective of perfusion variations from tumor progression/response.
Goal(s): To improve ASL measurement reproducibility and longitudinal treatment assessment in GBM patients using intensity normalization methods.
Approach: Different normalization methods were applied to ASL measured perfusion in a prospective study for reproducibility analyses and response assessment.
Results: Intensity normalization of ASL measured perfusion in GBM patients improved reproducibility enabling longitudinal treatment evaluation for intra- and inter-patient comparisons.
Impact: Intensity normalization of ASL reduces variability, improves reproducibility, and enables accurate quantitative intra- and inter-patient comparison. This can play an important role in evaluating treatment response assessment and building predictive models with ASL across different studies and sites.
Introduction
Arterial spin labeling (ASL) MRI enables absolute quantitative perfusion measurements and shows promise as an early biomarker of treatment response compared to existing criteria [1, 2]. The non-invasive, exogenous contrast agent free nature of ASL makes it well-suited for longitudinal therapy monitoring. Several studies demonstrated good reproducibility of ASL-MRI perfusion measures in healthy volunteers [3-5], supporting clinical utility. However, the reproducibility of ASL measurements in patients with glioblastoma (GBM) is confounded by a 10-13% perfusion decrease in normal appearing tissue [6, 7] associated with chemoradiation. This also hinders the longitudinal treatment evaluation for intra-patient and inter-patient comparisons, irrespective of perfusion variations from tumor progression/response. This study aimed to improve ASL measurement reproducibility and longitudinal treatment assessment in GBM using intensity normalization techniques.Methods
Subjects: With IRB approval, 20 healthy volunteers (mean age: 25 ± 2 years) and 23 newly diagnosed GBM patients (mean age: 59 ± 14 years) were recruited for longitudinal scans (Figure 1A and 1B). Two runs of 3D ASL were performed at each imaging session. All scans were performed on a 3T MR scanner (Ingenia, Philips Healthcare) with a 32-channel head coil.Image acquisition: ASL scans were acquired with pCASL label duration (LD)/post-label delay (PLD) = 1.8/1.8 s, acquired resolution = 3.5×3.5×6 mm3, reconstructed resolution = 3×3×3 mm3, 4 background suppression pulses and 5 inflow saturation pulses, TR/TE = 6000/14 ms, echo spacing = 2.8 ms, TSE factor = 80, 1 repetition, 3D CASPR view ordering [8], and acquisition time = 3:10 minutes. A M0 image was acquired using the same acquisition parameters in 1:30 minutes.
Image analysis: Entire processing pipeline (Figure 1C) for ASL included format conversion from DICOM to NIfTI followed by skull stripping. ASL images were co-registration to the SRI24 atlas [9] for healthy volunteers. But ASL were co-registered to baseline (T0) T1 post-contrast images in GBM. Cerebral blood flow (CBF) maps were calculated based on the ASL consensus paper recommendations [10] followed by normalization using four different techniques (Guassian, Z-score, WhiteStripe[11] and Nyul [12]) with equations shown below:
$$$CBF_{Guassian} = \frac{CBF}{\sigma(CBF_{WholeBrain})}$$$
$$$CBF_{Z-score} = \frac{CBF - \mu(CBF_{WholeBrain})}{\sigma(CBF_{WholeBrain})}$$$
$$$CBF_{WhiteStripe} = \frac{CBF - \mu(CBF_{NAWM})}{\sigma(CBF_{NAWM})}$$$
$$$CBF_{Nyul} = HistogramMapping(CBF)$$$
The implementation of Nyul’s method was based on the following repository (https://githu b.com/jcreinhold /intensity-normalization). For WhiteStripe, white matter masks were used for healthy volunteers and normal appearing white matter (NAWM) were used for GBM by subtracting white matter masks from tumor related ROIs (Figure 1D).
Statistical analysis: Violin plots of mean perfusion values were generated using GraphPad Prism. The reproducibility was measured using Bland–Altman analyses, within-subject coefficients of variation (wsCV), intraclass correlation coefficient (ICC), and concordance correlation coefficient (CCC) with R.
Results and Discussion
Improved reproducibility after normalization: Violin plots of mean perfusion values from healthy volunteers and GBM are shown in Figure 2 for intrasession and intersession reproducibility evaluation with and without intensity normalization. For healthy volunteers, all four methods could normalize the dataset and stratify perfusion values of white matter and grey matter compared to the original perfusion maps. However, no method was able to stratify the perfusion values between NAGM and NAWM in GBM, potentially due to a wide age range (28 – 82 yrs) and lower perfusion values of NAGM in older individuals. Moreover, the scatter plot (Figure 3A) of statistical analyses showed improved reproducibility with a significant increase of ICC/CCC values and decreased wsCV and Bland-Altman biases. Detailed results of statistical analyses are shown in Figure 3B.Improved longitudinal treatment evaluation: A representative intrapatient comparison during longitudinal imaging is shown in Figure 4. Before normalization, the original ASL maps showed a significant decrease in perfusion in both NAGM and enhancing regions at the T34 time point, with absolute perfusion values within enhancing regions similar to NAGM values observed at T0. This complicates intrapatient comparisons to determine treatment response or build quantitative predictive models for disease progression. However, normalization methods like Nyul and WhiteStripe can bring the NAGM to similar levels between different time points for better longitudinal evaluation. Moreover, intensity normalization of ASL measured perfusion can also enable interpatient comparisons (Figure 5). Among different patients, the absolute perfusion values of NAGM and tumors vary, which makes it difficult for survival prediction based on perfusion stratification. The perfusion normalization enabled better stratification with patients 2 and 3 into one group and patients 1 and 4 into another group, which was confirmed by the difference in overall survival duration between the two groups (short and long survival).
Conclusion
Intensity normalization of ASL measured perfusion in glioblastoma patients improves reproducibility and could potentially provide improved assessment of therapy response for intra- and inter-patient comparisons.Acknowledgements
This work was supported by NIH/NCI grant U01CA207091. The authors thank Kelli Key, PhD, Abey Thomas, RT(MR), Courtney Dawson, RT(MR), Michael Fulkerson, AS, LVN, and Sydney Haldeman, MPH, for their help in human imaging, and Ben Wagner, MSEE, for his help with image database and analysis routines. The authors would also like to thank all patients and healthy volunteers for their participation in this study.References
1. Eisenhauer, E.A., et al., New response evaluation criteria in solid tumours: revised RECIST guideline (version 1.1). Eur J Cancer, 2009. 45(2): p. 228-47.
2. Wen, P.Y., et al., Response Assessment in Neuro-Oncology Clinical Trials. J Clin Oncol, 2017. 35(21): p. 2439-2449.
3. Wu, B., et al., Intra- and interscanner reliability and reproducibility of 3D whole-brain pseudo-continuous arterial spin-labeling MR perfusion at 3T. J Magn Reson Imaging, 2014. 39(2): p. 402-9.
4. Mutsaerts, H.J., et al., Inter-vendor reproducibility of pseudo-continuous arterial spin labeling at 3 Tesla. PLoS One, 2014. 9(8): p. e104108.
5. Wang, Y., et al., Regional reproducibility of pulsed arterial spin labeling perfusion imaging at 3T. Neuroimage, 2011. 54(2): p. 1188-95.
6. Petr, J., et al., A systematic review on the use of quantitative imaging to detect cancer therapy adverse effects in normal-appearing brain tissue. MAGMA, 2022. 35(1): p. 163-186.
7. Petr, J., et al., Photon vs. proton radiochemotherapy: Effects on brain tissue volume and perfusion. Radiother Oncol, 2018. 128(1): p. 121-127.
8. Greer, J.S., et al., Robust pCASL perfusion imaging using a 3D Cartesian acquisition with spiral profile reordering (CASPR). Magn Reson Med, 2019. 82(5): p. 1713-1724.
9. Rohlfing, T., et al., The SRI24 multichannel atlas of normal adult human brain structure. Hum Brain Mapp, 2010. 31(5): p. 798-819.
10. Alsop, D.C., et al., Recommended Implementation of Arterial Spin-Labeled Perfusion MRI for Clinical Applications: A Consensus of the ISMRM Perfusion Study Group and the European Consortium for ASL in Dementia. Magnetic Resonance in Medicine, 2015. 73(1): p. 102-116.
11. Shinohara, R.T., et al., Statistical normalization techniques for magnetic resonance imaging. Neuroimage Clin, 2014. 6: p. 9-19.
12. Nyul, L.G., J.K. Udupa, and X. Zhang, New variants of a method of MRI scale standardization. IEEE Trans Med Imaging, 2000. 19(2): p. 143-50.
Figures
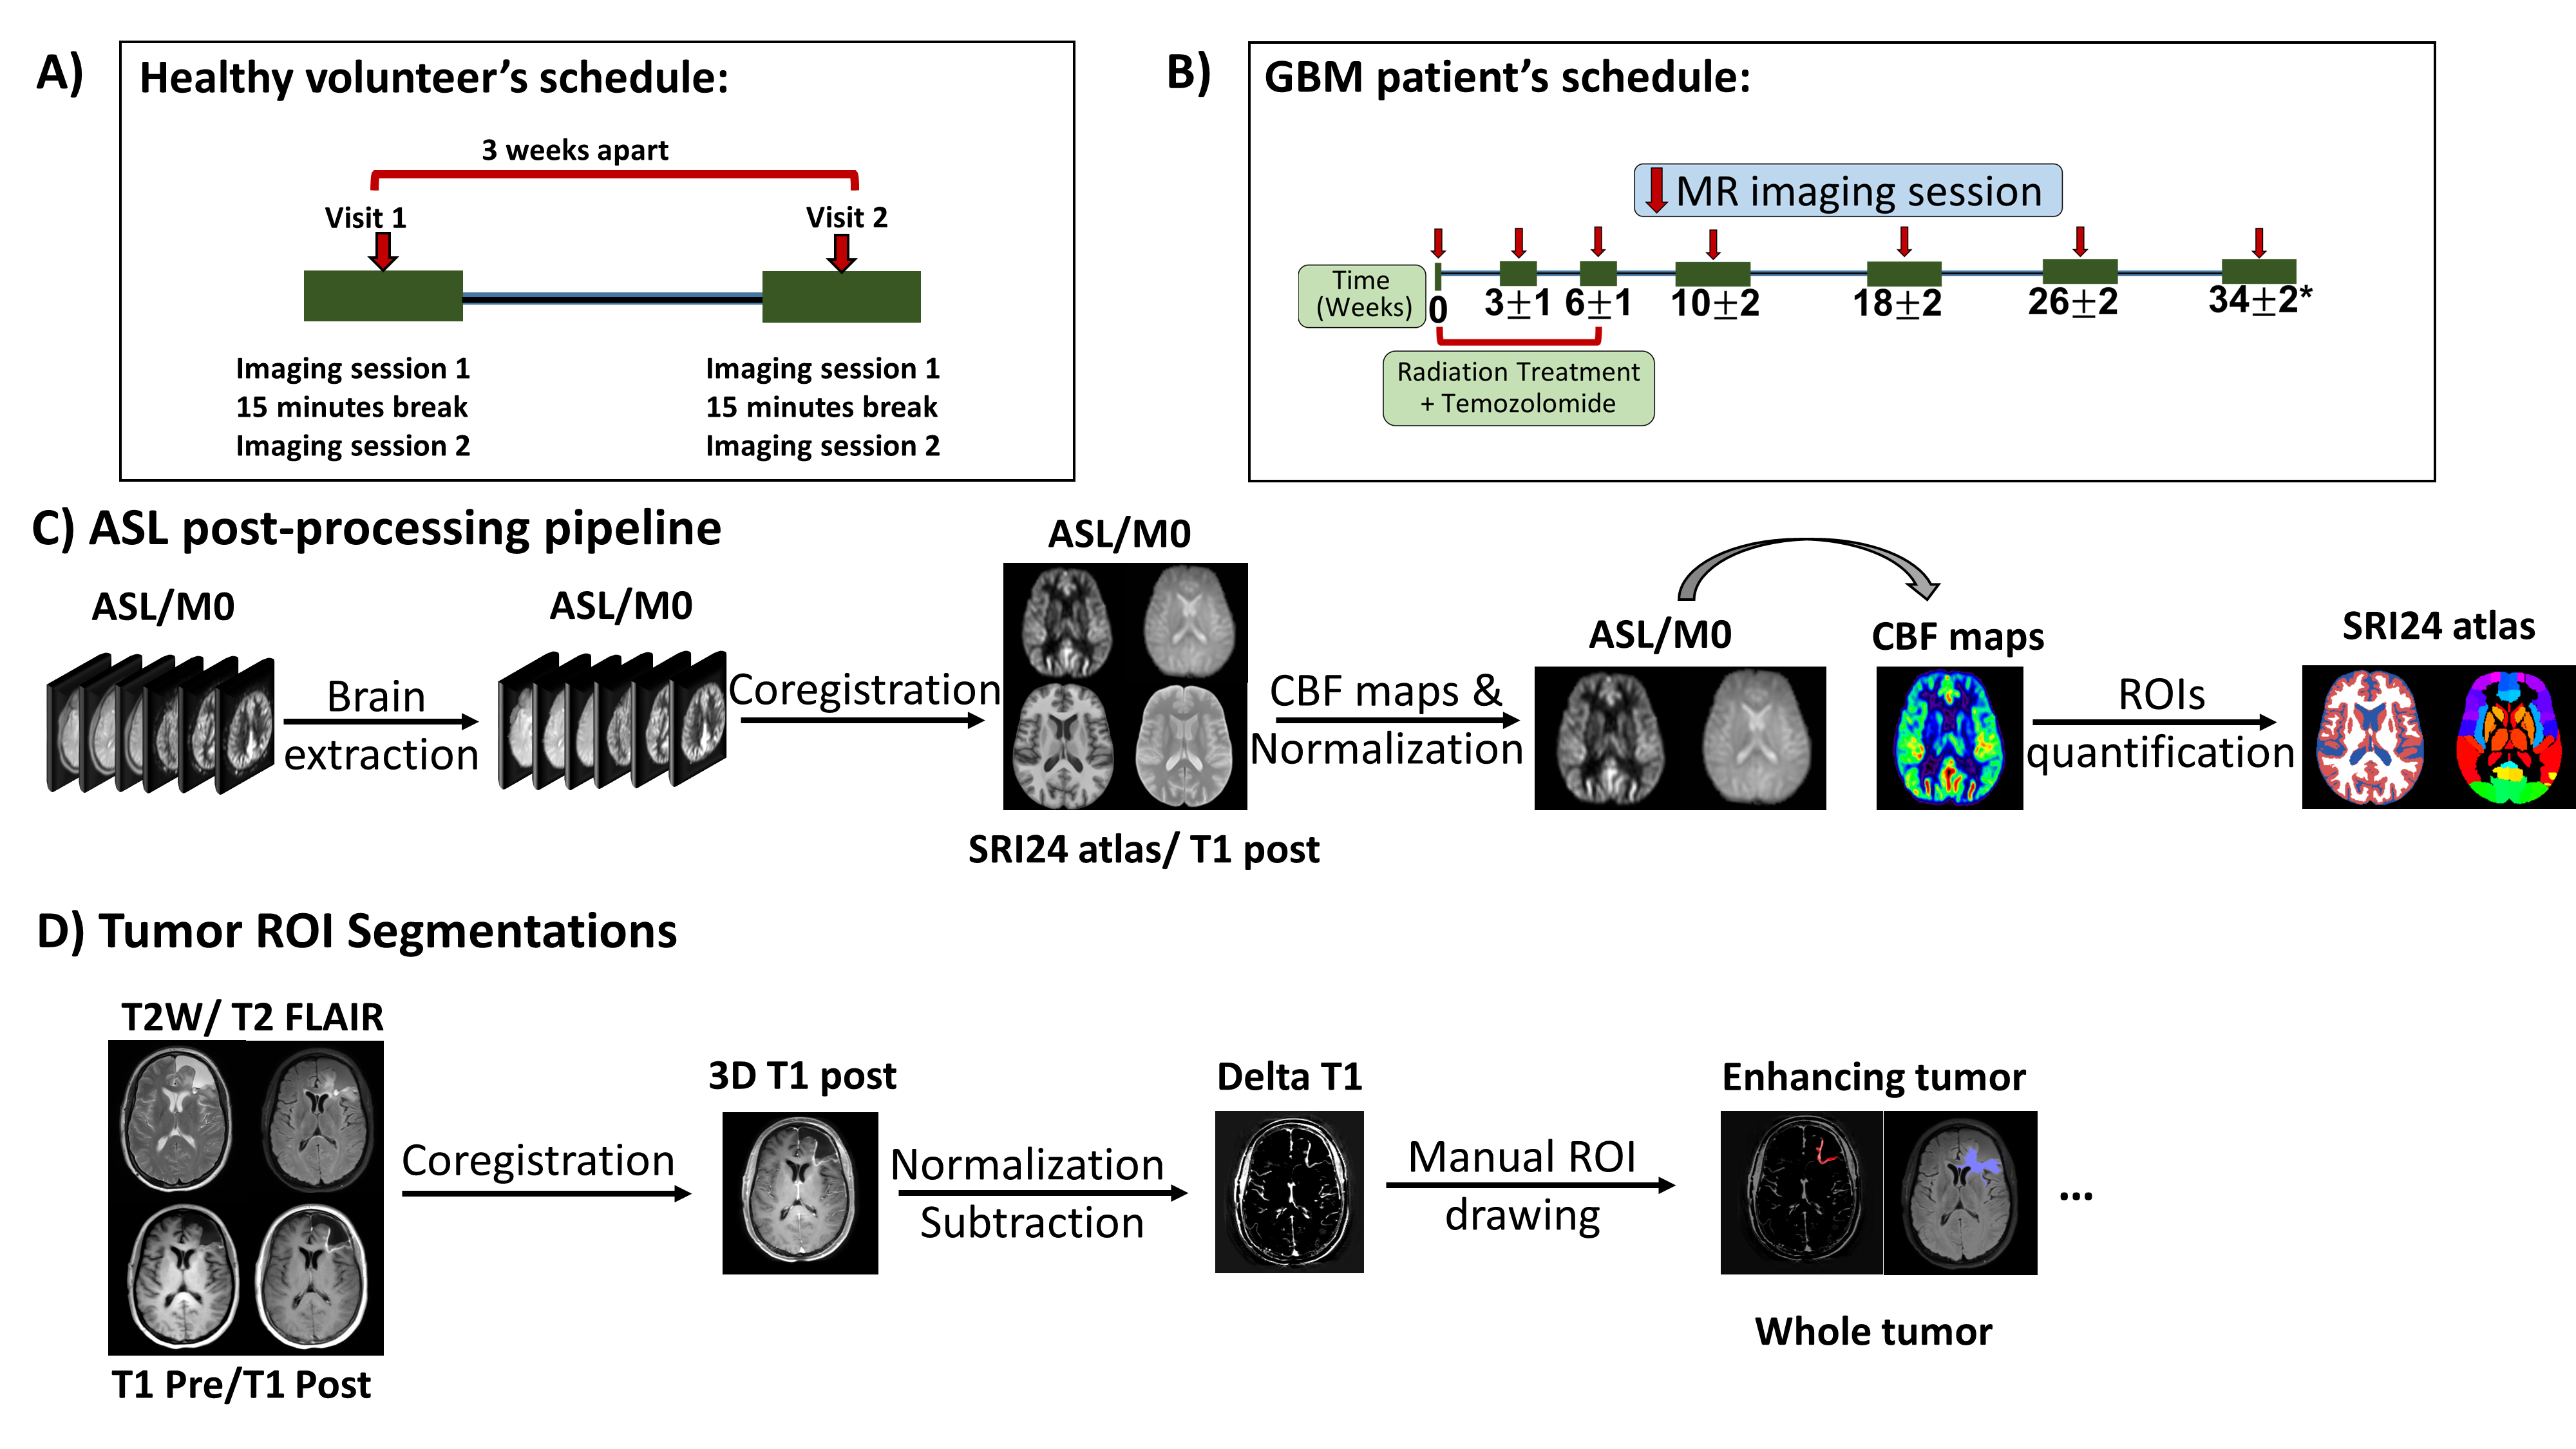
Figure 1: MR scan timelines for healthy volunteers (A) and patients with glioblastoma (B); post-processing pipelines for ASL (C) and tumor ROI segmentations in patients (D). A) Each healthy volunteer was scanned twice with two runs of 3D ASL for each session. B) Each patient was scanned longitudinally with two runs of 3D ASL for each session. C) ASL post-processing pipeline included skull stripping, co-registration, cerebral blood flow (CBF) quantification, and normalization. D) Manual ROIs related to tumor were drawn by an experienced neuroradiologist (M.P.) for analysis.
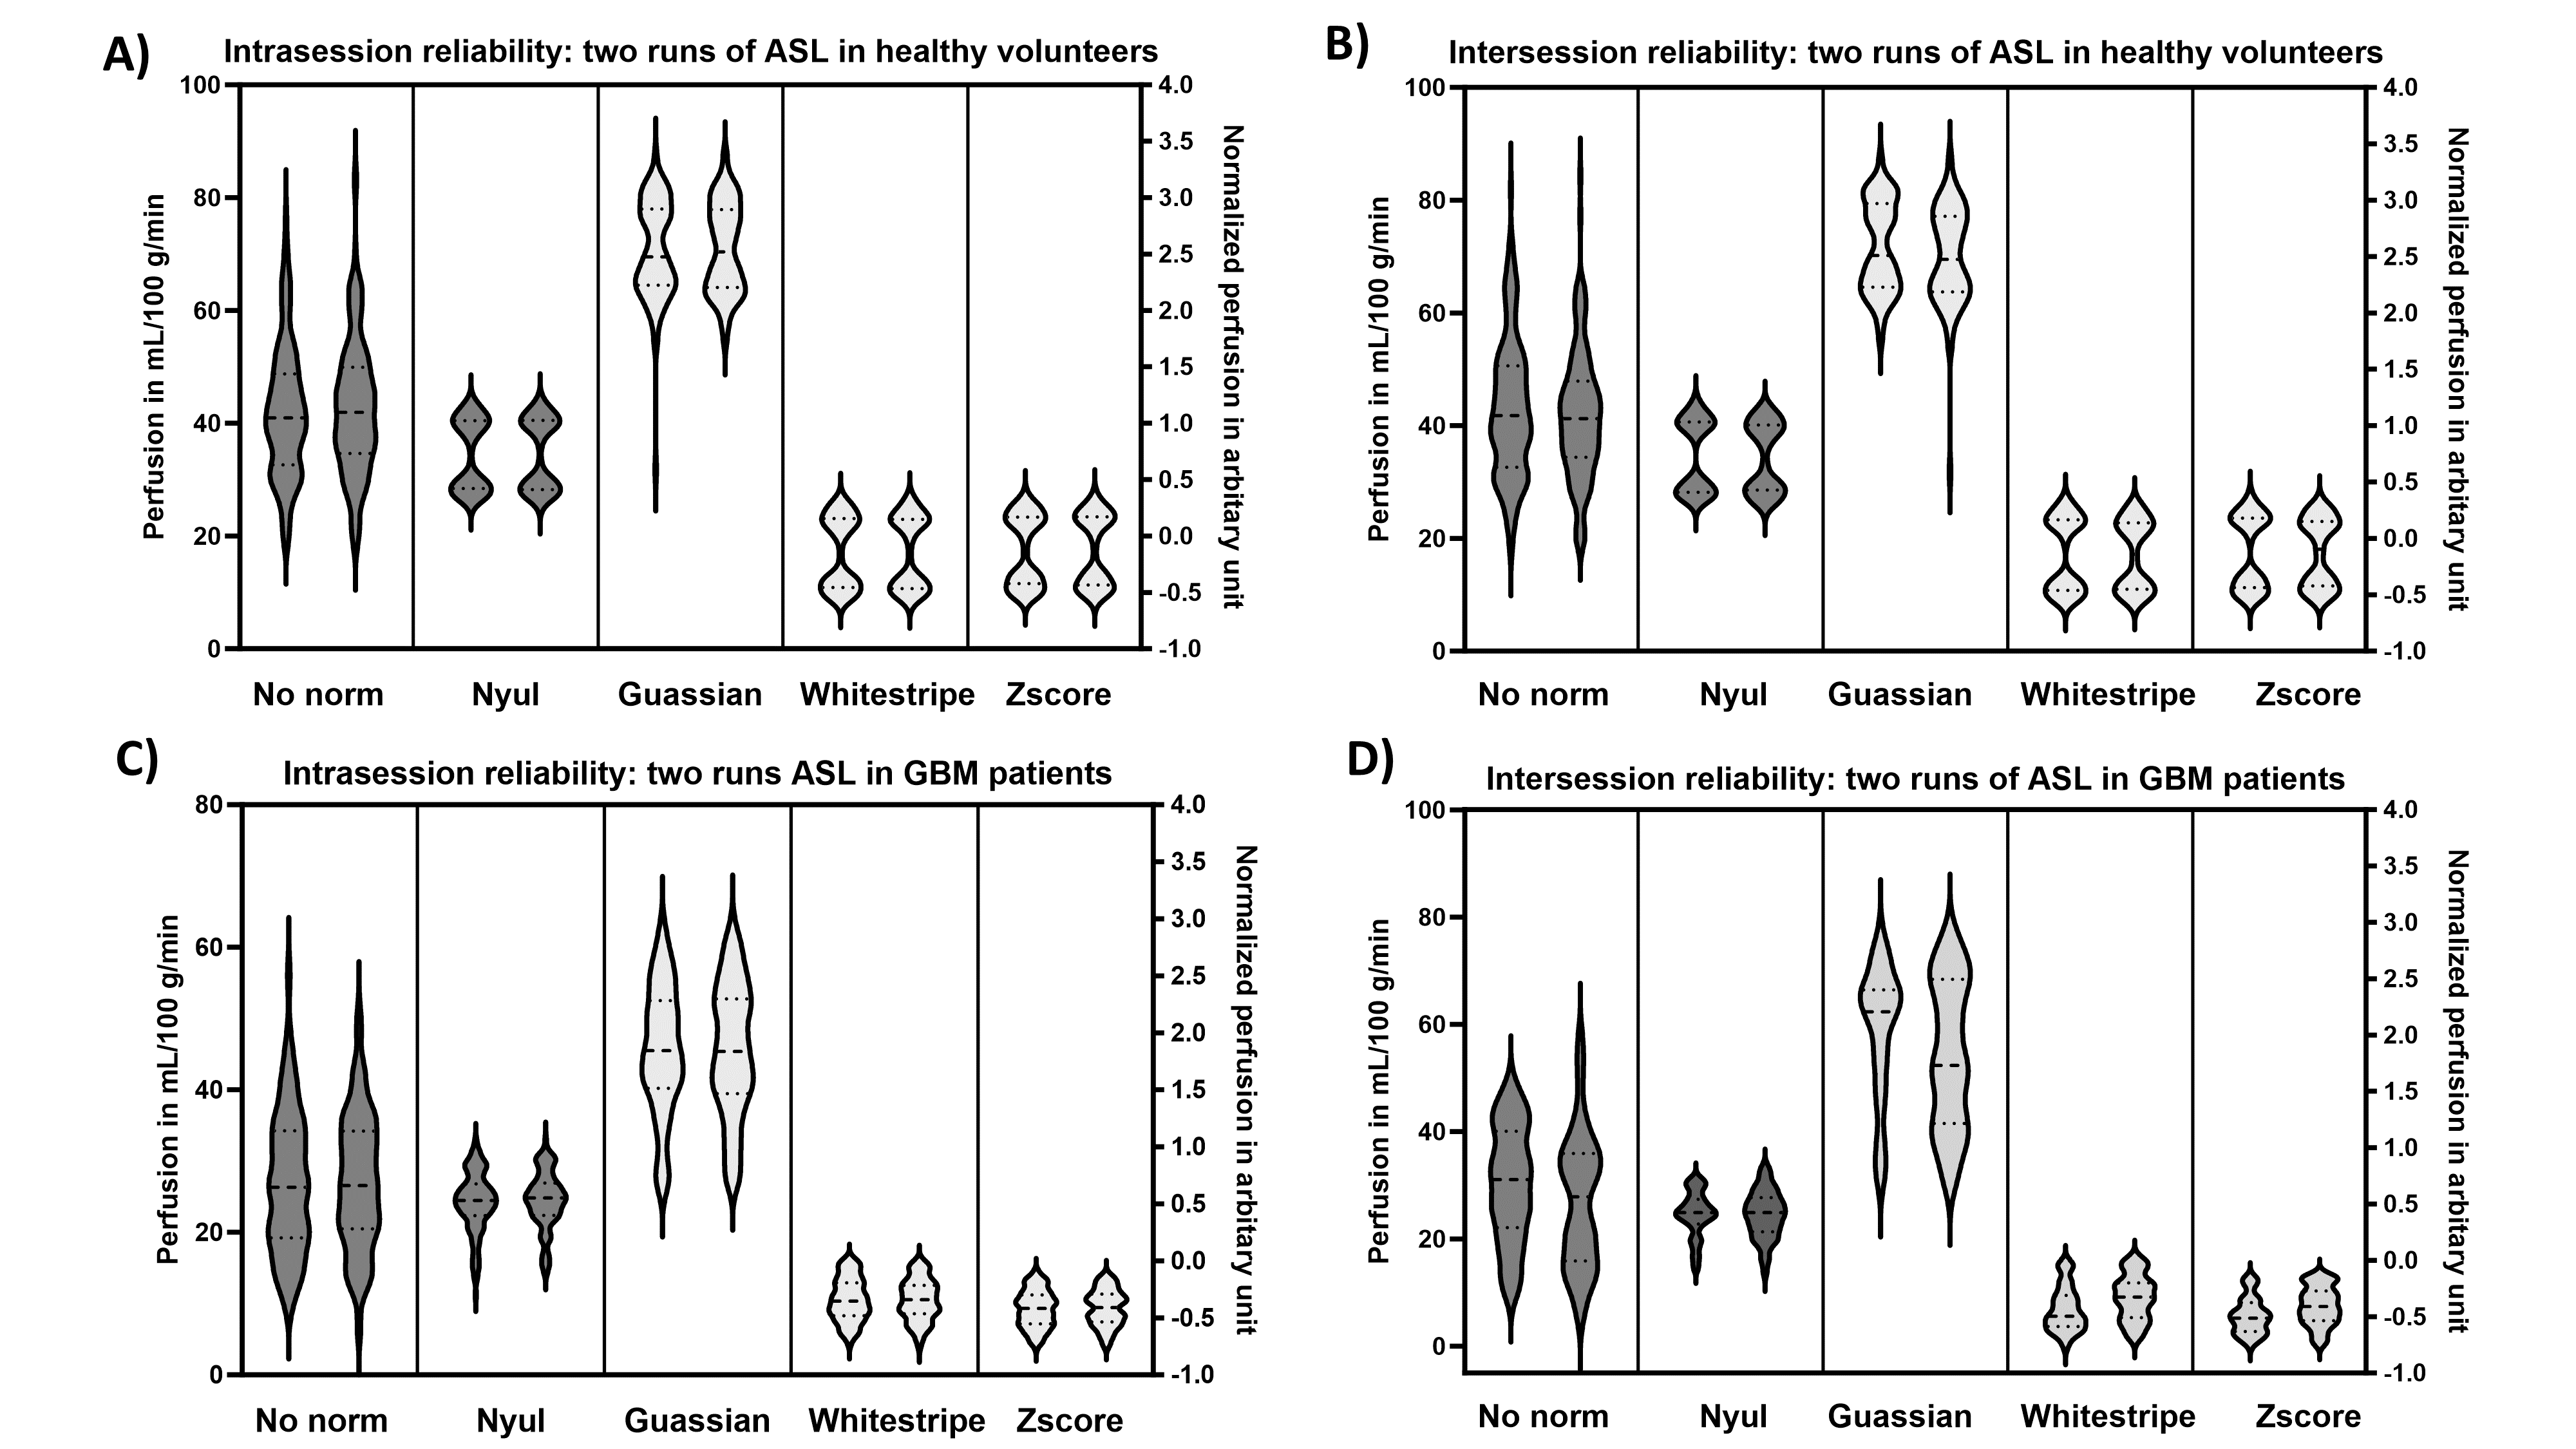
Figure 2: Violin plots of mean perfusion values from healthy volunteers (A and B) and patients with GBM (C and D) for intrasession reliability (A, C) and intersession reproducibility (B, D) evaluation with and without intensity normalization. For healthy volunteers, mean perfusion values were obtained from grey matter and white matter masks. For GBM patients, mean perfusion values were extracted from normal appearing grey matter and normal appearing white matter by excluding the tumor regions manually drawn by an experienced neuroradiologist (M.P.).
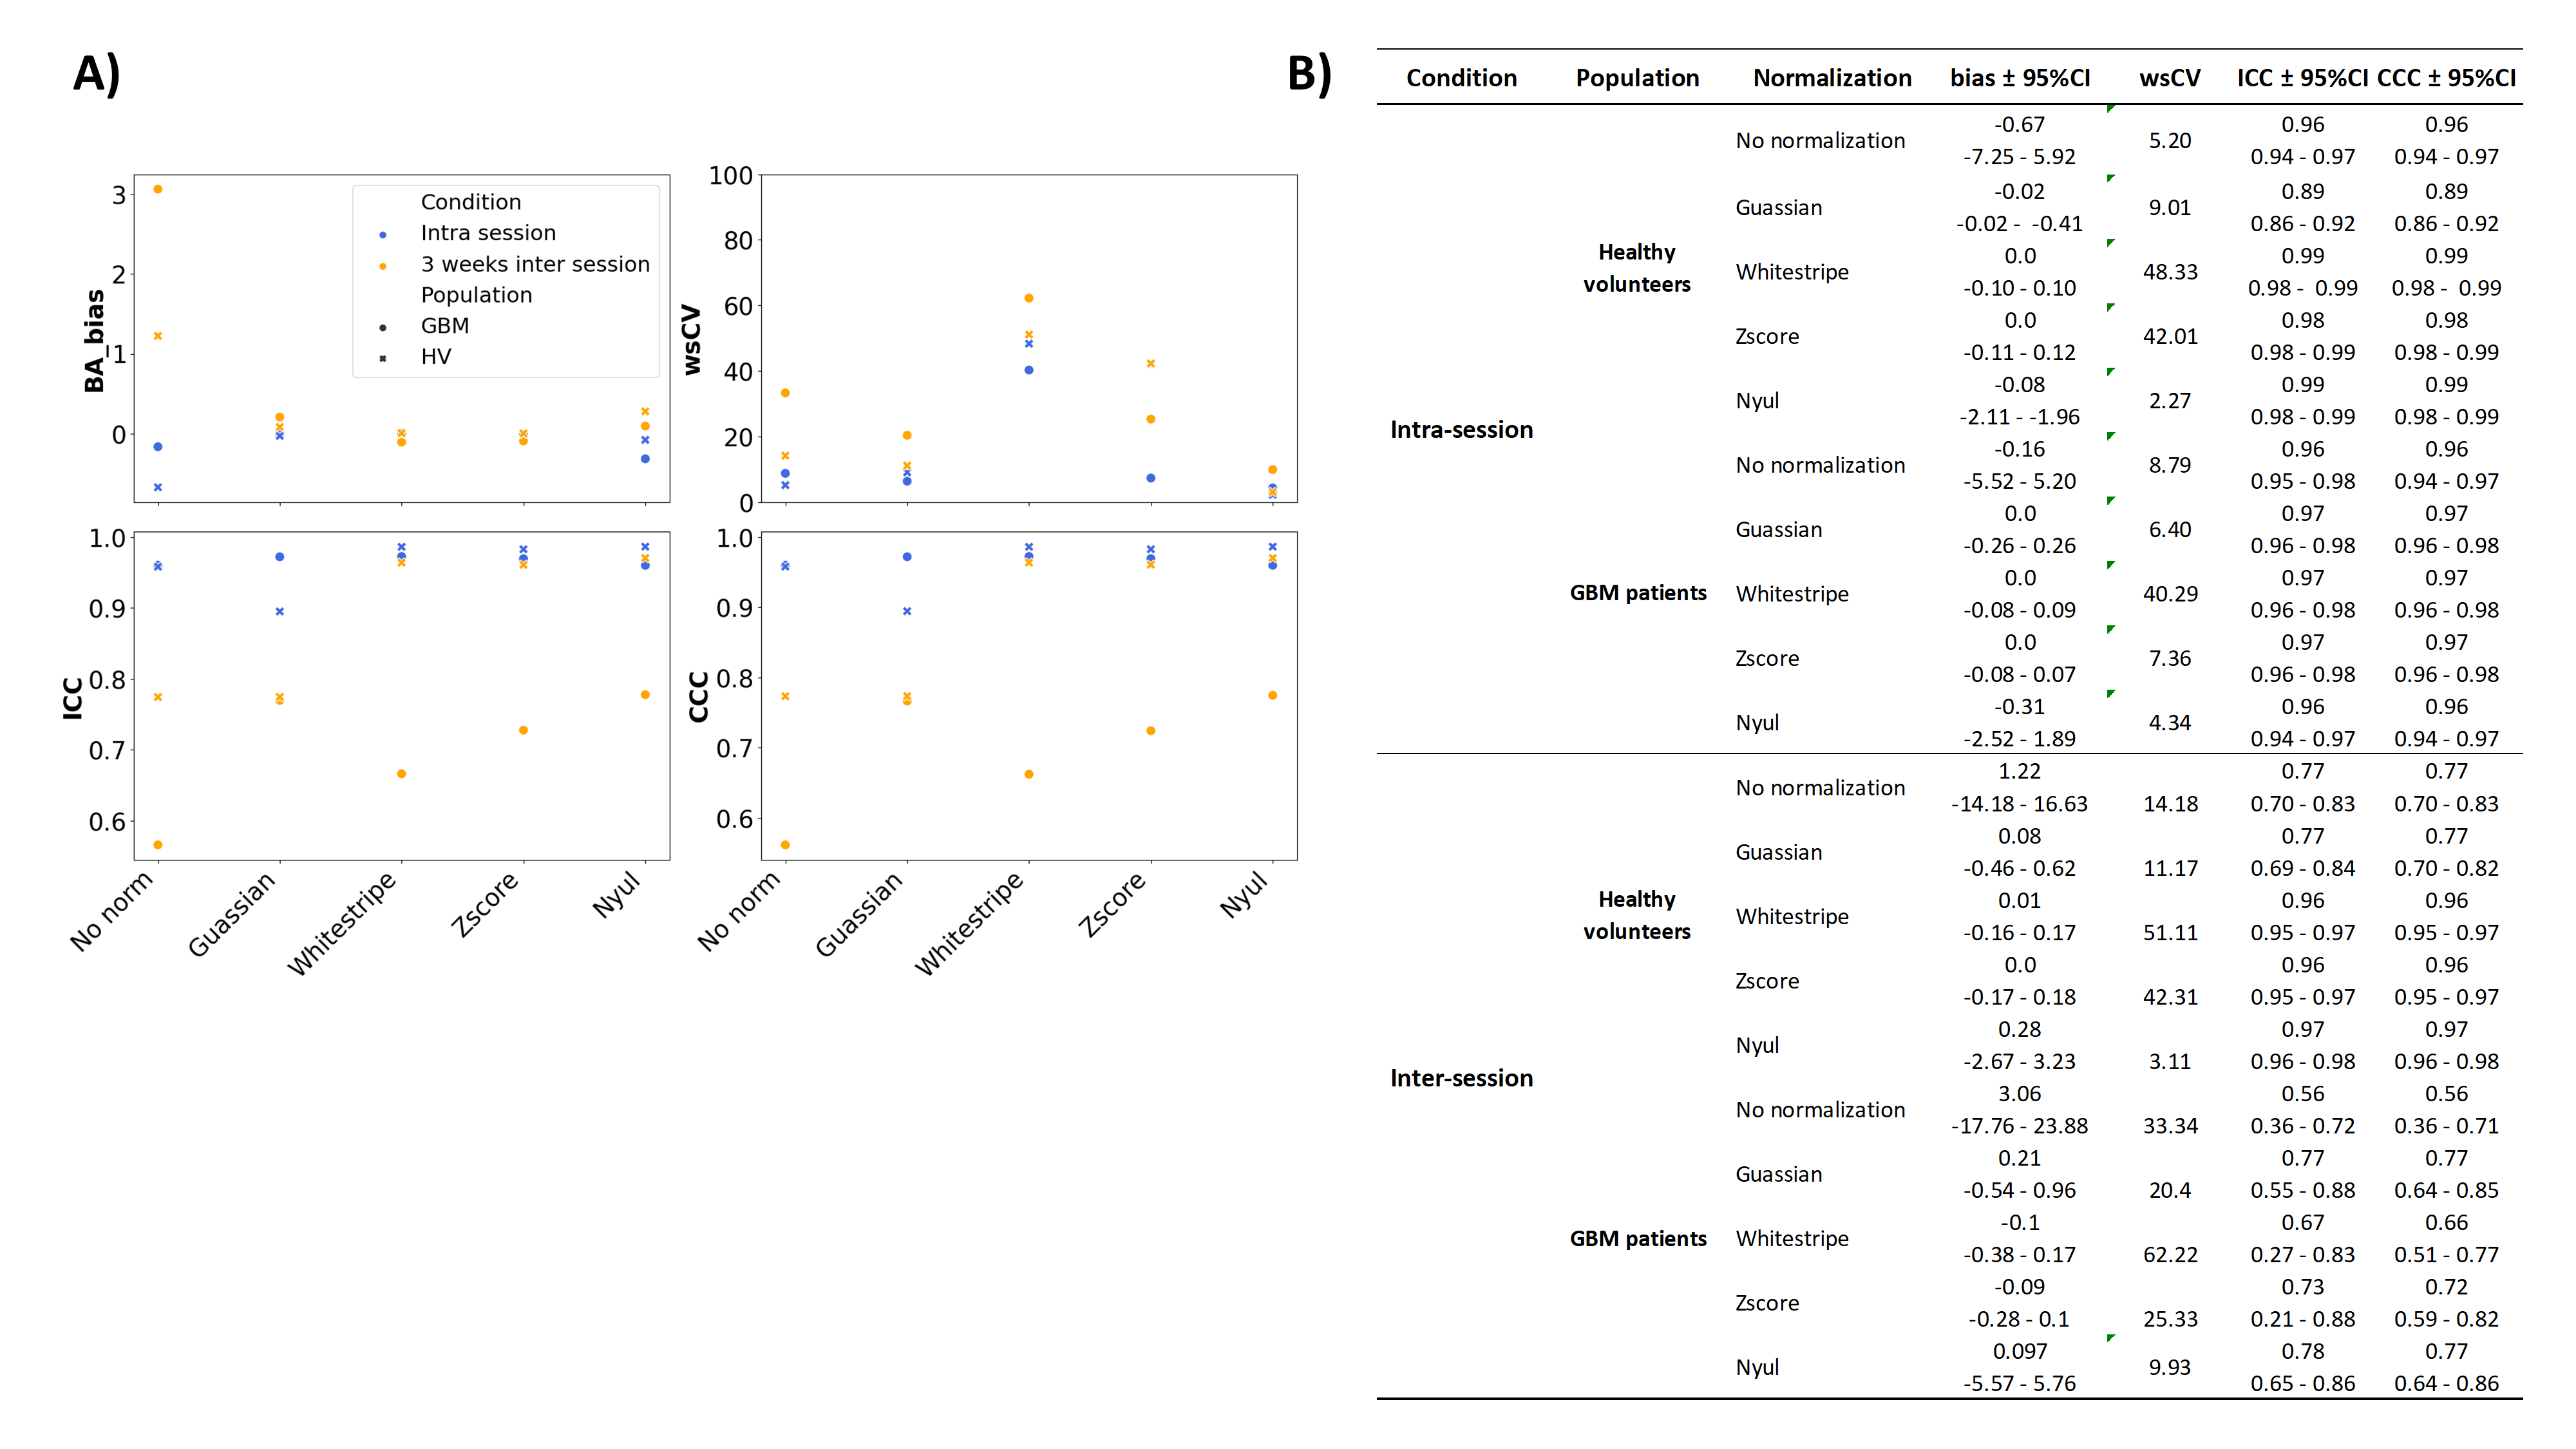
Figure 3: Scatter plot (Figure 3A) of statistical analyses for mean perfusion values within healthy volunteers and patients showed improved reproducibility with a significant increase of ICC/CCC values and decreased wsCV and Bland-Altman (BA) biases, with all detailed results tabulated in Figure 3B. Among all four normalization techniques, Nyul’s method performed the best in terms of reproducibility analyses with additional advantages of retaining physiologically meaningful perfusion values and no need of extra ROIs.
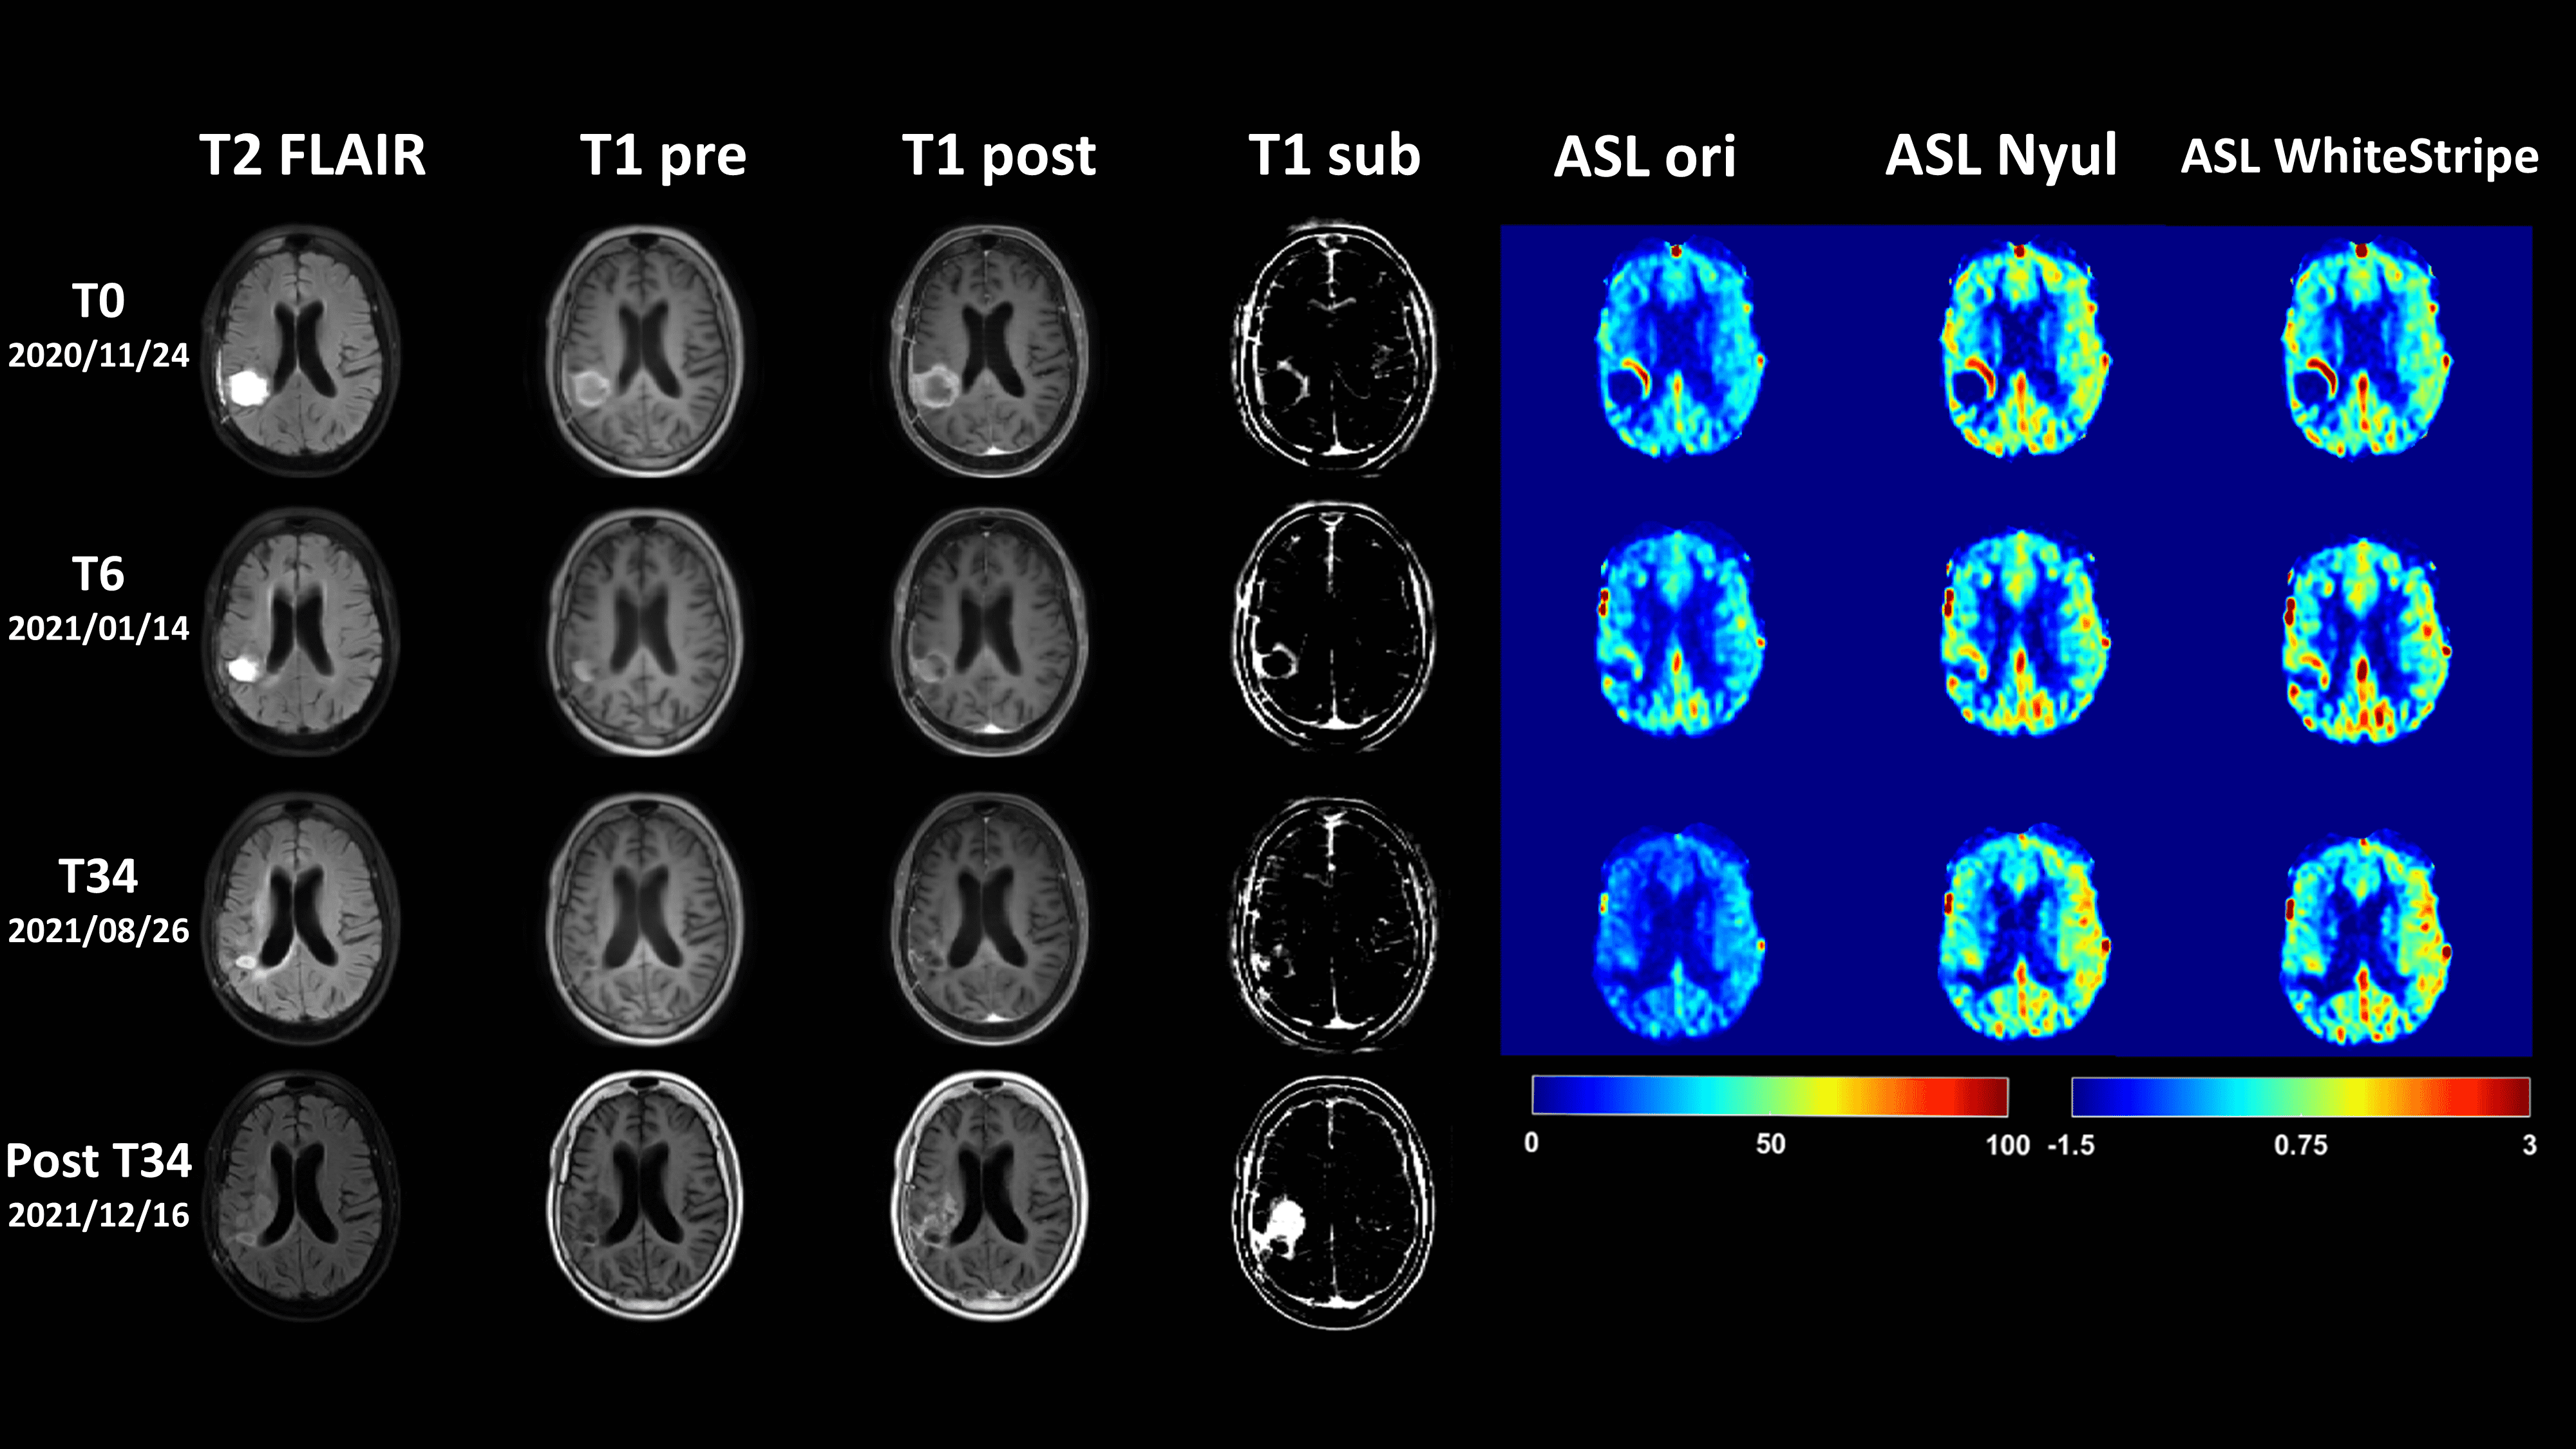
Figure 4: A representative intrapatient comparison of longitudinal imaging with and without ASL normalization. Structural MR images (T2 FLAIR, T1 pre, T1 post, and T1 sub) are shown for reference among different time points, before (T0), during (T6) and after treatment (T34, post T34). The original CBF maps (ASL ori) without normalization and CBF maps with Nyul normalization (ASL Nyul) are displayed with intensity range of 0 to 100 mL/min/100g, while CBF maps with WhiteStripe normalization (ASL WhiteStripe) are displayed with intensity range of -1.5 to 3 (arbitrary unit).
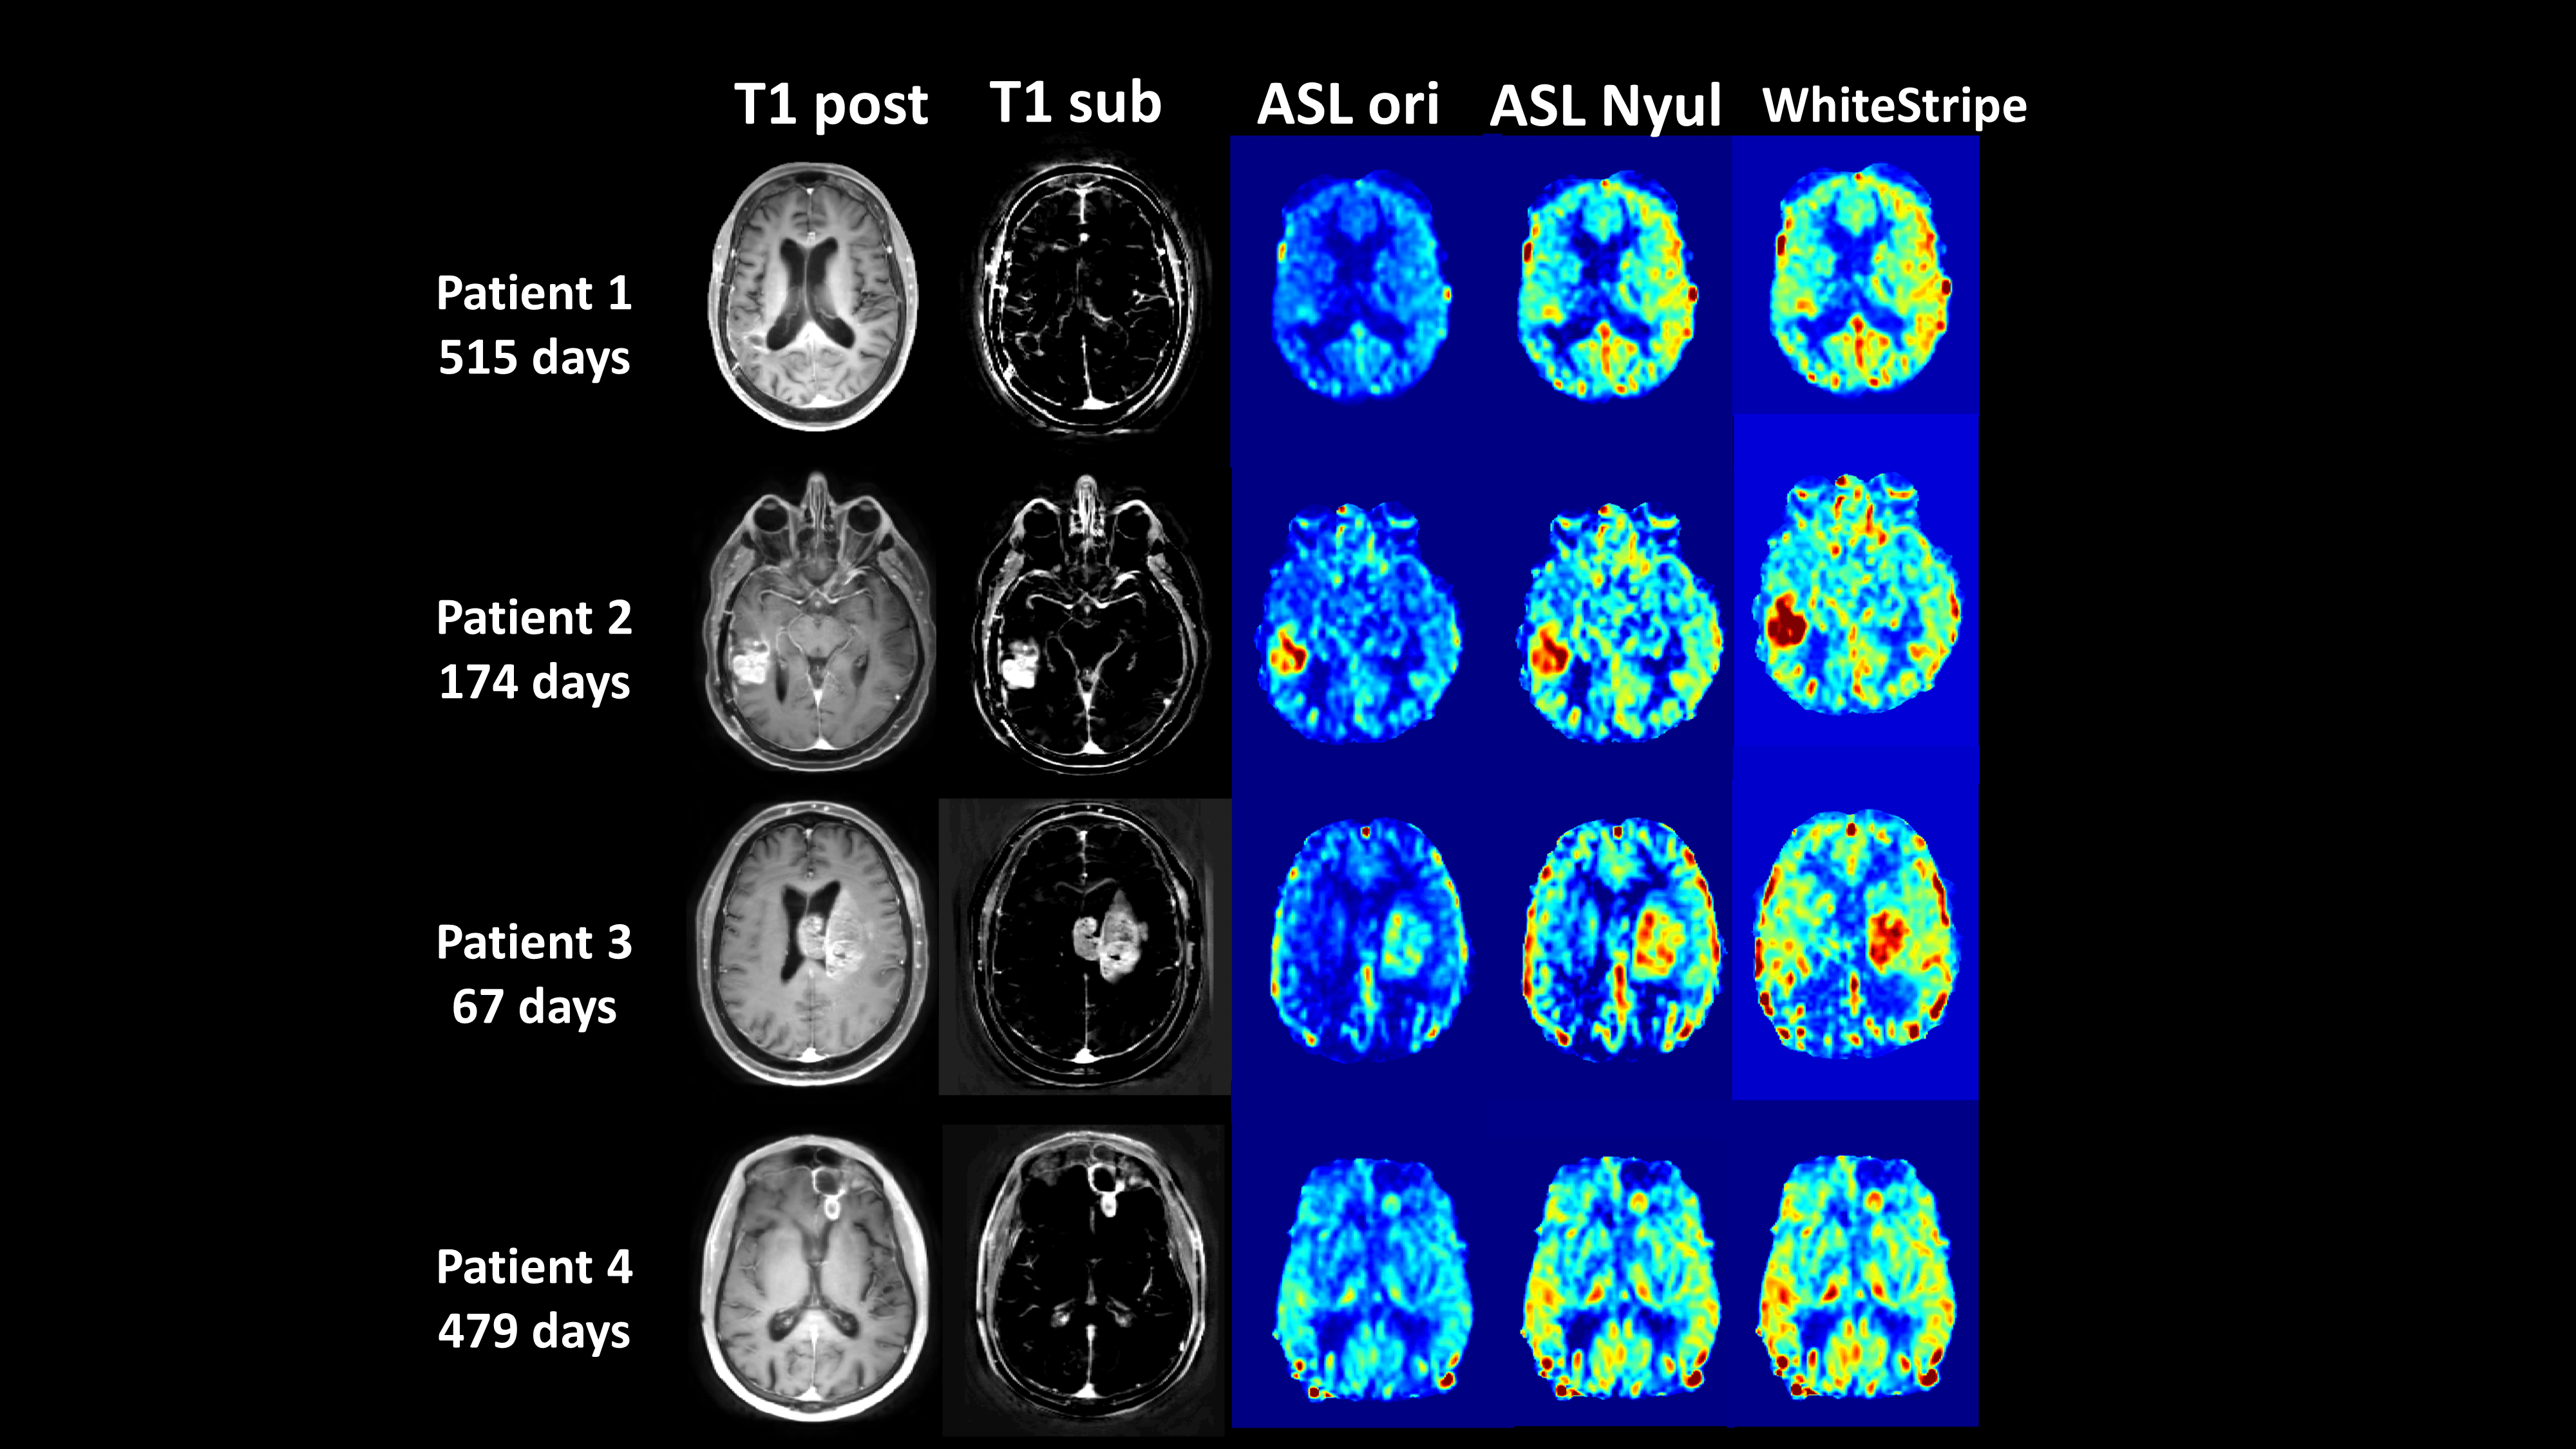
Figure 5: A representative interpatient comparison of ASL measured perfusion with and without normalization. T1 post and T1 subtraction are shown for reference among different patients along with their overall survival in days. The original CBF maps (ASL ori) without normalization and CBF maps with Nyul normalization (ASL Nyul) are displayed with intensity range of 0 to 100 mL/min/100g, while CBF maps with WhiteStripe normalization (WhiteStripe) are displayed with intensity range of -2 to 3 (arbitrary unit).