0399
Integration of Whole Brain Spectroscopic Imaging in Planning Workflow for Personalized Delivery of TTFields in Glioblastomas1Perelman School of Medicine at the University of Pennsylvania, Philadelphia, PA, United States, 2Novocure, Portsmouth, NH, United States, 3University of Miami, Miami, FL, United States, 4St Mary Medical Center, Langhorne, PA, United States, 5Hershey Medical Center, Hershey, PA, United States, 6Lehigh Valley Hospital-Cedar Crest, Allentown, PA, United States, 7Lancaster General Hospital, Lancaster, PA, United States, 8Christiana Care Heath System, Wilmington, DE, United States, 9Crozer-Chester Medical Center, Upland, PA, United States, 10Jefferson Abington Hospital, Abington, PA, United States, 11Perelman School of Medicine at the University of Pennsylvania, Philadelphia, Philadelphia, PA, United States, 12Temple University Lewis Katz School of Medicine, Philadelphia, PA, United States, 13Fox Chase Cancer Center, Philadelphia, PA, United States, 14Singapore General Hospital, Singapore, Singapore, 15Radboud University Medical Centre, Nijmegen, Netherlands
Synopsis
Keywords: Tumors (Post-Treatment), Spectroscopy, glioblastoma; TTFields; WBSI; MRI
Motivation: Optimal treatment for GBM requires precise targeting of all viable tumor cells, many of which are not visible on conventional neuroimaging.
Goal(s): We aimed to utilize WBSI to identify infiltrating tumor cells in GBM patients for selecting a precise target volume for personalized mapping of transducer arrays for enhanced delivery of TTFields.
Approach: A mean value of choline/NAA was computed from normal mask, and all voxels that exceeded two-fold threshold value were included in a 3D-composite mask from the tumor region.
Results: WBSI provided higher yield of voxels with good spectral quality, resulting in improved brain tumor coverage compared to anatomical MRI sequences.
Impact: Alternative array configuration created from WBSI will allow precise delineation of tumor margins for enhanced delivery of TTFields dose to all proliferating regions of a GBM, decreasing the rate of local recurrence and ultimately improving overall survival.
Introduction
Introduction:Glioblastomas (GBMs) are known to infiltrate extensively into adjacent normal brain regions, beyond the contrast enhancing margins where inevitable tumor recurrence occurs.1–3 An optimal treatment for GBM requires precise targeting of all viable tumor cells, many of which are not visible on conventional neuroimaging.4,5 Our aim was to utilize whole brain spectroscopic imaging (WBSI) derived choline/N-acetylaspartate (NAA) maps to identify infiltrating tumor cells in GBMs for selecting a precise target volume (solid contrast-enhancing + infiltrative regions) for personalized mapping of transducer arrays for enhanced delivery of tumor treating fields (TTFields) to the entire ‘viable’ tumor bed.
Methods:
Twenty GBM patients underwent anatomical imaging, and WBSI on a 3T MRI prior to initiation of TTFields. The processing steps for WBSI data involved field inhomogeneity and eddy current correction, k-space regridding, spatial and Fourier transformation.6,7 In each case, quality assurance was evaluated by considering Cramer-Rao lower bounds, line shape, line width, CSF contamination, and degree of residual water and lipid signals. The choline/NAA maps, T2-FLAIR were co-registered to post-contrast (PC)-T1 images. One 3D-composite mask was drawn manually on PC-T1 and T2-FLAIR hyperintense tumor abnormalities and labeled as "anatomical target volume" (ATV) for TTFields delivery using a conventional transducer array layout. Another mask was drawn on contralateral normal-appearing brain parenchyma by selecting a volume comparable to tumor size and at the same slice level and was labeled as ‘normal mask’. A mean value of choline/NAA was computed from normal mask, and all those voxels that exceeded a two-fold threshold value of choline/NAA as measured from normal mask were included into a 3D-composite mask from the tumor region and labeled as “metabolic target volume" (MTV) for TTFields delivery using a modified transducer array layout.8
Results:
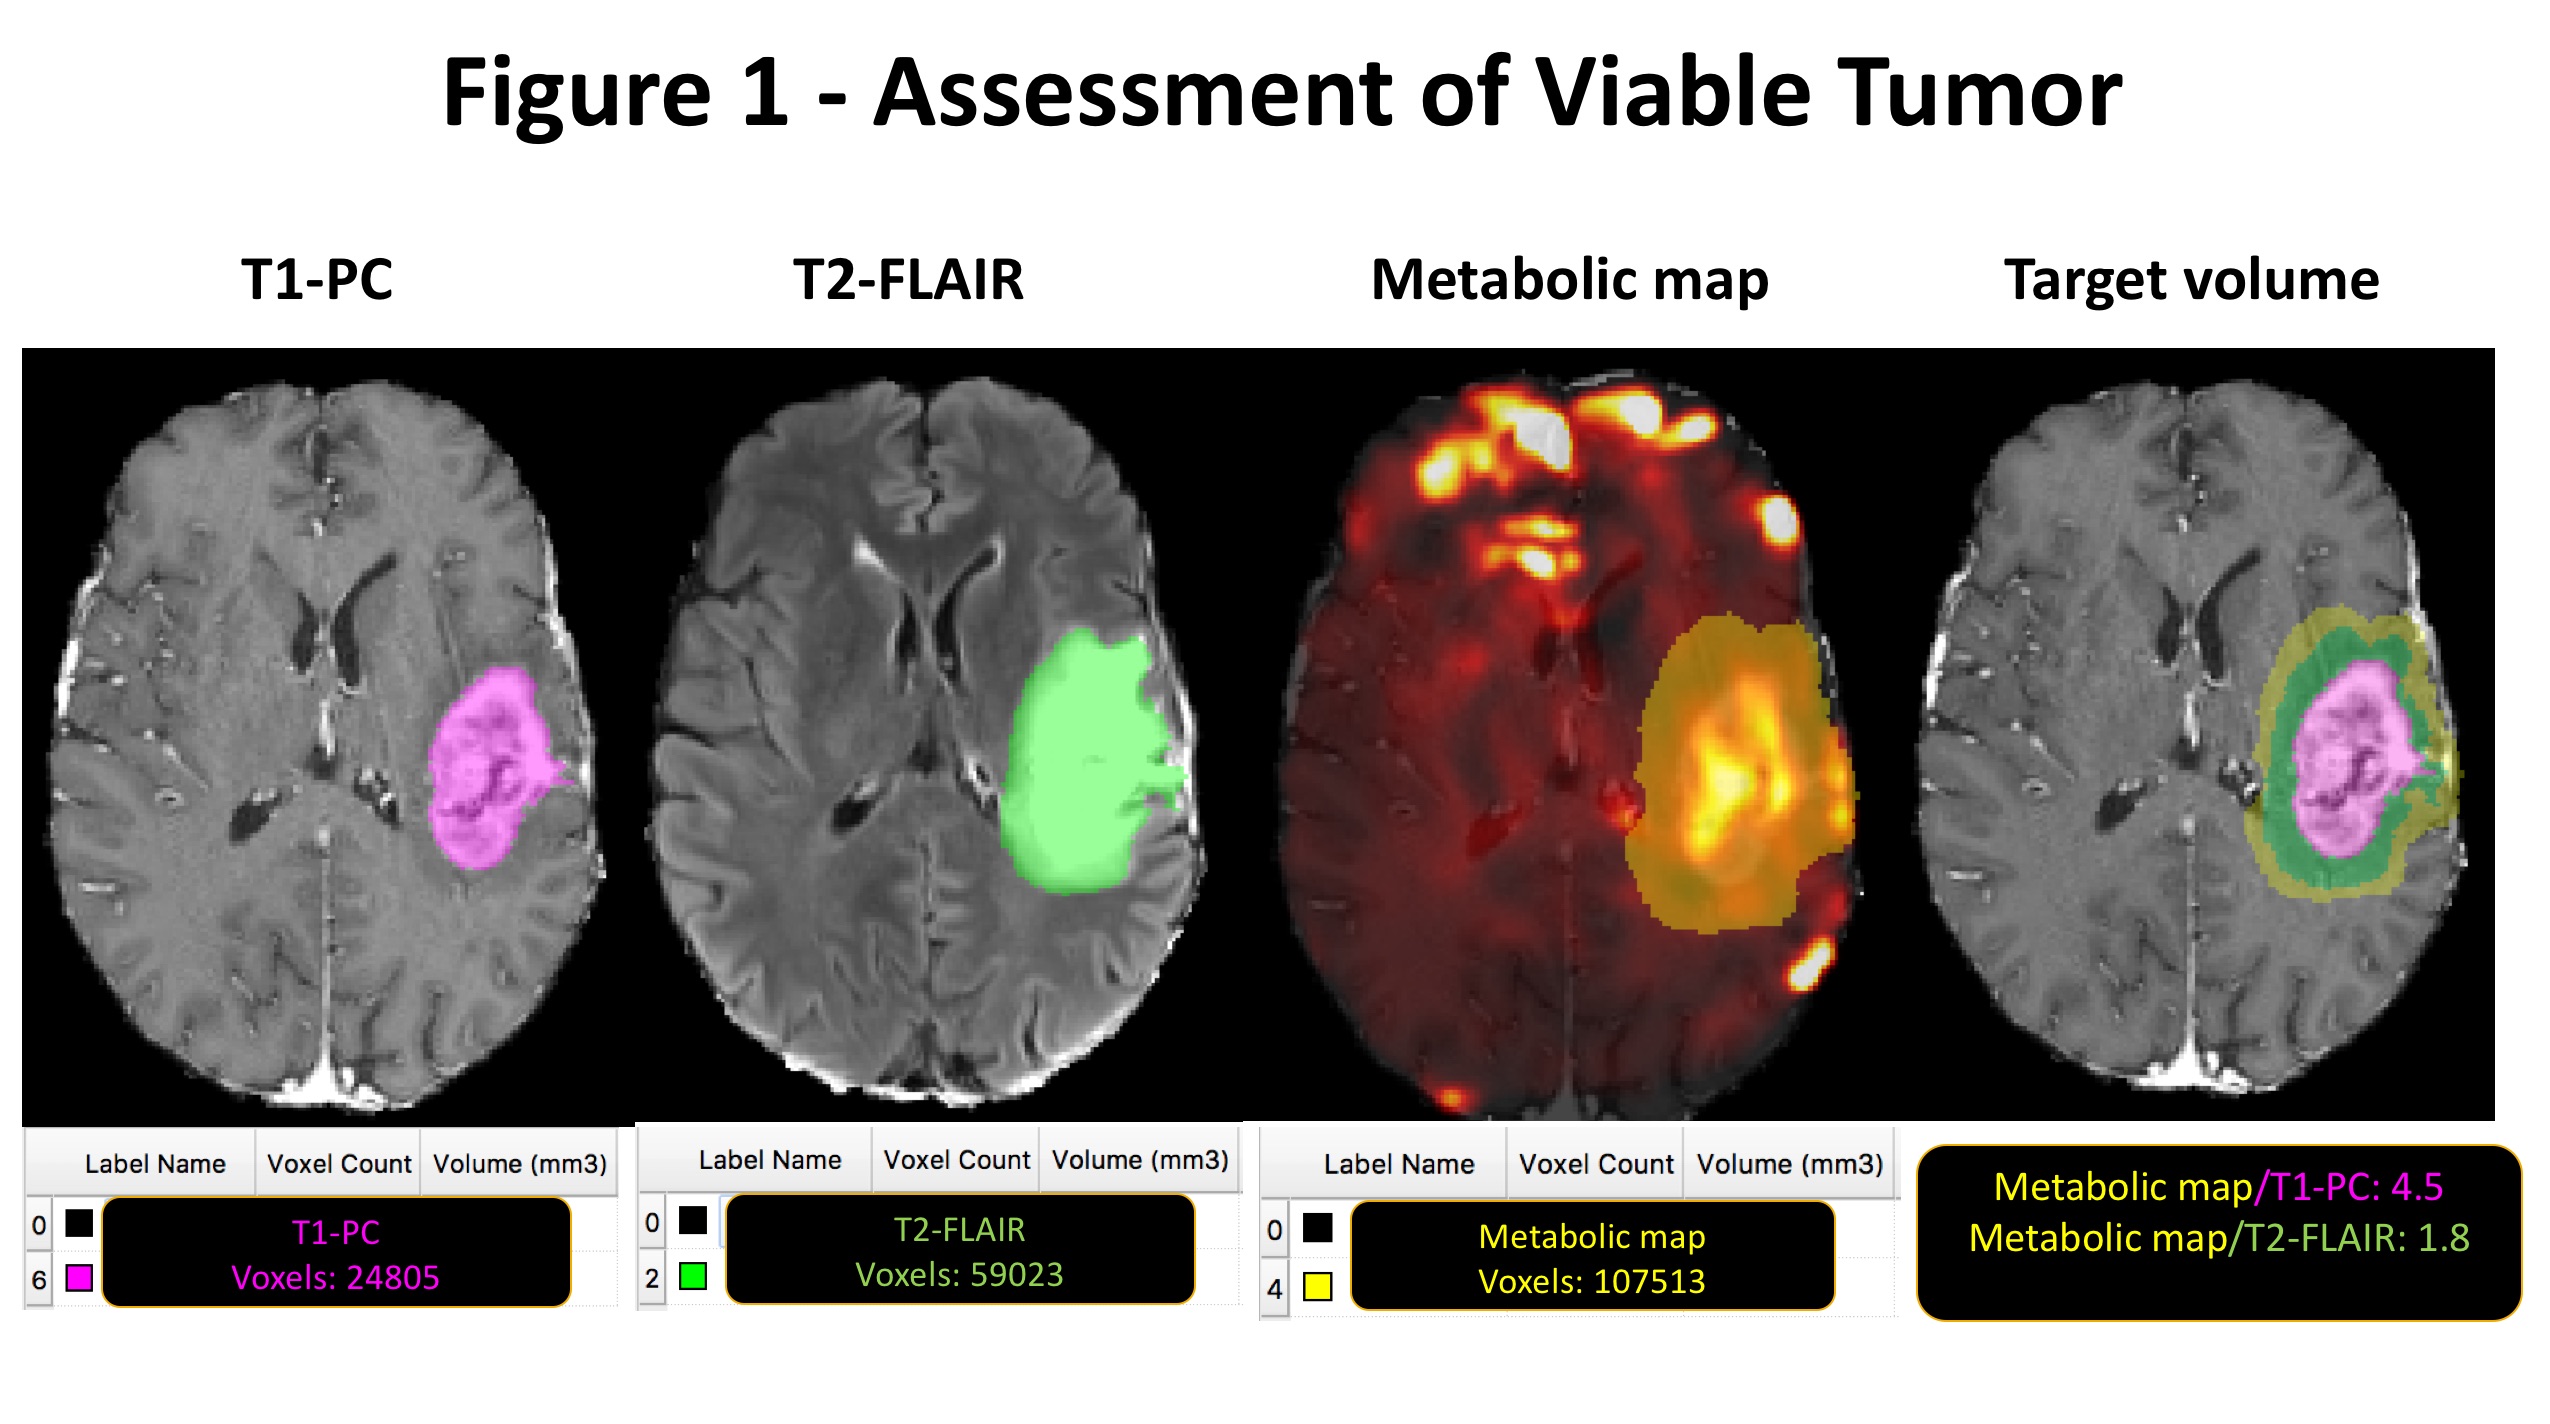
Quality map analyses revealed that good quality metabolite maps were obtained from all patients. Figure 1 shows choline/NAA map and anatomical images from a representative GBM patient. As evident, approximately 1.8 times more viable tumor cells were detected using metabolic maps compared to T2-FLAIR images. Number of voxels (mean ± SD = 43953.1 ±28548.7 vs. 36555.4±28549.2) encompassing MTV on choline/NAA maps were found to be 1 to 3.6 folds higher than those drawn on ATV in these patients.
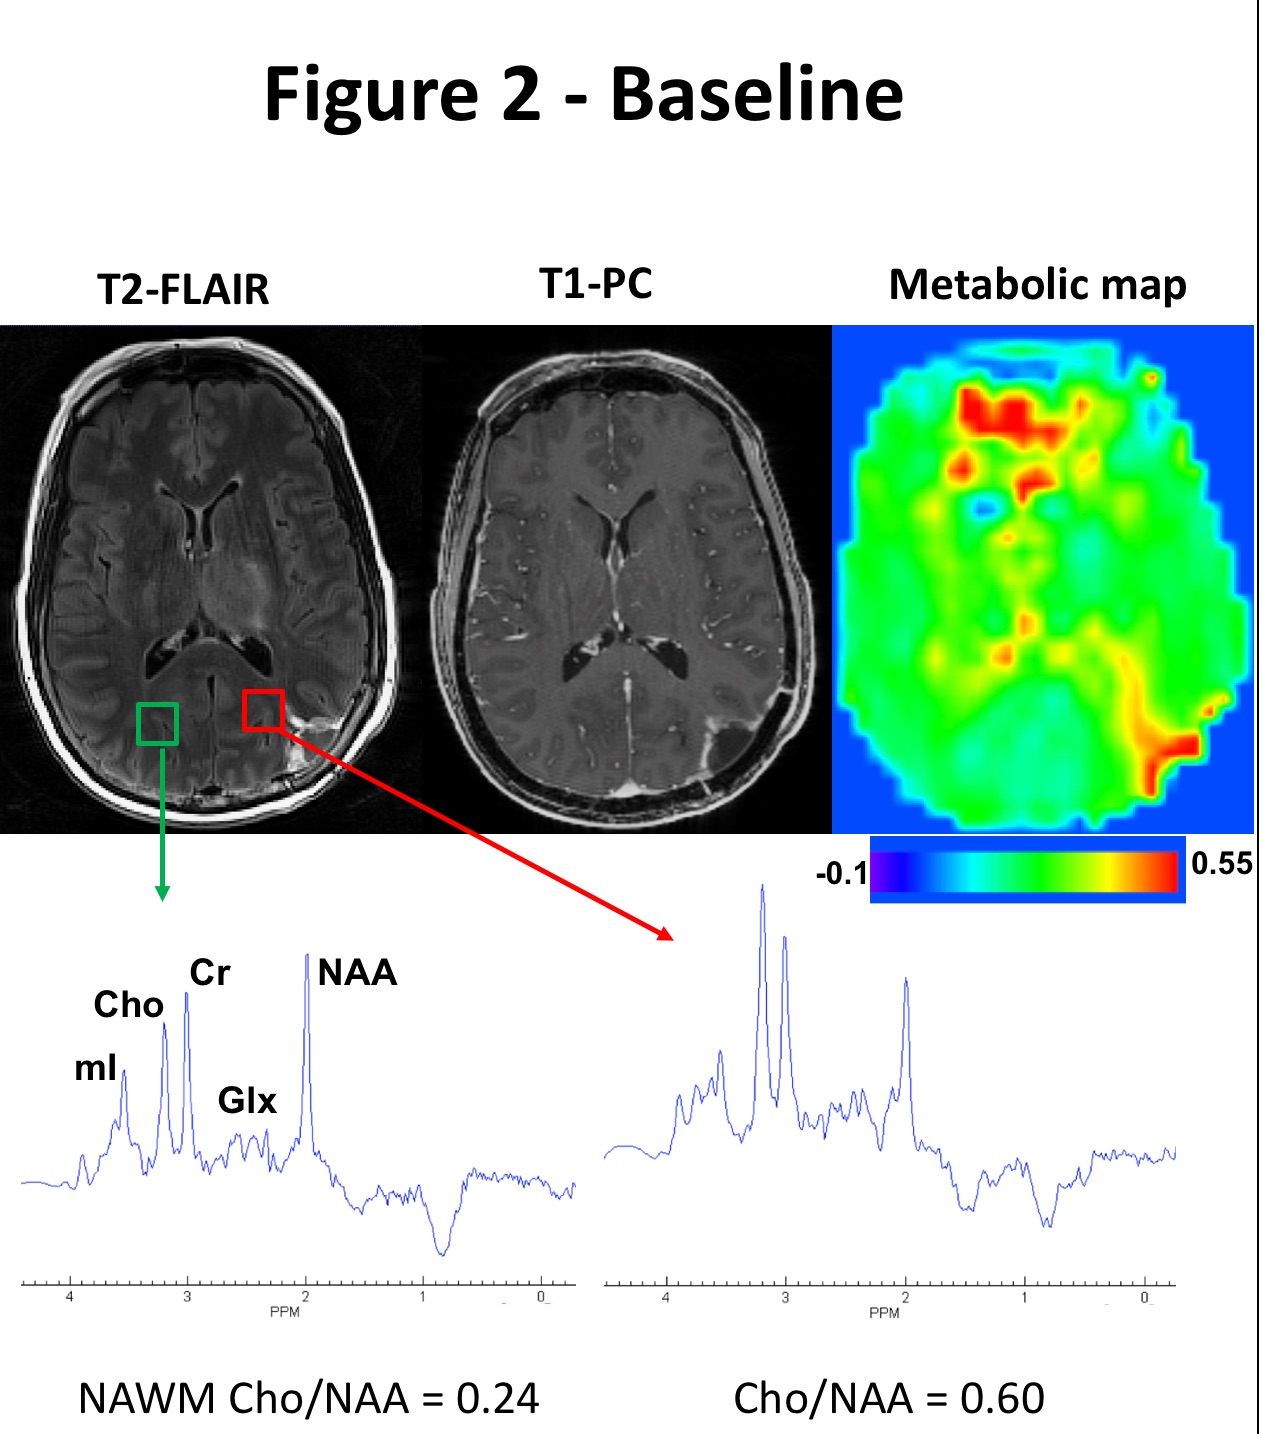
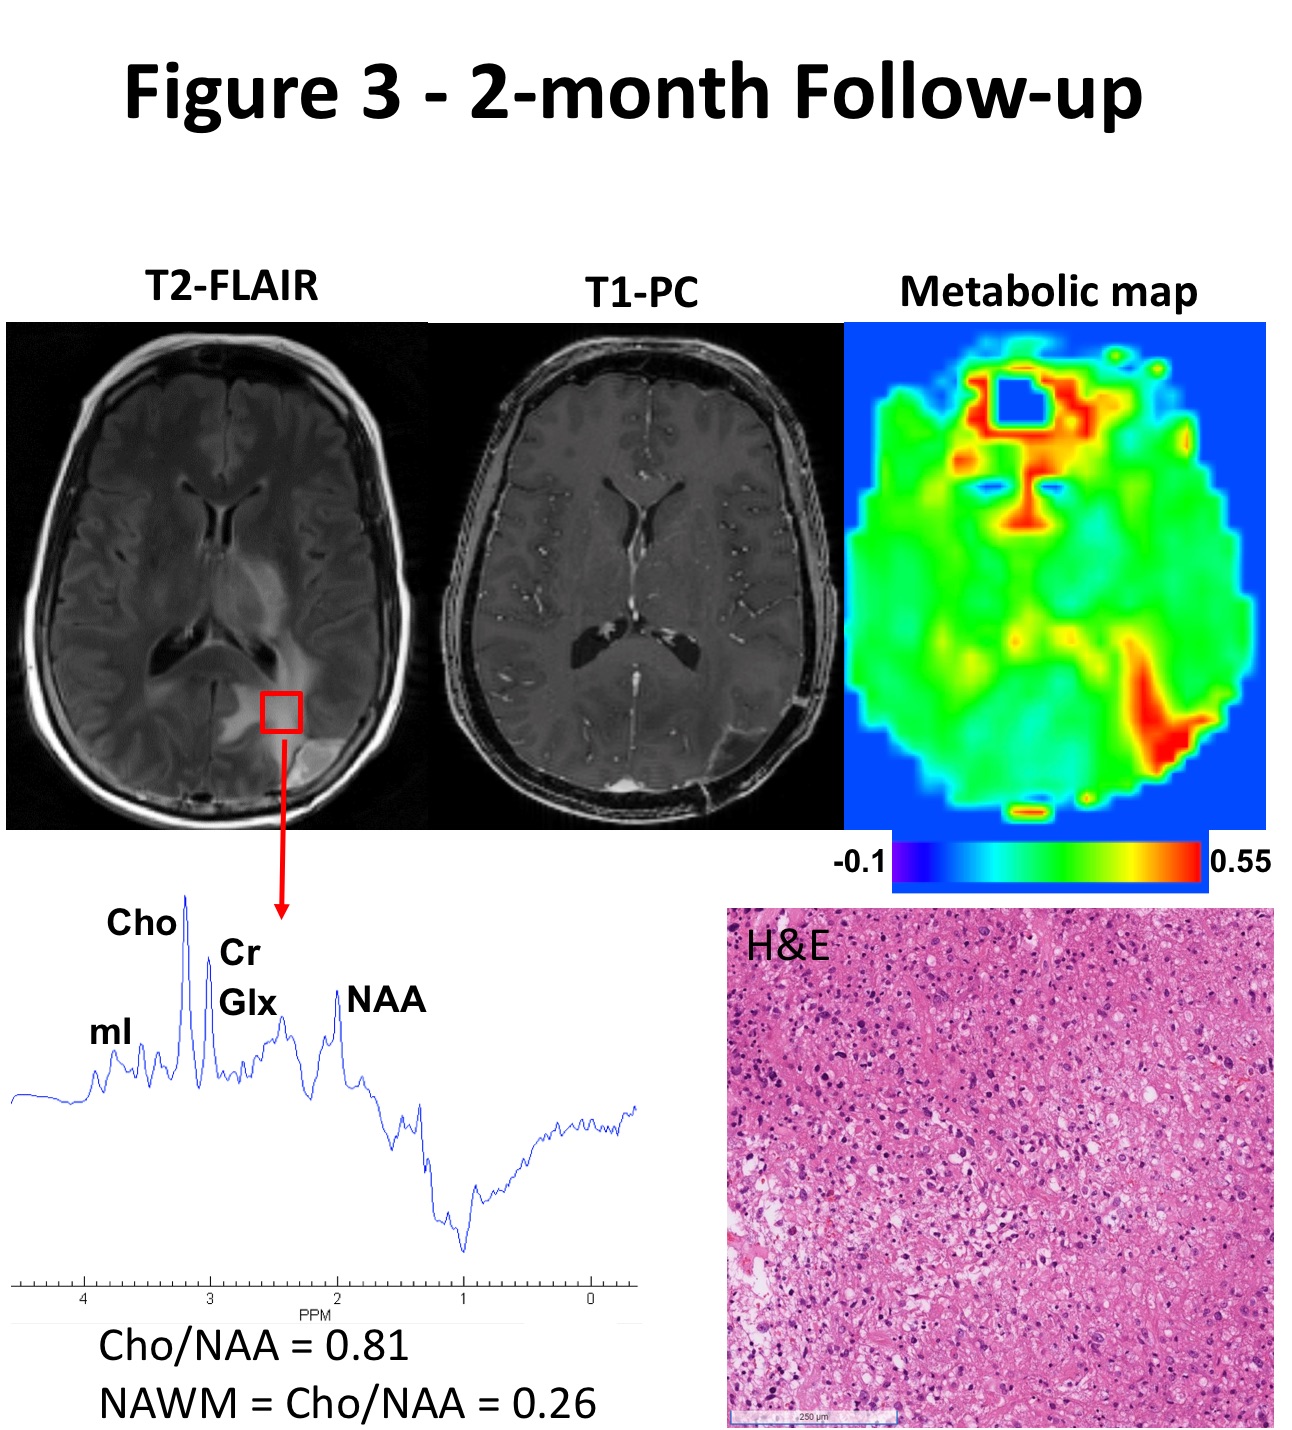
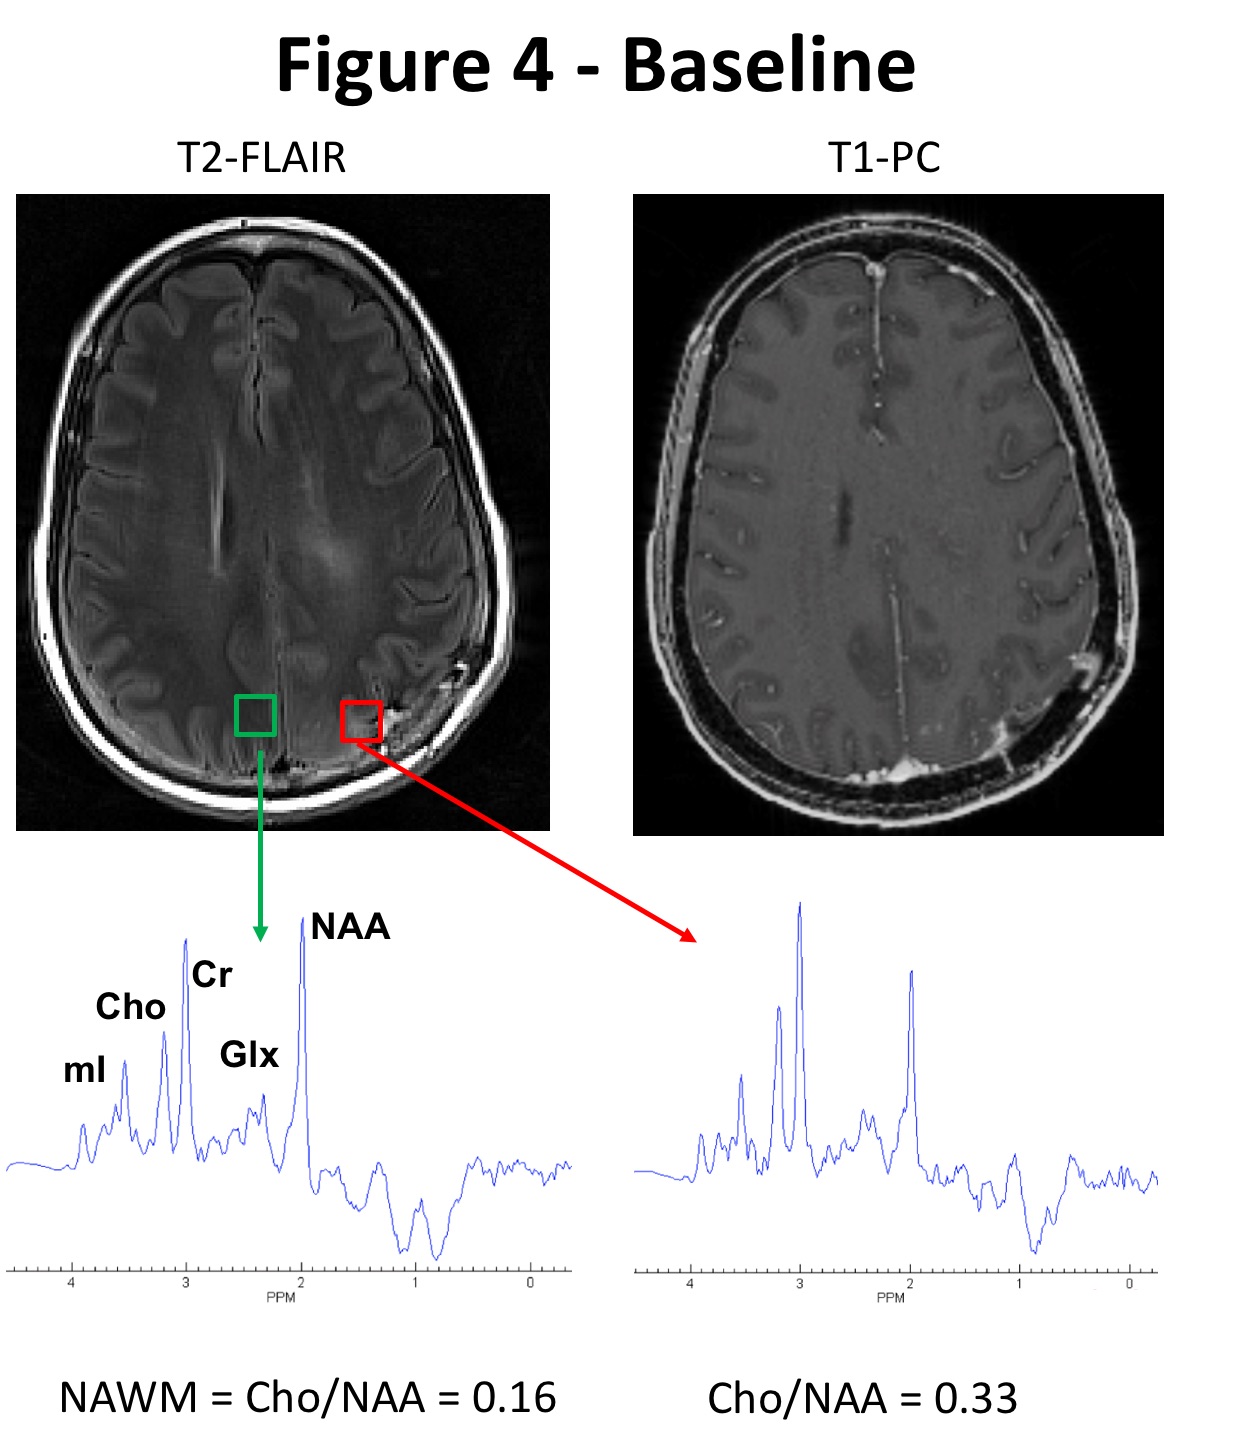
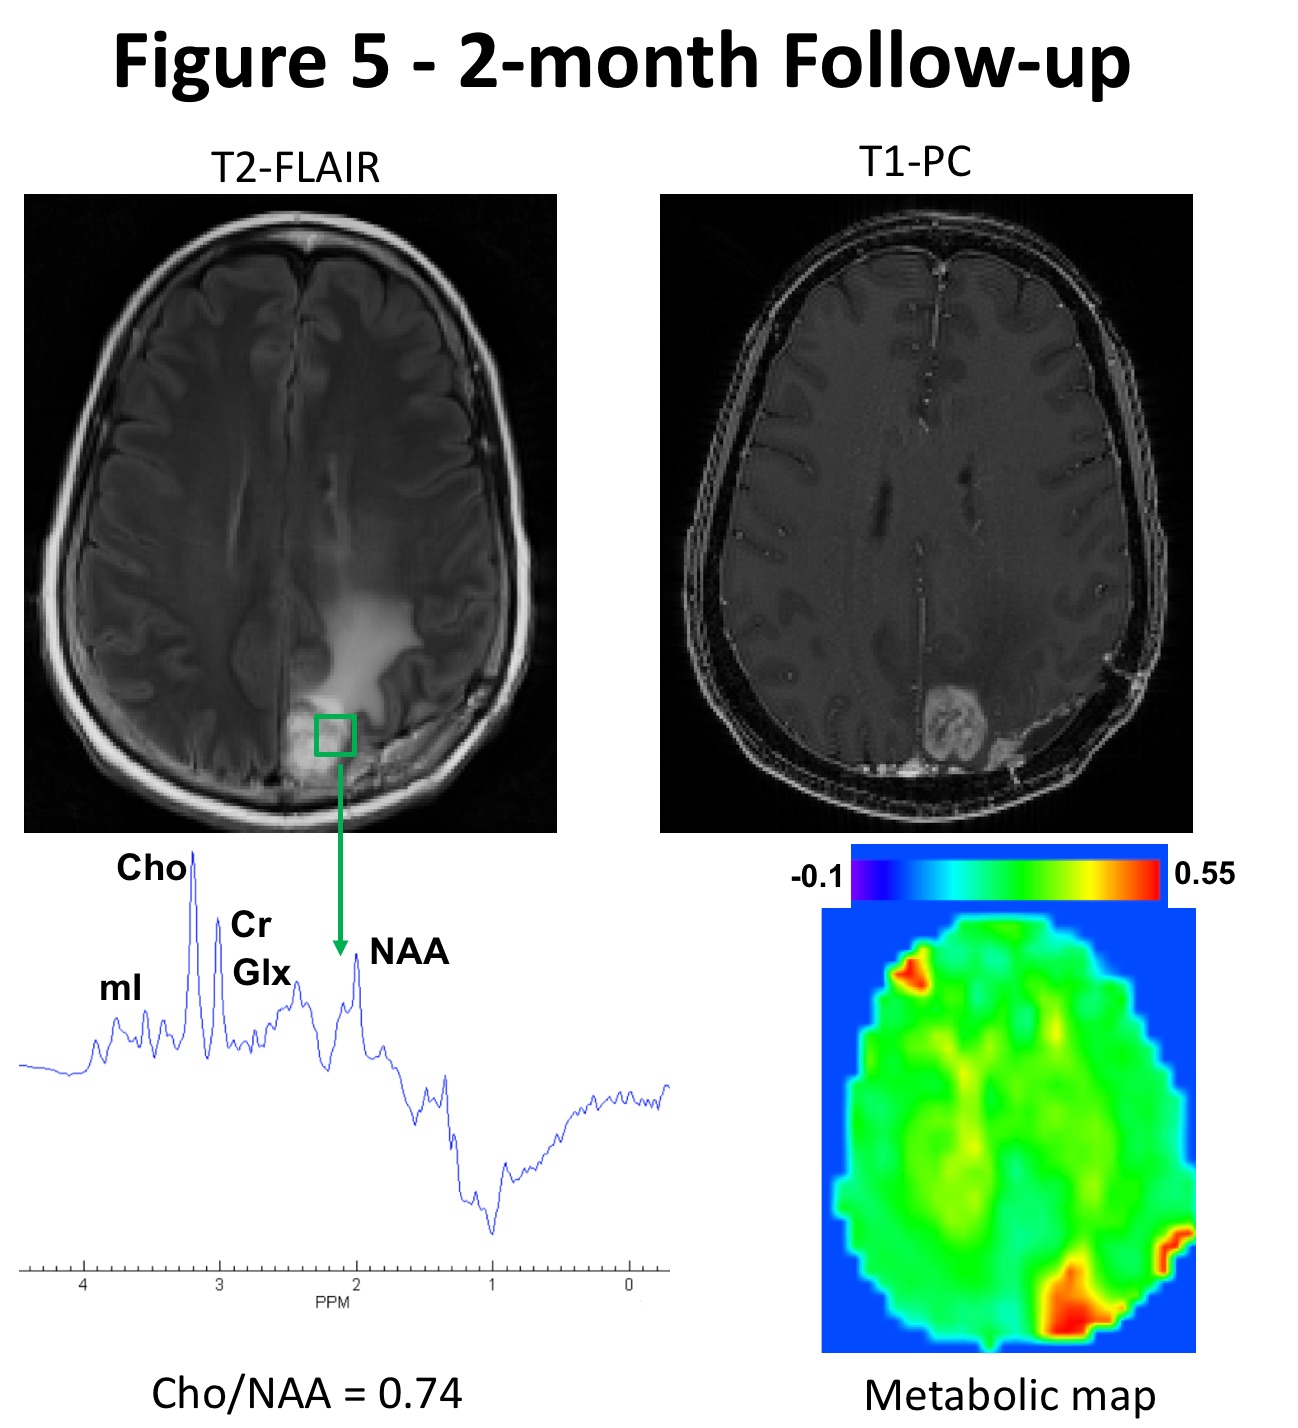
Figure 2 shows a GBM case following standard-of-care treatment. At baseline, a potentially invisible tumor on anatomical imaging along the margins of resection cavity demonstrated elevated choline/NAA ratio compared to contralateral normal-brain regions. At 2-month follow-up (Figure 3), this region demonstrated a new T2-FLAIR signal abnormality, suspicious for tumor progression. Figure 4 shows another region of interest in the left parietal lobule with slight signal abnormality on T2-FLAIR and faint patchy foci of enhancement on PC-T1, demonstrating 2-folds elevation in choline/NAA levels compared to the contralateral region at baseline. At 2-month follow-up (Figure 5), this region presented with suspected tumor progression visible as T2-FLAIR infiltrative hyperintensity and heterogeneous contrast-enhancement on PC-T1. Histopathological findings from the second surgical resection revealed recurrent infiltrating glial tumor cells, confirming tumor progression.
Discussion:
Our results indicate that WBSI derived choline/NAA maps allows improved visualization of infiltrative components of GBMs that are not usually seen on conventional neuroimaging. Using single slice multivoxel proton MR spectroscopic methods, some studies have reported the utility of choline/NAA ratio in identifying target volumes to guide surgical resection, stereotactic radiosurgery, and dose painting for radiation therapy.9–11 However, these studies were constrained by limited spatial coverage of tumors. In contrast, WBSI provides high-resolution metabolite maps covering the entire brain.6,7 In the present study, WBSI derived choline/NAA maps allowed the detection of invisible viable tumor cells beyond the margins of contrast enhancement, which only reflects impairment in the blood-brain barrier. Noteworthy, these infiltrative tumor regions are generally associated with tumor recurrence and treatment failure,12,13 as seen in our patient exemplified in Figures 2-5.
Currently, only radiographically visible, contrast-enhancing regions of GBMs are targeted for TTFields delivery,14 omitting the infiltrative neoplastic components occult on PC-T1 which results in response variability among individual patients treated with TTFields.15,16 Our group recently reported a direct correlation between TTFields dose distribution and tumor response.17 Thus, WBSI may be helpful to integrate into the clinical workflow for precise delineation of tumor margins that will aid in appropriate individualized therapeutic planning, ultimately improving survival outcomes.
Conclusion:
Our preliminary results showed that WBSI derived metabolite maps project a more comprehensive representation of tumor’s true spatial extent and provide more accurate assessment of margins of viable tumor for delivering enhanced dose of TTFields in GBMs.
Acknowledgements
This work was supported by an NIH-R01 grant (1R01CA262584-01).References
1. Chawla, S, et al. Proton magnetic resonance spectroscopy in differentiating glioblastomas from primary cerebral lymphomas and brain metastases. J Comput Assist Tomogr. 34:836-841 (2010).
2. Mohan, S, et al. Detection of occult neoplastic infiltration in the corpus callosum and prediction of overall survival in patients with glioblastoma using diffusion tensor imaging. Eur J Radiol. 112:106-111 (2019).
3. Price, S. J. et al. Diffusion tensor imaging of brain tumours at 3T: a potential tool for assessing white matter tract invasion? Clin. Radiol. 58, 455-462 (2003).
4. Barajas, R. F., Jr et al. Regional variation in histopathologic features of tumor specimens from treatment-naive glioblastoma correlates with anatomic and physiologic MR Imaging. Neuro. Oncol. 14, 942–954 (2012).
5. Wen, P. Y. et al. Updated response assessment criteria for high-grade gliomas: response assessment in neuro-oncology working group. J. Clin. Oncol. 28, 1963–1972 (2010).
6. Verma, G. et al. Three-dimensional echo planar spectroscopic imaging for differentiation of true progression from pseudoprogression in patients with glioblastoma. NMR Biomed. 32, e4042 (2019).
7. Chawla, S. et al. Radiation injury to the normal brain measured by 3D-echo-planar spectroscopic imaging and diffusion tensor imaging: initial experience. J. Neuroimaging 25, 97–104 (2015).
8. Guo, J. et al. The relationship between Cho/NAA and glioma metabolism: implementation for margin delineation of cerebral gliomas. Acta Neurochir. 154, 1361–1370; discussion 1370 (2012).
9. Zhang, J. et al. Metabolic approach for tumor delineation in glioma surgery: 3D MR spectroscopy image-guided resection. J. Neurosurg. 124, 1585–1593 (2016).
10. Einstein, D. B. et al. Phase II trial of radiosurgery to magnetic resonance spectroscopy-defined high-risk tumor volumes in patients with glioblastoma multiforme. Int. J. Radiat. Oncol. Biol. Phys. 84, 668–674 (2012).
11. Ken, S. et al. Integration method of 3D MR spectroscopy into treatment planning system for glioblastoma IMRT dose painting with integrated simultaneous boost. Radiat. Oncol. 8, 1 (2013).
12. Tan, A. C. et al. Management of glioblastoma: State of the art and future directions. CA Cancer J. Clin. 70, 299–312 (2020).
13. Barker, H. E., Paget, J. T. E., Khan, A. A. & Harrington, K. J. The tumour microenvironment after radiotherapy: mechanisms of resistance and recurrence. Nat. Rev. Cancer 15, 409–425 (2015).
14. Mrugala, M. M. et al. Clinical practice experience with NovoTTF-100ATM system for glioblastoma: The Patient Registry Dataset (PRiDe). Semin. Oncol. 41 Suppl 6, S4–S13 (2014).
15. Stupp, R. et al. Maintenance Therapy With Tumor-Treating Fields Plus Temozolomide vs Temozolomide Alone for Glioblastoma: A Randomized Clinical Trial. JAMA 314, 2535–2543 (2015).
16. Stupp, R. et al. NovoTTF-100A versus physician’s choice chemotherapy in recurrent glioblastoma: a randomised phase III trial of a novel treatment modality. Eur. J. Cancer 48, 2192–2202 (2012).
17. Glas, M. et al. The Impact of Tumor Treating Fields on Glioblastoma Progression Patterns. Int. J. Radiat. Oncol. Biol. Phys. 112, 1269–1278 (2022).
Figures