0397
Multiparametric quantitative MRI for assessment of clinical response to M032 oncolytic virotherapy in patients with high-grade glioma1Department of Biomedical Engineering, University of Alabama at Birmingham, Birmingham, AL, United States, 2Department of Neurosurgery, University of Alabama at Birmingham, Birmingham, AL, United States, 3Department of Radiology, University of Alabama at Birmingham, Birmingham, AL, United States, 4O'Neal Comprehensive Cancer Center, University of Alabama at Birmingham, Birmingham, AL, United States
Synopsis
Keywords: Tumors (Post-Treatment), Quantitative Imaging, Multiparametric
Motivation: Standard-of-care MRI in high-grade glioma (HGG) immunotherapy offers limited value for early response assessment and monitoring given its inability to distinguish tumor progression from treatment-induced inflammatory responses.
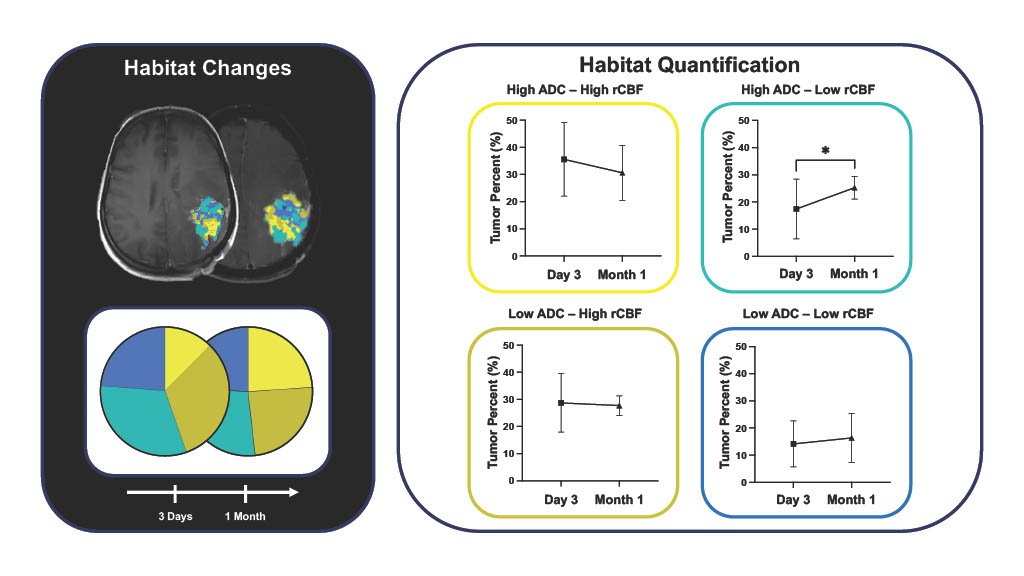
Goal(s): This study aims to evaluate multiparametric MRI and voxel-wise habitat mapping of vascular and cellular properties to assess response to M032 virotherapy in HGG.
Approach: Multiparametric quantitative assessment of cellularity and vascularity, through DWI-MRI and DSC-MRI, was explored for the early evaluation of intratumoral changes post-immunotherapy and associations with overall survival.
Results: Anatomical and quantitative MRI metrics revealed changes early over the course of therapy and showed significant associations with overall survival in this cohort.
Impact: Characterization of multiparametric quantitative MRI metrics associated with early immunotherapy positive response can aid in the assessment and monitoring of therapeutic efficacy and allow for optimization of clinical care in patients with high-grade glioma.
Introduction
Oncolytic herpes simplex virus (oHSV) immunotherapy for the management of high-grade glioma has shown potential for increased survival and improved clinical response1, 2. Trials for these and other immunotherapies have highlighted the limited capabilities of conventional imaging, through anatomical T1+C and T2 MRI, to adequately differentiate tumor progression from treatment-induced inflammatory responses early over the course of therapy3, 4, leading to multiple imaging sessions and an extended time frame for proper therapeutic assessment5, 6. These limitations result in a need for non-invasive quantitative metrics for the early characterization of immunotherapeutic responses in clinical high-grade glioma. Quantitative MRI metrics to inform on vascular and cellular intratumoral properties have been explored in glioblastoma under dendritic cell and checkpoint blockade Immunotherapy, highlighting their potential as prognostic metrics for response7-10. Further, spatiotemporal analysis of multiparametric MRI, through the definition of tumor habitats, has been shown provide diagnostic information associated with response under conventional therapy11. The purpose of this study is to evaluate quantitative MRI approaches and habitat mapping to inform on treatment-induced effects and biological changes of high-grade glioma early over the course of oHSV immunotherapy.Methods
This study evaluates MRI scans acquired as part of a clinical trial of recurrent and progressive malignant glioma patients (n= 21) receiving a single M032 oHSV dose12. Anatomical T1, T1+C, and T2 fluid attenuation inversion recovery (FLAIR), and quantitative diffusion-weighted imaging (DWI) and dynamic susceptibility contrast (DSC) MRI sequences were collected prior to M032 administration with subsequent scans at three days and one-month post-treatment (Philips Ingenia 3.0T, Philips Achieva 1.5T). Acquisition parameters are listed below:| Imaging Sequence | TE/TR (ms) | FA (˚) | Voxel size (mm) | Acquisition matrix | Additional parameters | Generated Maps |
| Axial T1-weighted spin echo (T1 SE) | 10/400-500 | 70-90 | [0.36,0.36,4] – [0.53,0.53,6.5] | 432x432x20 – 560x560x27 | Pre- and post- contrast | Normalized T1 subtraction |
| Axial T2-weighted fluid attenuation inversion recovery with sensitivity encoding (T2 FLAIR SENSE) | 125/11000 | 90 | [0.36,0.36,4] – [0.53,0.53,6.5] | 560x560x27 – 432x432x20 | NA | High resolution anatomical reference |
| Axial diffusion weighted imaging with sensitivity encoding (DWI SENSE) | 86-120/ 3500-4700 | 90 | [0.81,0.81,4] – [1.80,1.80,5] | 128x128x20 – 256x256x30 | b-vals = (0,800,1000) | Apparent Diffusion Coefficient (ADC) |
| Axial single-shot dynamic susceptibility contrast echoplanar imaging (DSC EPI) | 40/1400 | 75 | [1.75,1.75,5] | 128x128x21 | 60x1.4s frames | Relative Cerebral Blood Flow (rCBF) and Volume (rCBV), Mean Transit Time (MTT) |
For segmentation, T1 enhancing region was defined as the area with increased enhancement on T1 subtraction maps, acquired from the normalized subtraction of post- and pre- contrast T1 scans. Regions of enhancement in T2 FLAIR were annotated through a semi-automated region growing method with a manually placed seed within the region of enhancement. ADC maps were generated by computationally fitting voxel signal intensity and b-values collected from DWI-MRI scans13. Quantitative vascular metrics (rCBV, rCBF and MTT) were generated through automated leakage-corrected methods on DSC-MRI scans using the FDA-cleared tool IBNeuro14-16. Tumor habitats were defined on the T1 enhancing region via voxel-wise agglomerative clustering on registered rCBF and ADC maps. These clusters were then classified based on the median distribution for each metric and evaluated for spatial colocalization using a multiregional spatial interaction matrix (MSI) approach17. Statistical evaluation was performed using unpaired T-test and one-way ANOVA for group comparisons, and Cox Proportional Hazards Model for survival analysis, with p<0.05 considered significant.
Results
Anatomical assessment through volumetric MRI measurement revealed significant increases in the T1+C enhancing region one month following M032 immunotherapy (p< 0.001) relative to baseline and significant associations with overall survival were seen with increased difference in T1+C longest dimensions at one month (HR> 1.0, p< 0.05) , and baseline enhancing T2 FLAIR volume (HR< 1.0, p< 0.05). Further, quantitative MRI analysis showed increased vascular transit time one month following immunotherapy and associations with survival were seen with increased maximum blood flow three days post treatment (HR> 1.0, p< 0.05). Multiparametric analysis of MRI-derived quantitative maps allowed for the identification of spatially colocalized biologically distinct habitats, as confirmed by MSI analysis (p< 0.0001) and mean ADC and rCBF comparisons across intratumoral habitats (p<0.0001). Early evaluation of intratumoral habitats revealed significant increases in the hypo-vascular hypo-cellular habitat one month following M032 relative to day 3 (p< 0.05).Conclusions
Non-invasive imaging characterization of the tumor microenvironment can provide quantitative metrics for the early identification, monitoring, and promotion of immunotherapeutic responses in clinical high-grade glioma. Multiparametric quantitative MRI analysis of cellularity and vascularity can further inform on biologically distinct spatially colocalized intratumoral habitats which can aid in the identification and monitoring of non-responsive and responsive intratumoral regions to optimize clinical care in patients with high-grade gliomas.Acknowledgements
No acknowledgement found.References
1. Markert JM, Razdan SN, Kuo HC, Cantor A, Knoll A, Karrasch M, Nabors LB, Markiewicz M, Agee BS, Coleman JM, Lakeman AD, Palmer CA, Parker JN, Whitley RJ, Weichselbaum RR, Fiveash JB, Gillespie GY. A phase 1 trial of oncolytic HSV-1, G207, given in combination with radiation for recurrent GBM demonstrates safety and radiographic responses. Mol Ther. 2014;22(5):1048-55. Epub 20140227. doi: 10.1038/mt.2014.22. PubMed PMID: 24572293; PMCID: PMC4015243.
2. Todo T, Ito H, Ino Y, Ohtsu H, Ota Y, Shibahara J, Tanaka M. Intratumoral oncolytic herpes virus G47∆ for residual or recurrent glioblastoma: a phase 2 trial. Nat Med. 2022;28(8):1630-9. Epub 20220721. doi: 10.1038/s41591-022-01897-x. PubMed PMID: 35864254; PMCID: PMC9388376.
3. Okada H, Kalinski P, Ueda R, Hoji A, Kohanbash G, Donegan TE, Mintz AH, Engh JA, Bartlett DL, Brown CK, Zeh H, Holtzman MP, Reinhart TA, Whiteside TL, Butterfield LH, Hamilton RL, Potter DM, Pollack IF, Salazar AM, Lieberman FS. Induction of CD8+ T-cell responses against novel glioma-associated antigen peptides and clinical activity by vaccinations with alpha-type 1 polarized dendritic cells and polyinosinic-polycytidylic acid stabilized by lysine and carboxymethylcellulose in patients with recurrent malignant glioma. J Clin Oncol. 2011;29(3):330-6. Epub 20101213. doi: 10.1200/JCO.2010.30.7744. PubMed PMID: 21149657; PMCID: PMC3056467.
4. Kasten BB, Udayakumar N, Leavenworth JW, Wu AM, Lapi SE, McConathy JE, Sorace AG, Bag AK, Markert JM, Warram JM. Current and Future Imaging Methods for Evaluating Response to Immunotherapy in Neuro-Oncology. Theranostics. 2019;9(17):5085-104. Epub 20190709. doi: 10.7150/thno.34415. PubMed PMID: 31410203; PMCID: PMC6691392.
5. Ellingson BM, Chung C, Pope WB, Boxerman JL, Kaufmann TJ. Pseudoprogression, radionecrosis, inflammation or true tumor progression? challenges associated with glioblastoma response assessment in an evolving therapeutic landscape. J Neurooncol. 2017;134(3):495-504. Epub 20170405. doi: 10.1007/s11060-017-2375-2. PubMed PMID: 28382534; PMCID: PMC7893814.
6. Okada H, Weller M, Huang R, Finocchiaro G, Gilbert MR, Wick W, Ellingson BM, Hashimoto N, Pollack IF, Brandes AA, Franceschi E, Herold-Mende C, Nayak L, Panigrahy A, Pope WB, Prins R, Sampson JH, Wen PY, Reardon DA. Immunotherapy response assessment in neuro-oncology: a report of the RANO working group. Lancet Oncol. 2015;16(15):e534-e42. doi: 10.1016/S1470-2045(15)00088-1. PubMed PMID: 26545842; PMCID: PMC4638131.
7. Cuccarini V, Aquino D, Gioppo A, Anghileri E, Pellegatta S, Schettino C, Mazzi F, Finocchiaro G, Bruzzone MG, Eoli M. Advanced MRI Assessment during Dendritic Cell Immunotherapy Added to Standard Treatment Against Glioblastoma. J Clin Med. 2019;8(11). Epub 20191117. doi: 10.3390/jcm8112007. PubMed PMID: 31744235; PMCID: PMC6912338.
8. Vrabec M, Van Cauter S, Himmelreich U, Van Gool SW, Sunaert S, De Vleeschouwer S, Suput D, Demaerel P. MR perfusion and diffusion imaging in the follow-up of recurrent glioblastoma treated with dendritic cell immunotherapy: a pilot study. Neuroradiology. 2011;53(10):721-31. Epub 20101125. doi: 10.1007/s00234-010-0802-6. PubMed PMID: 21107549.
9. Song J, Kadaba P, Kravitz A, Hormigo A, Friedman J, Belani P, Hadjipanayis C, Ellingson BM, Nael K. Multiparametric MRI for early identification of therapeutic response in recurrent glioblastoma treated with immune checkpoint inhibitors. Neuro Oncol. 2020;22(11):1658-66. doi: 10.1093/neuonc/noaa066. PubMed PMID: 32193547; PMCID: PMC7846197.
10. Qin L, Li X, Stroiney A, Qu J, Helgager J, Reardon DA, Young GS. Advanced MRI assessment to predict benefit of anti-programmed cell death 1 protein immunotherapy response in patients with recurrent glioblastoma. Neuroradiology. 2017;59(2):135-45. Epub 20170109. doi: 10.1007/s00234-016-1769-8. PubMed PMID: 28070598; PMCID: PMC6097616.
11. Kim M, Park JE, Kim HS, Kim N, Park SY, Kim YH, Kim JH. Spatiotemporal habitats from multiparametric physiologic MRI distinguish tumor progression from treatment-related change in post-treatment glioblastoma. Eur Radiol. 2021;31(8):6374-83. Epub 20210210. doi: 10.1007/s00330-021-07718-y. PubMed PMID: 33569615.
12. Patel DM, Foreman PM, Nabors LB, Riley KO, Gillespie GY, Markert JM. Design of a Phase I Clinical Trial to Evaluate M032, a Genetically Engineered HSV-1 Expressing IL-12, in Patients with Recurrent/Progressive Glioblastoma Multiforme, Anaplastic Astrocytoma, or Gliosarcoma. Hum Gene Ther Clin Dev. 2016;27(2):69-78. doi: 10.1089/humc.2016.031. PubMed PMID: 27314913; PMCID: PMC4932657.
13. Higaki T, Nakamura Y, Tatsugami F, Kaichi Y, Akagi M, Akiyama Y, Baba Y, Iida M, Awai K. Introduction to the Technical Aspects of Computed Diffusion-weighted Imaging for Radiologists. Radiographics. 2018;38(4):1131-44. doi: 10.1148/rg.2018170115. PubMed PMID: 29995614.
14. Kuo F, Ng NN, Nagpal S, Pollom EL, Soltys S, Hayden-Gephart M, Li G, Born DE, Iv M. DSC Perfusion MRI-Derived Fractional Tumor Burden and Relative CBV Differentiate Tumor Progression and Radiation Necrosis in Brain Metastases Treated with Stereotactic Radiosurgery. AJNR Am J Neuroradiol. 2022;43(5):689-95. Epub 20220428. doi: 10.3174/ajnr.A7501. PubMed PMID: 35483909; PMCID: PMC9089266.
15. Bedekar D, Jensen T, Schmainda KM. Standardization of relative cerebral blood volume (rCBV) image maps for ease of both inter- and intrapatient comparisons. Magn Reson Med. 2010;64(3):907-13. doi: 10.1002/mrm.22445. PubMed PMID: 20806381; PMCID: PMC4323176.
16. Boxerman JL, Ellingson BM, Jeyapalan S, Elinzano H, Harris RJ, Rogg JM, Pope WB, Safran H. Longitudinal DSC-MRI for Distinguishing Tumor Recurrence From Pseudoprogression in Patients With a High-grade Glioma. Am J Clin Oncol. 2017;40(3):228-34. doi: 10.1097/COC.0000000000000156. PubMed PMID: 25436828.
17. Syed AK, Whisenant JG, Barnes SL, Sorace AG, Yankeelov TE. Multiparametric Analysis of Longitudinal Quantitative MRI data to Identify Distinct Tumor Habitats in Preclinical Models of Breast Cancer. Cancers (Basel). 2020;12(6). Epub 20200624. doi: 10.3390/cancers12061682. PubMed PMID: 32599906; PMCID: PMC7352623.
Figures
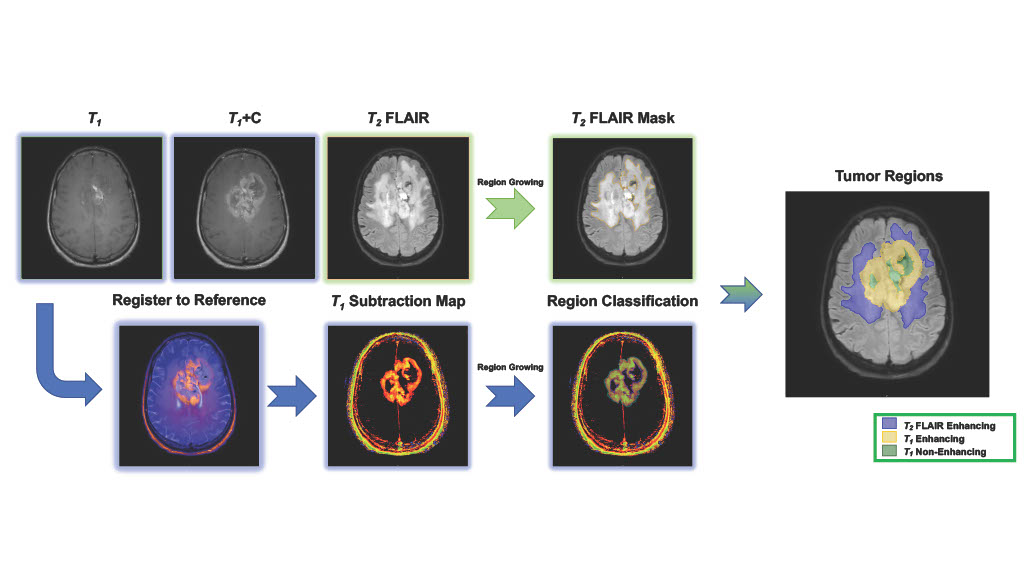
Figure 1. Workflow for the semi-automated definition of tumor regions using a T1 normalized subtraction map and region growing approaches.
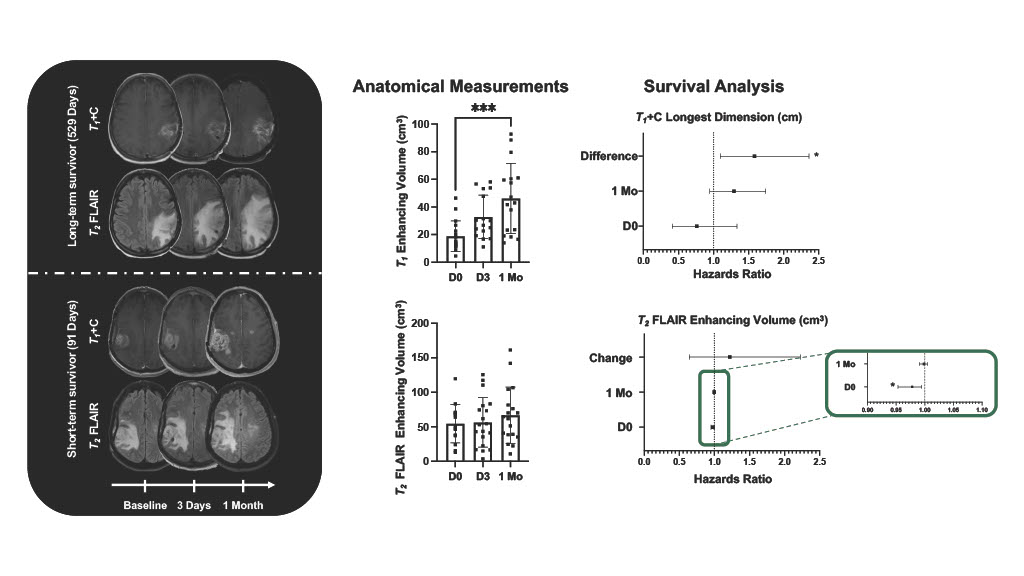
Figure 2. Representative anatomical T1+C and T2 FLAIR images early over the course of therapy. Anatomical measurements demonstrated early increases in T1 enhancing region (p< 0.001). Associations with overall survival were seen with difference in T1 enhancing longest dimension one-month post-therapy from baseline (HR> 1.0, p< 0.05) and T2 FLAIR enhancing volume at baseline (HR< 1.0, p< 0.05).
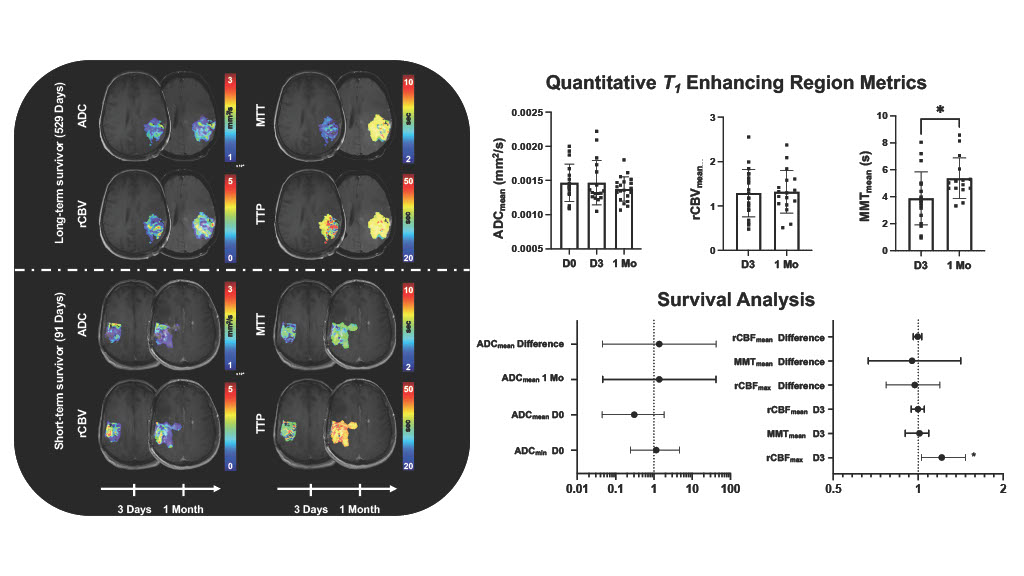
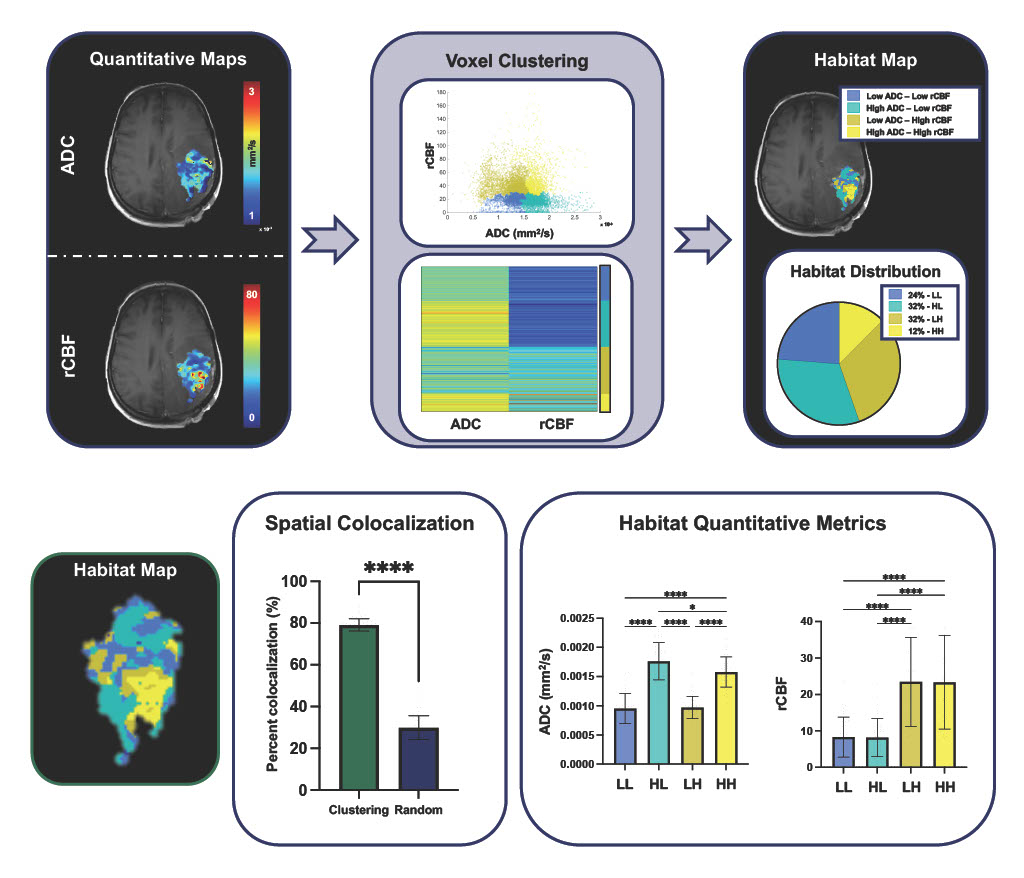
Figure 4. Workflow for the definition of intratumoral habitats based on vascular and cellular properties obtained from quantitative MRI. Tumor habitats were further evaluated for spatial colocalization and biological distinction, through multiregional interaction matrix analysis and metric comparison across defined habitats (p< 0.0001).