0373
Assessment of structural-functional integration impact on connectivity abnormalities in glioma patients1Padova Neuroscience Center, University of Padova, Padova, Italy, 2Department of Information Engineering, University of Padova, Padova, Italy, 3Department of Medicine, Unit of Nuclear Medicine, University of Padova, Padova, Italy, 4Department of Neuroscience, University of Padova, Padova, Italy
Synopsis
Keywords: Tumors (Pre-Treatment), Brain Connectivity, Glioma; Multimodal; Integration; Structural Connectivity; Functional Connectivity
Motivation: Brain networks glioma’s disruption was often explored through separate examinations of structural and functional connectivity. However, there were limited efforts in glioma research to investigate the interplay between structure-function and how this connection might influence our comprehension.
Goal(s): Can integrating structural and functional connectivity aid understanding the alterations’ neurobiological foundation in brain networks caused by glioma?
Approach: The study design involves standard diffusion MR and rs-fMRI preprocessing, statistical methods including Pearson and Spearman correlation and Euclidean distance computation.
Results: This study underscores the significance of examining structure-function integration, where both microstructure and function play crucial roles in relation to white matter integrity.
Impact: Glioma, the primary brain tumor, affects both structural and functional connectivity. Understanding alterations in structure-function integration and connection with single-modalities, may be of highest significance for a more comprehensive explanation of compensatory mechanisms induced by glioma and its clinical progression.
Introduction
Several neuroimaging studies have separately investigated structural (in white matter, WM) and functional (in grey matter, GM) connectivity alteration in glioma patients. In fact, this brain tumor can modify brain function1 and WM integrity2 through expansion, invasion and intra-tumoral changes3. Nonetheless, most of the studies focused on abnormalities within major WM tracts4,5, or microstructure2, or within specific functional GM regions6, lacking for a comprehensive and integrated network overview7,8.This work aims to explore the interplay between structural (SC) and functional (FC) connectivity at the individual level and to assess whether changes in this link: 1) may have an impact on understanding tumor's effect on key brain networks and 2) correlate with tumors topological characteristics.
Methods
41 patients with de novo glioma at different locations (22-left/14-right/5-bilateral) and grades (I-IV) were enrolled in the study. Data were acquired with a 3T Siemens Biograph mMR PET/MR scanner: Diffusion MR images (dMRI) collected following the optimized NODDI protocol9 (TR/TE-5355ms/104ms-2x2x2mm3, b-values 0/710/2855s/mm2, 100 directions), rs-fMRI acquired for 15-min (TR/TE-1260/30ms-3x3x3mm3). Lesion masks were manually delineated by an expert neuroradiologist.SC and FC matrices were computed using the cortical parcellation scheme provided by the Yan homotopic functional atlas (100 parcels, 17 networks)10.
For each patient, the MRtrix311 software was used to process dMRI images and generate the tractogram12,13 (10M streamlines-iFOD214). In addition, tissues microstructure was quantified using NODDI9, DTI15 and DKI16 models, yielding eight different microstructure maps. The SC matrices were quantified with two different metrics: a) the number of streamlines (SCnos) of the tractogram and b) the single microstructure matrix (SNFmicro), obtained by applying the similarity network fusion approach17 to the eight microstructure matrices.
Rs-fMRI data underwent state-of-the-art pre-processing18,19. FC matrices were calculated as Pearson correlation between signals of each pair of regions of interest 10.
Overall, for each patient, connectivity was assessed using three distinct modes: SCnos, SNFmicro and FC. The three matrices were next concatenated, obtaining an Integration Matrix (IM-100x300), to define an individual SC/FC measure.
To explore the added value of an integrated approach in comparison to the single modalities, changes in the connectivity were assessed according to single and integrated modalities.
Starting from the patients’ group of each connectivity mode, a pseudo-healthy matrix was computed as the median across all the patients, after removing tracts/parcels overlapped with the lesion, and used as reference to detect significant changes. The pseudo-reference of the three connectivity modalities were also concatenated, generating the pseudo-reference IM.
For each patient/modality, Spearman correlation was used to assess the similarity between each parcel connectivity profile and its pseudo-reference profile (row by row).
Considering the similarity distribution (single or integrated mode) of all the subjects, a parcel was set as altered if distance from the pseudo-healthy profile fell in the lower tail of the distribution (i.e., below 5%). Next, the connectivity impairment of each network20 was computed as the Network Alteration Degree (percentage of altered parcels within the same network).
To investigate point 2), patients Network-Lesion distance was classified as Near/Far, according to the mean Euclidean distance between parcel-lesion centroids (threshold=76.17mm).
Results
Figures 1 and 2 show, above, for networks Near/Far to the lesion, IM Network Alteration Degree in overlap with the three single modalities. Right-SalVentAttnB, Right-DefaultA and Right-LimbicB are the near networks more often altered among the patients (range 24%-29%). Left-DefaultA, Right-DefaultA and Right-SalVentAttnA are the networks far from the lesions more frequently altered across the patients (range 17%-27%). These regions are known to be in overlap with higher frequency lesions position.Figures 1 and 2 also represent, below, for each network, the percentage of altered patients, distinguishing into IM-alone (pink bar) and IM-in-overlap (grey bar) abnormalities. It’s worth highlighting that several networks present both IM-alone and IM-in-overlap alterations. Nonetheless, networks near to the lesion are more frequently characterized by IM-alone alteration (53% against 32% of networks present IM-alone alterations). To be noticed that Left-LimbicA and Left-VisCent, are respectively the unique near and far networks to present only IM-alone alteration (accounting for 2% and 2%).
Discussion
Our results show that IM provides a complementary view of connectivity changes in glioma with respect to single modality connectivity, and this is true especially for networks near to the lesion position. From a topological perspective, the most frequently altered IM networks are within the right hemisphere, in regions known to be in overlap with higher lesion frequency.Conclusions
These results suggest that, when performing studies on glioma, the integration of functional connectivity with microstructure and structural integrity, could provide major insights about key networks alterations and highlights specific topological-relevant tumors characteristics.Acknowledgements
No acknowledgement found.References
1. Daniel, A. G. S. et al. Functional connectivity within glioblastoma impacts overall survival. Neuro Oncol 23, 412–421 (2021). doi: 10.1093/neuonc/noaa189.
2. Wei, Y. et al. Structural connectome quantifies tumour invasion and predicts survival in glioblastoma patients. Brain 146, 1714–1727 (2023). doi: 10.1093/brain/awac360.
3. D’Souza, S., Hirt, L., Ormond, D. R. & Thompson, J. A. Retrospective analysis of hemispheric structural network change as a function of location and size of glioma. Brain Commun 3, (2021). doi: 10.1093/braincomms/fcaa216.
4. Mahmoodi, A. L., Landers, M. J. F., Rutten, G. J. M. & Brouwers, H. B. Characterization and Classification of Spatial White Matter Tract Alteration Patterns in Glioma Patients Using Magnetic Resonance Tractography: A Systematic Review and Meta-Analysis. Cancers vol. 15, (2023). doi: 10.3390/cancers15143631.
5. Friedrich, M. et al. Alterations in white matter fiber density associated with structural MRI and metabolic PET lesions following multimodal therapy in glioma patients. Front Oncol 12, (2022). doi: 10.3389/fonc.2022.998069.
6. Liu, Y. et al. Structural and Functional Reorganization Within Cognitive Control Network Associated With Protection of Executive Function in Patients With Unilateral Frontal Gliomas. Front Oncol 10, (2020). doi: 10.3389/fonc.2020.00794.
7. Aerts, H., Fias, W., Caeyenberghs, K. & Marinazzo, D. Brain networks under attack: Robustness properties and the impact of lesions. Brain vol. 139, 3063-3083 (2016). doi: 10.1093/brain/aww194.
8. De Baene, W., Rutten, G. J. M. & Sitskoorn, M. M. The Temporal Pattern of a Lesion Modulates the Functional Network Topology of Remote Brain Regions. Neural Plast 2017, (2017). doi: 10.1155/2017/3530723.
9. Zhang, H., Schneider, T., Wheeler-Kingshott, C. A. & Alexander, D. C. NODDI: Practical in vivo neurite orientation dispersion and density imaging of the human brain. Neuroimage 61, 1000-1016 (2012). doi: 10.1016/j.neuroimage.2012.03.072.
10. Yan, X. et al. Homotopic local-global parcellation of the human cerebral cortex from resting-state functional connectivity. Neuroimage 273, (2023). doi: 10.1016/j.neuroimage.2023.120010.
11. Tournier, J. D. et al. MRtrix3: A fast, flexible and open software framework for medical image processing and visualisation. Neuroimage 202, 116137 (2019). doi: 10.1016/j.neuroimage.2019.116137.
12. Smith, R. E., Tournier, J. D., Calamante, F. & Connelly, A. Anatomically-constrained tractography: Improved diffusion MRI streamlines tractography through effective use of anatomical information. Neuroimage 62, 1924–1938 (2012). doi: 10.1016/j.neuroimage.2012.06.005.
13. Smith, R. E., Tournier, J. D., Calamante, F. & Connelly, A. SIFT: Spherical-deconvolution informed filtering of tractograms. Neuroimage 67, 298–312 (2013). doi: 10.1016/j.neuroimage.2012.11.049.
14. Tournier, J.-D. & , F. Calamante, and a. C. Improved probabilistic streamlines tractography by 2 nd order integration over fibre orientation distributions. Ismrm 88, 2010 (2010).
15. Basser, P. J., Mattiello, J. & LeBihan, D. MR diffusion tensor spectroscopy and imaging. Biophys J 66, 259–267 (1994). doi: 10.1016/S0006-3495(94)80775-1.
16. Steven, A. J., Zhuo, J. & Melhem, E. R. Diffusion Kurtosis Imaging: An Emerging Technique for Evaluating the Microstructural Environment of the Brain. American Journal of Roentgenology 202, (2013). doi: 10.2214/AJR.13.11365.
17. Hansen, J. Y. et al. Integrating multimodal and multiscale connectivity blueprints of the human cerebral cortex in health and disease. PLoS Biol 21, e3002314 (2023). doi: 10.1371/journal.pbio.3002314.
18. Smith, S. M. et al. Advances in functional and structural MR image analysis and implementation as FSL. in NeuroImage vol. 23 (2004). doi: 10.1016/j.neuroimage.2004.07.051.
19. Avants, B. B. et al. A reproducible evaluation of ANTs similarity metric performance in brain image registration. Neuroimage 54, 2033–2044 (2011). doi: 10.1016/j.neuroimage.2010.09.025.
Figures
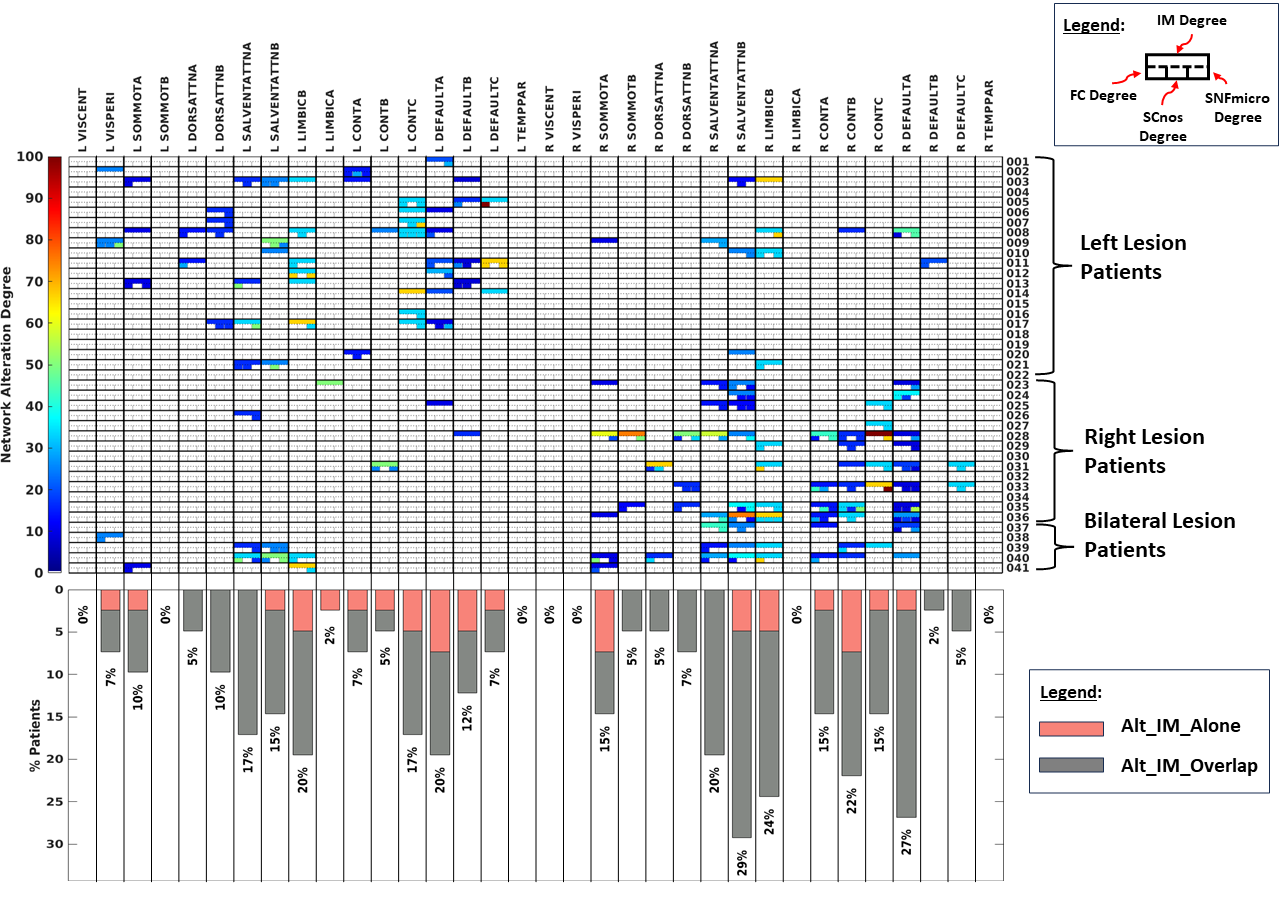
Figure 1: Above: Network Alteration Degree for networks near to the lesion. For each network-patient pair, IM, FC, SCnos and SNFmicro alteration degrees are reported, as illustrated in the legend. Patients are grouped by lesion hemisphere. Below: Percentage of patients with altered IM networks. In pink alterations of IM alone (networks are altered according to IM, but not according to single modalities), in grey alterations of IM in overlap with at least a single modality (networks are altered according to IM and at least a single modality). Results are illustrated for 5% lower tail.
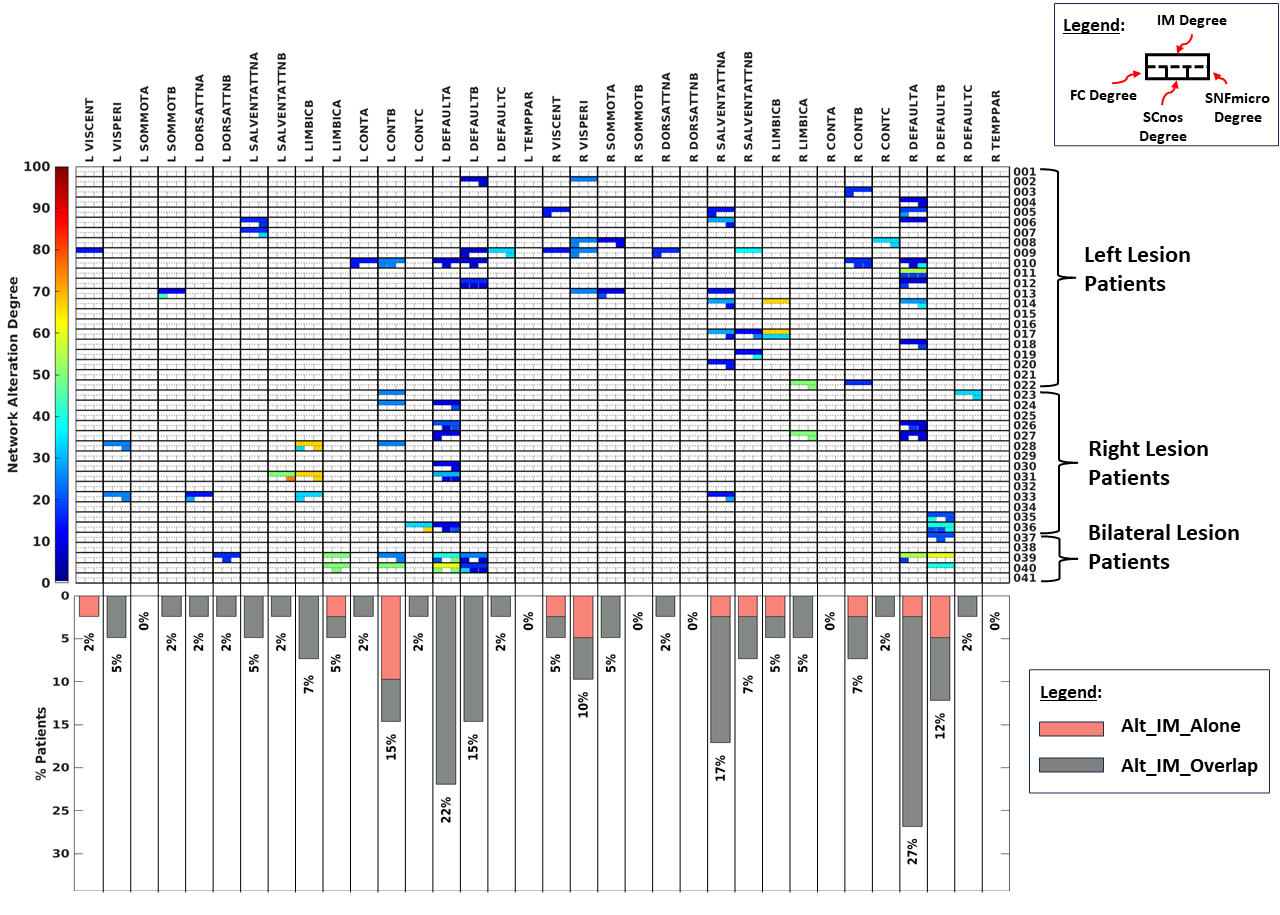
Figure 2: Above: Network Alteration Degree for networks far from the lesion. For each network-patient pair, IM, FC, SCnos and SNFmicro alteration degrees are reported, as illustrated in the legend. Patients are grouped by lesion hemisphere. Below: Percentage of patients with altered IM networks. In pink alterations of IM alone (networks are altered according to IM, but not according to single modalities), in grey alterations of IM in overlap with at least a single modality (networks are altered according to IM and at least a single modality). Results are illustrated for 5% lower tail.