0372
Investigation of 1H and hyperpolarized 13C spectroscopy-based biomarkers for dual inhibition of TERT and EGFR in GBM cell and animal models.1Department of Radiology and Biomedical Imaging, University of California San Francisco, San Francisco, CA, United States
Synopsis
Keywords: Tumors (Post-Treatment), Spectroscopy, Tumor, Drugs, Hyperpolarized MR (Non-Gas)
Motivation: Inhibiting TERT or its upstream transcription factor GABPB1 can result in tumor growth inhibition. Inhibiting EGFR, upstream of TERT, can also reduce TERT expression.
Goal(s): Investigating the combined effects of EGFR and TERT inhibition and assessing whether our MRS-based biomarkers can detect the impact of this combination therapy in cell and animal models.
Approach: Proton and hyperpolarized 13C spectroscopy in cell and animal models
Results: Enhanced inhibition of both cell and tumor growth was observed in our GBM models when TERT/GABPB1 and EGFR were targeted simultaneously. This was associated with a drop in hyperpolarized lactate production from pyruvate.
Impact: This study identifies HP lactate as a metabolic biomarker of response to the dual TERT/GABPB1 and EGFR inhibition in cells and animals and points to the value of this biomarker in detecting the added value of this novel combination therapy.
Introduction
Telomerase reverse transcriptase (TERT) promoter mutations are commonly observed in most glioblastoma (GBM) tumors, leading to TERT expression, which is crucial for tumor growth. In our previous study1, we have shown that inhibiting TERT or its upstream transcription factor GABPB1 can result in tumor growth inhibition and we identified 1H-MRS-detectable glutathione (GSH) and lactate, combined with 13C-MRS-detectable HP lactate, as metabolic biomarkers of TERT-targeted therapy. Furthermore, a recent study has reported that inhibiting epidermal growth factor receptor (EGFR), which signals upstream of TERT, can also reduce TERT expression2. This study aimed to investigate the combined effects of EGFR and TERT or GABPB1 inhibition and assess whether our MRS-based biomarkers can detect the impact of this combination therapy in cell and animal models.Methods
We silenced TERT or GABPB1 genes in U251 GBM cells using shRNA transduction as previously described1 (U251shCtrl, U251shTERT, U251shB1) and treated the cells with the EGFR inhibitor Gefitinib (500nM, Sigma) or vehicle DMSO. First, we determined the cell doubling times. Then the cells were extracted using the dual-phase extraction method and a proton spectrum of the aqueous phase was obtained on a 500 MHz spectrometer (Bruker). MNOVA (Mestrelab Research) was used to analyze the spectra. For the animal experiments, we intracranially injected 3 x 10⁵ cells (U251shCtrl, U251shTERT, or U251shB1) into athymic nude rats (5-6 weeks, male, Envigo). Tumor volume was monitored using T2-weighted MR images. When the tumor volume reached approximately 27 mm3, we acquired a pre-treatment data set using proton and hyperpolarized (HP) 13C spectroscopy. The rats were then treated with Gefitinib (80mg/kg) or DMSO every 24 hours until the endpoint. On Day 10, we acquired a post-treatment data set. MR data were acquired using a 3T pre-clinical scanner (Bruker, Germany) equipped with a quadrature 1H-13C volume coil (Neos-Biotech, Spain). Proton single voxel spectroscopy data was acquired from the tumor region using the PRESS sequence with TE = 16 ms, voxel size = 4 x 4 x 4 mm3, and CHESS water suppression. Proton spectra were analyzed with LCModel3 (Provencher, Canada).2.5 ml of [1-13C]pyruvate polarized using a HyperSense Polarizer (Oxford instrument, UK) was injected via the tail vein. Echo planar spectroscopic imaging (EPSI) with multiband excitation (FA = 30 degrees on lactate and 6 degrees on pyruvate) acquired HP imaging data with spatial resolution = 2.5 x 2.5 x 8 mm3, temporal resolution = 3 sec, NR = 20. For the acquired EPSI data, the SNR of each voxel spectrum at every time point was improved using tensor denoising1,4. Spectra were analyzed using an in-house Matlab (Mathwork, MA) script for all post-processing and spectral quantification procedures. ANOVA was used to determine the significance of metabolite differences between groups. p-values < 0.05 were considered to be statistically significant. * signifies p < 0.05, **p < 0.01, ***p < 0.001, and ns = not significant.Results
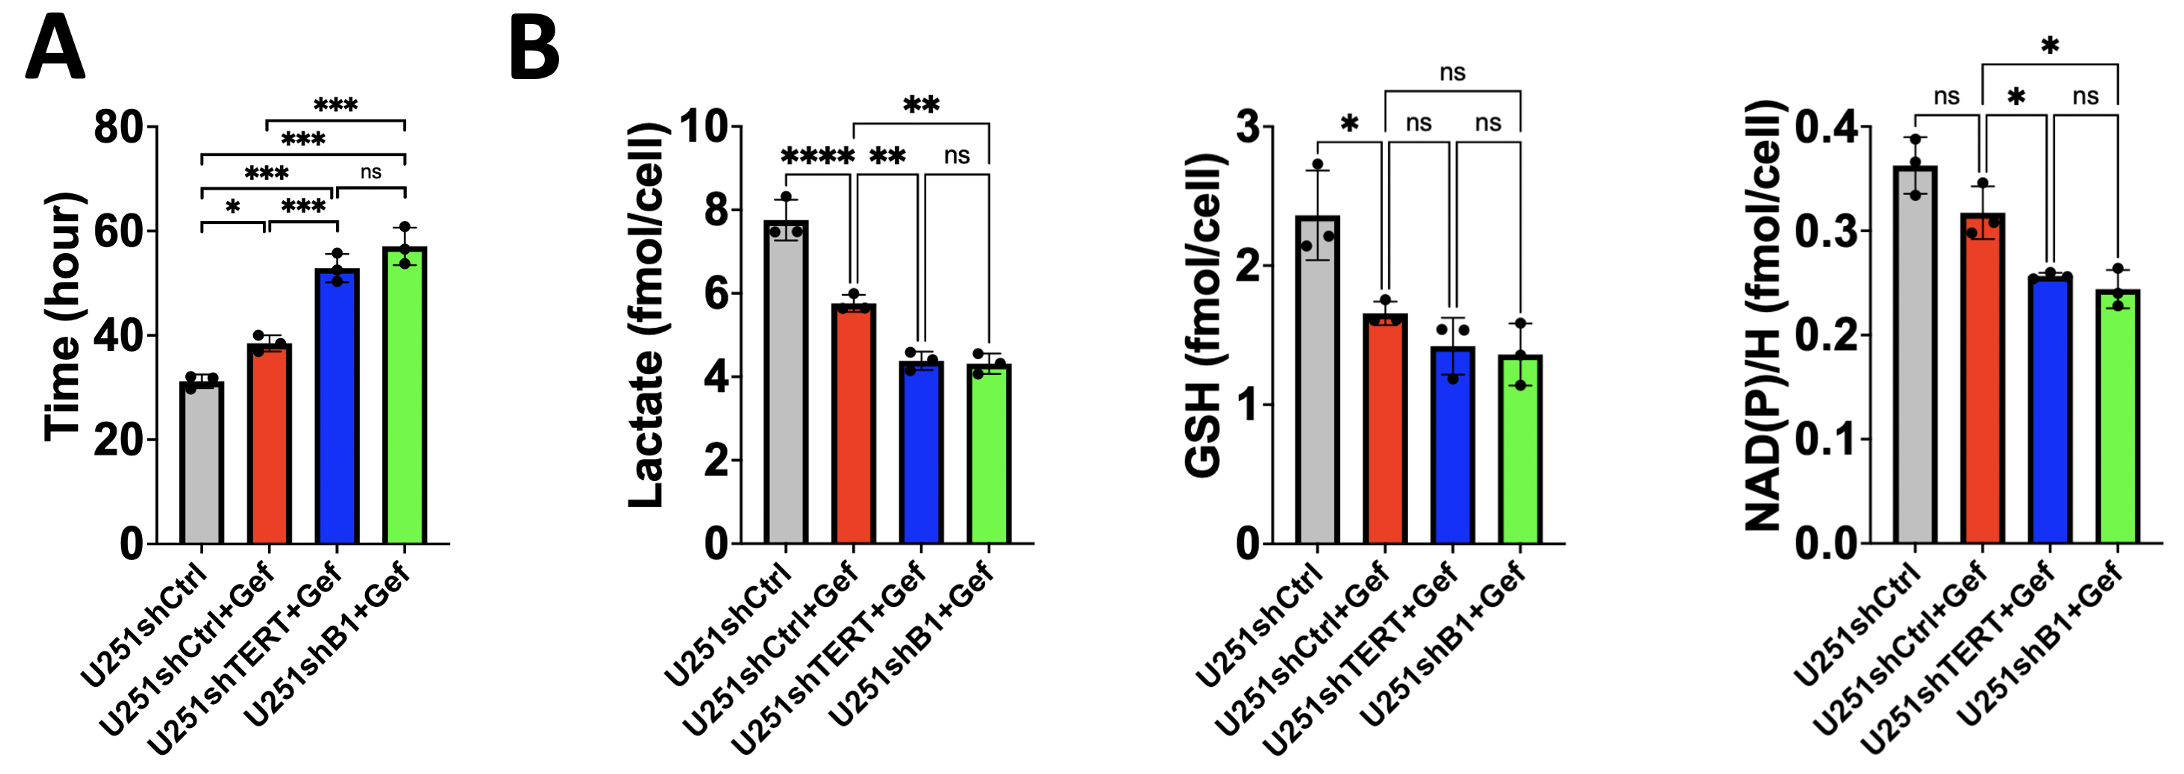
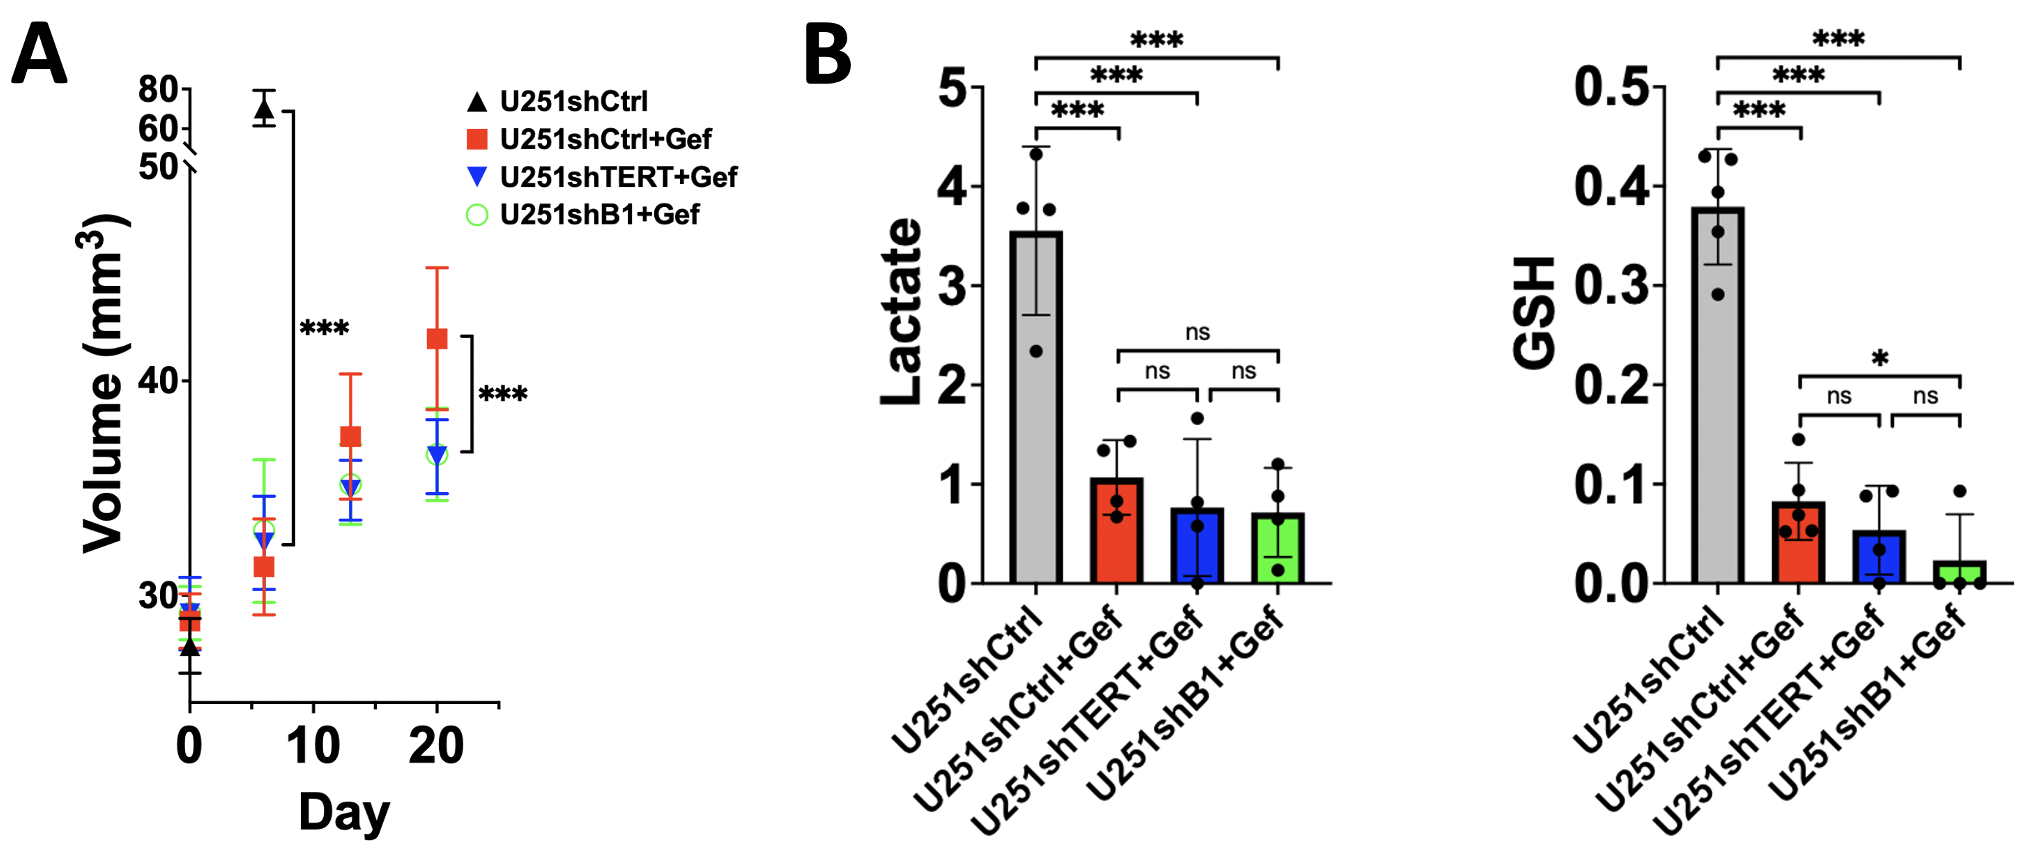
As expected, gefitinib inhibited cell proliferation. Furthermore, the combination of TERT or GABPB1 and EGFR inhibition led to an even greater inhibition of cell proliferation (see Fig.1A). In the proton spectrum, the EGFR inhibitor decreased lactate, GSH, and NAD(P)H significantly. Following a combination of TERT or GABPB1 and EGFR inhibition, lactate, and NAD(P)H were further decreased, mirroring the effect on cell proliferation (see Fig.1B).Similarly, in animals, the EGFR inhibitor rapidly inhibited tumor growth (see Day 7 in Fig. 2A), and the combination therapies had an even greater impact on tumor growth (see Day 21 in Fig. 2A). In vivo proton single-voxel spectroscopy showed a significant reduction in lactate and GSH levels after EGFR inhibition. Lactate and GSH trended to a drop after the combination treatments, but the drop mostly did not reach statistical significance.
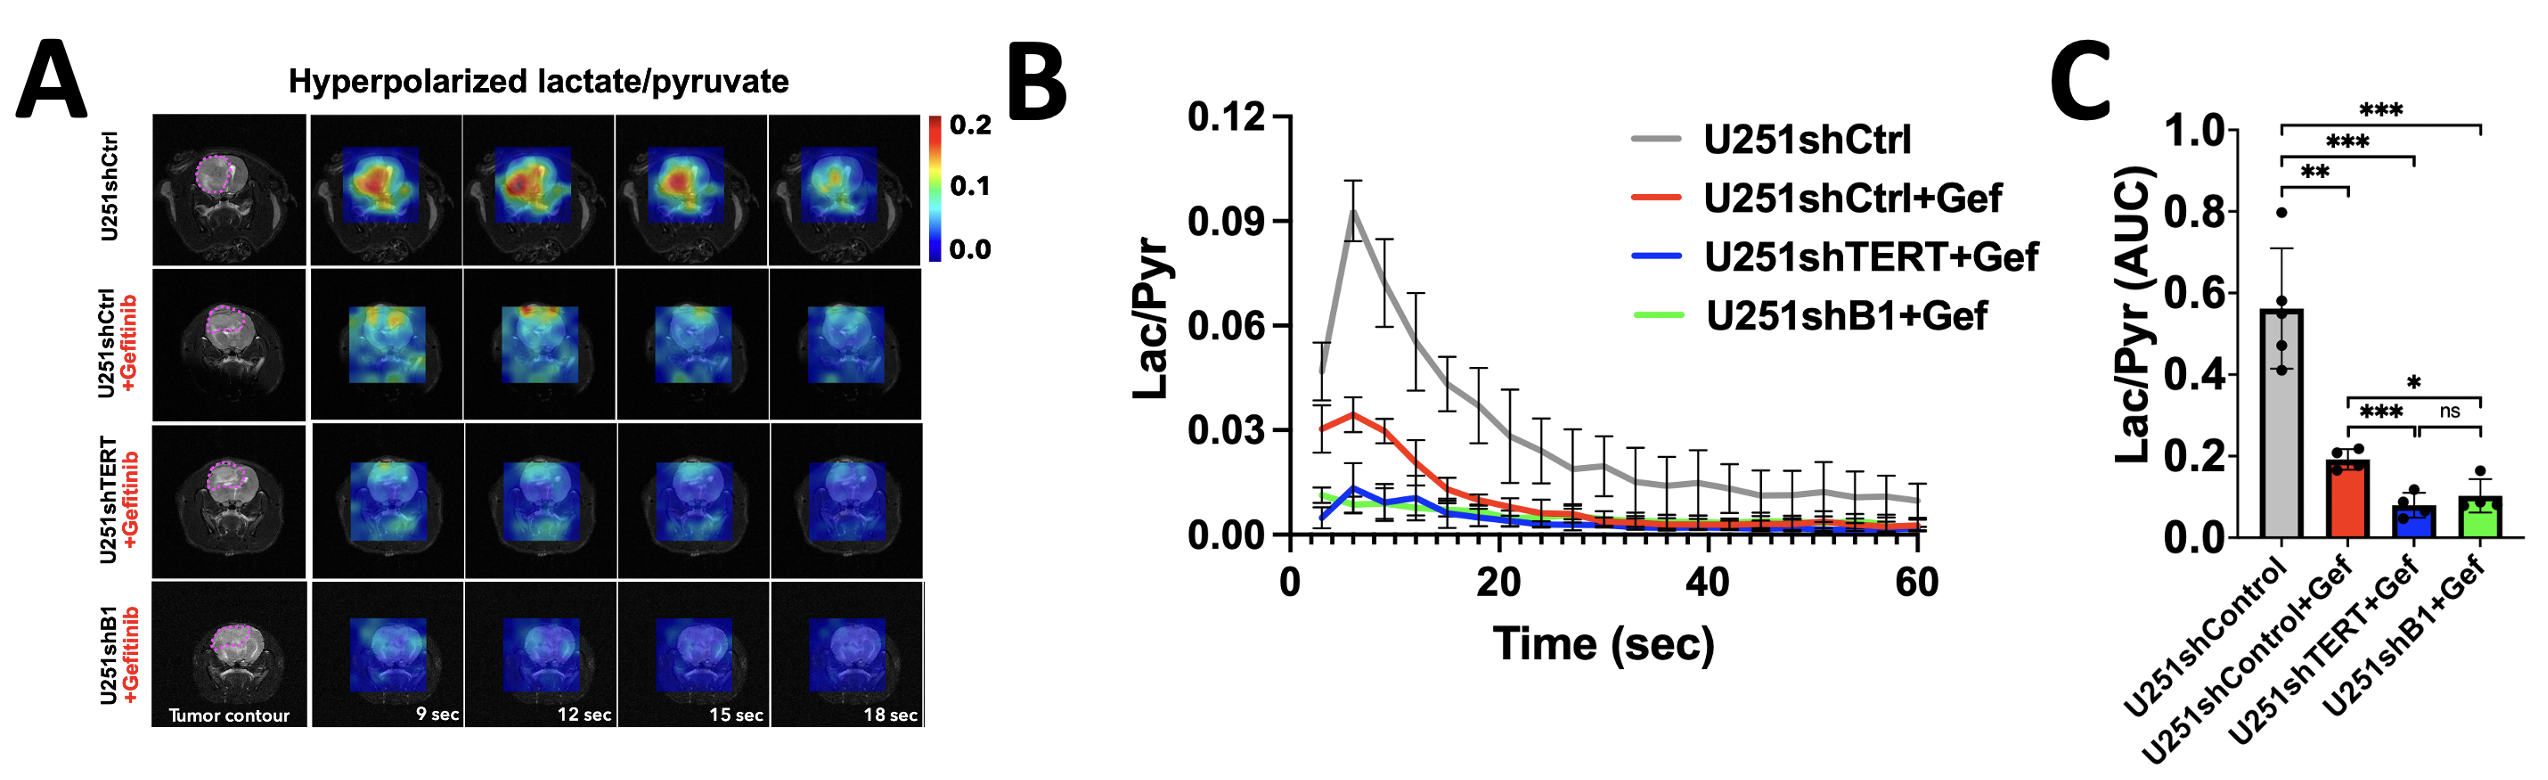
Nonetheless, HP 13C spectroscopic imaging showed significantly decreased HP lactate production from HP pyruvate after EFGR inhibition and a further significant drop was observed following the dual TERT or GABPB1 and EFGR inhibition. This is illustrated in Fig. 3A, which shows the dynamic heatmap of HP lactate, Fig. 3B, which shows the evolution of HP lactate in the different groups, and Fig. 3C, which shows quantified HP lactate levels.
Discussion
The inhibition of both cell and tumor growth was enhanced in our GBM model when TERT or GABPB1 were targeted simultaneously with EGFR, supporting the use of dual treatment with TERT/GABPB1 and EGFR inhibitors in GBM. Our study also identifies HP lactate as a metabolic biomarker of response to the dual treatment at the cellular and in vivo levels, and points to the value of this biomarker in detecting the added value of this combination therapy.Acknowledgements
This work was supported by NIH R01CA172845, NIH P01CA118816, LOGLIO collective, and NICO project.References
1. Minami N, Hong D, Stevers N, et al. Imaging biomarkers of TERT or GABPB1 silencing in TERT-positive glioblastoma. Neuro-oncology. 2022; 24(11):1898-1910.
2. McKinney AM, Mathur R, Stevers NO, et al. GABP couples oncogene signaling to telomere regulation in TERT promoter mutant cancer. Cell reports. 2022; 40(12).
3. Hong D, Rohani Rankouhi S, Thielen J-W, Van Asten JJ, Norris DG. A comparison of sLASER and MEGA-sLASER using simultaneous interleaved acquisition for measuring GABA in the human brain at 7T. PLoS One. 2019; 14(10):e0223702.
4. Brender JR, Kishimoto S, Merkle H, et al. Dynamic imaging of glucose and lactate metabolism by 13C-MRS without hyperpolarization. Scientific reports. 2019; 9(1):3410.
Figures